Weather data can be downloaded from the Internet. The data of this example is downloaded from http://data.cma.cn/.
The downloaded data is installed in the txt file.
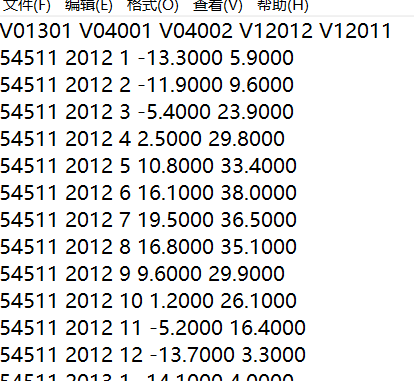
It contains the lowest and highest monthly temperature in Beijing since the 12th year.
Read data:
1 with open('S201812261702093585500.txt') as file_object:
2     lines=file_object.readlines()
Save the data in txt line by line into the list lines. Each element of lines corresponds to a line in txt. Then extract different information from each element:
1 file1=[]
2 row=[]
3 for line in lines:
4     row=line.split() #Specify a space as a separator pair line Slice
5     file1.append(row)
In this way, all information exists in file1. File1 is nested with list row. Each element in file1 contains a list, and all information is separated.
You can take a look at print(file1):

You need to use the year, month, minimum temperature and maximum temperature information of columns 2, 3, 4 and 5 to extract them respectively.
 1 date=[]
 2 highs=[]
 3 lows=[]
 4 for row1 in file1:
 5     a=row1[1]+"-"+row1[2] #Combined years
 6     date.append(a) 7 for row1 in file1:
 8     lows.append(row1[3])
 9     highs.append(row1[4])
When reading data, the header is also read in, and the first element of the list is deleted
1 del highs[0]
2 del lows[0]
3 del date[0]
Now, date and temperature data are stored in the date, height and rows lists respectively, but they can't be used directly, because the extracted data are all character data, and the conversion data format is int type:
1 int_highs=[]
2 for str_h in highs:
3     a=int(float(str_h))
4     int_highs.append(a)
5
6 int_lows=[]
7 for str_l in lows:
8     a=int(float(str_l))
9     int_lows.append(a)
To convert a date to a date format, you need to use the datetime module and add from datetime import datetime at the beginning of the file
1 from datetime import datetime
2 dates=[]
3 for a in date:
4     current_dates=datetime.strptime(a,'%Y-%m')
5     dates.append(current_dates)
Import matplotlib module
1 from matplotlib import pyplot as plt
2 import matplotlib.dates as mdates
Now we are going to draw a picture:
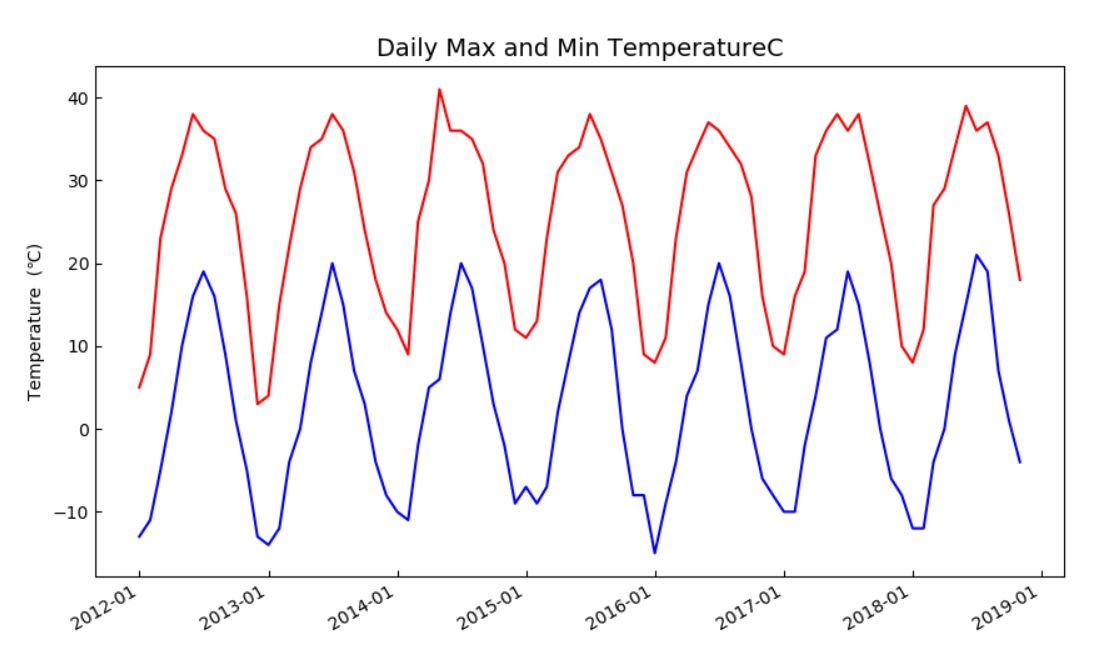
 1 fig=plt.figure(figsize=(10,6))
 2 ax1=fig.add_subplot(111) # Split the screen into 1 row and 1 column, select the first one
 3 ax1.xaxis.set_major_formatter(mdates.DateFormatter('%Y-%m'))#Format horizontal axis as date
 4 ax1.plot(dates,int_highs,c="red")#Painting maximum temperature, colorful
 5 ax1.plot(dates,int_lows,c="blue")#Draw minimum temperature, color blue
 6 fig.autofmt_xdate()
 7 ax1.set_title("Daily Max and Min TemperatureC",fontsize=14)#Title
 8 ax1.set_ylabel("Temperature  (℃)")#Vertical axis label
 9 ax1.tick_params(direction='in')#Scale to the inside
10 plt.show()
A good picture: