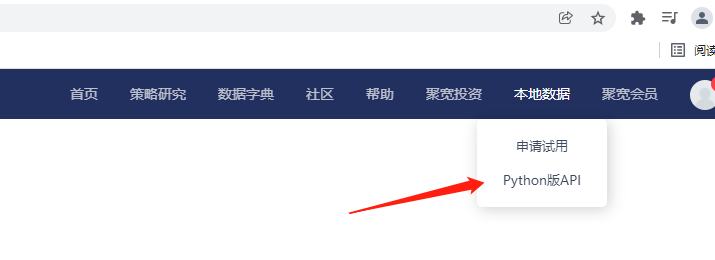
Get stock data through Python API
Code example
Get the stock information of Ping An Bank
from jqdatasdk import *
auth('','')
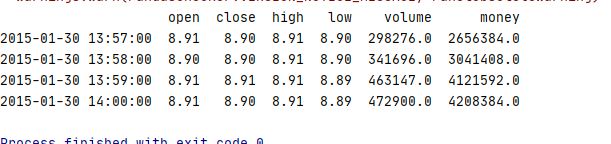
#Obtain the data of Ping An Bank in the first four time units based on "2015-01-30 14:00:00" in a 1-minute cycle
df = get_price('000001.XSHE', end_date='2015-01-30 14:00:00',count=4, frequency='minute', fields=['open','close','high','low','volume','money'])
print(df)
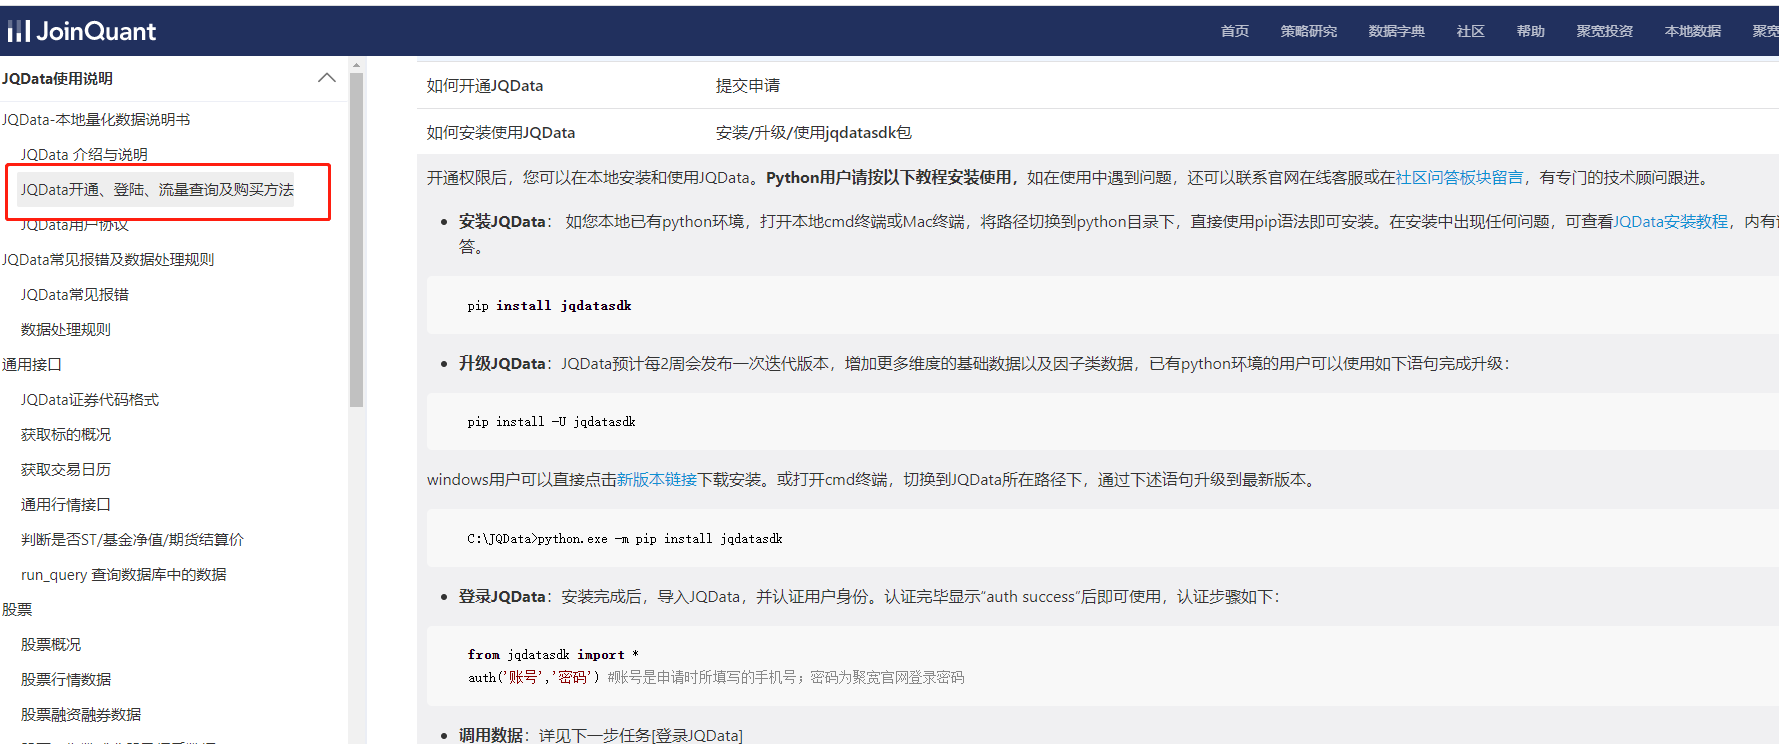
You can see the introduction to each API on the official website:
XSHG Shanghai Stock Exchange; XSHE - Shenzhen Stock Exchange.
How to obtain the market data of all A shares
from jqdatasdk import *
import time

#Convert all stock lists into arrays
stocks = list(get_all_securities(['stock']).index)

for stock_code in stocks:
    print("Getting stock market data, stock code:", stock_code)
    df = get_price(stock_code, end_date='2021-05-30 14:00:00',count=5, frequency='1d', fields=['open','close','high','low','volume','money'])
    print(df)
    time.sleep(3)
Use the Resample function to convert the day K data
1, What is the resample function?
It is a method function of the Python data analysis library Pandas.
It is mainly used to convert the frequency of time series. You can do some statistical summary work.
What is the frequency of conversion time series?
For example, the day k and week k of the stock,
Suppose I can only get the data of stock day K, for example, from November 1 to November 5, how can I convert it into K-line in weeks?
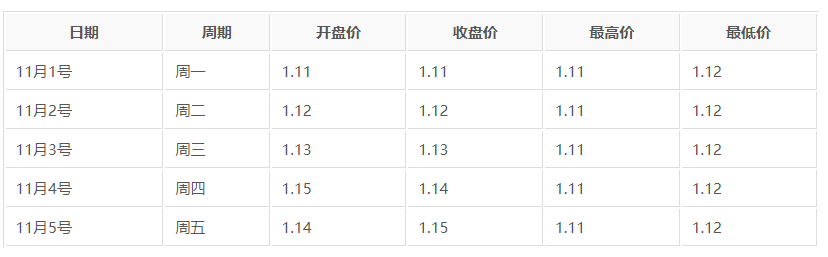
First of all, we should clarify what is the opening, closing, maximum and minimum of week K. The opening price of each week is the opening price on the first day of the week, and the closing price is the closing price on the last day of the week. Its highest price is the highest price of the week, and the lowest price is the lowest of all the lowest prices of the week. So you go to the stock trading platform. Its weekly K is recorded on Friday's trading day. The opening, closing, maximum and minimum are calculated according to the rule I just explained. The selection rules for month K and year K are the same. The cycle of month K is one month, and the cycle of year K is one year.
The accuracy of this calculation can also be verified by online data. This calculation rule includes the calculation of opening, closing, maximum and minimum, and clean up what the resample function can do. In addition, resample also has a function of statistical summary. For example, if I want to calculate the total weekly trading volume of a stock, I can use resample Sum function to add up the trading volume from Monday to Friday.
In order to facilitate everyone's memory, you can also understand resample as the pivot table function in Excel. You can do various screening and summary statistics according to the date. The most important thing is that he can follow the date.
2, Actual Resample function
1. Convert day K to week K
Resample is the method under the Pandas DataFrame.
Here we only explain two common parameters, one is rule and the other is closed.
- rule indicates what kind of cyclical indicator you put in it. m represents Month, Y represents year, and W represents Week,
- Closed means which boundary you take. For example, if I convert day k to week k, do I take Monday or Friday as the boundary? This is determined by closed.
from jqdatasdk import *
import pandas as pd


#Obtain the data of Ping An Bank in the first four time units based on "2015-01-30 14:00:00" in a 1-minute cycle
df = get_price('000001.XSHE', end_date='2015-01-30 14:00:00',count=20, frequency='1d', fields=['open','close','high','low','volume','money'])
print(df)
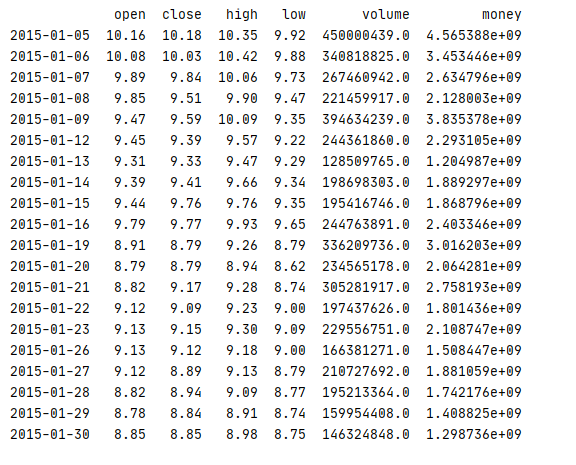
You can see that all the data from April 28 to May 28 have been obtained. To facilitate understanding, we add another column of data, that is, the column in which the current date is the day of the week
from jqdatasdk import *
import pandas as pd


#Obtain the data of Ping An Bank in the first four time units based on "2015-01-30 14:00:00" in a 1-minute cycle
df = get_price('000001.XSHE', end_date='2015-01-30 14:00:00',count=20, frequency='1d', fields=['open','close','high','low','volume','money'])
df["weekday"]=df.index.weekday
print(df)
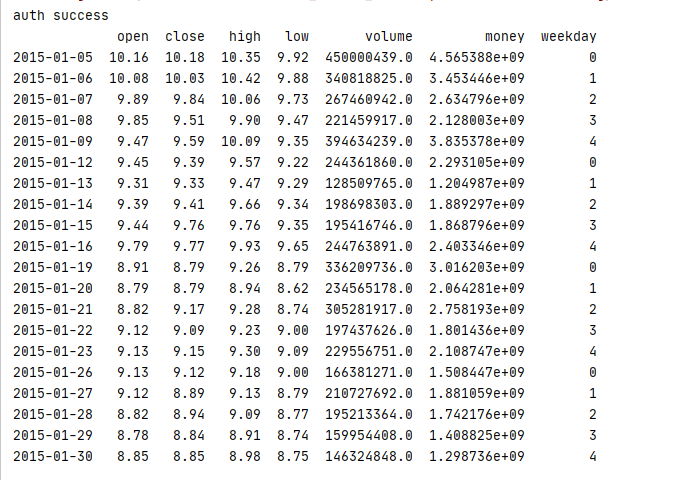
Here 0 stands for Monday. How to convert it to statistics by "week"
. Volume and money are converted to total volume and total turnover
from jqdatasdk import *
import pandas as pd

#Obtain the data of Ping An Bank in the first four time units based on "2015-01-30 14:00:00" in a 1-minute cycle
df = get_price('000001.XSHE', end_date='2015-01-30 14:00:00',count=20, frequency='1d', fields=['open','close','high','low','volume','money'])
df["weekday"]=df.index.weekday
print(df)

df_week = pd.DataFrame()
df_week['open'] = df['open'].resample('W').first()
df_week['close'] = df['close'].resample('W').last()
df_week['high'] = df['high'].resample('W').max()
df_week['low'] = df['low'].resample('W').min()
df_week['volume(sum)'] = df['volume'].resample('W').sum()
df_week['money(sum)'] = df['money'].resample('W').sum()

print(df_week)
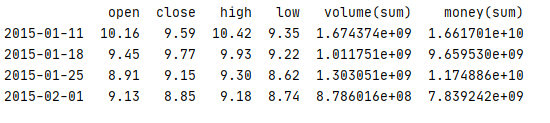
You can see that 2021-05-30 here is the last day of a week. Its corresponding opening price is indeed this figure. It shows that the weekly K data we calculated is correct.
The closing price is the data on the last day of the weekly closing price.
The highest price is the maximum closing price per week.
The lowest price is the minimum of the weekly closing price.
Convert day K to month K
Suppose I have one year's data, how should I convert it to month K?
Only 2 places need to be changed:
- Add start_date gets the data of a whole year
- Change the parameter of resample to M, where M stands for Month
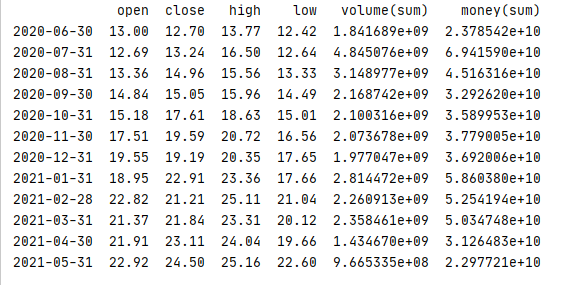
#Obtain the data of Ping An Bank in the first four time units based on "2015-01-30 14:00:00" in a 1-minute cycle
df = get_price('000001.XSHE', end_date='2021-05-30 14:00:00', start_date='2020-05-30',frequency='1d', fields=['open','close','high','low','volume','money'])
df["weekday"]=df.index.weekday
print(df)

df_week = pd.DataFrame()
df_week['open'] = df['open'].resample('M').first()
df_week['close'] = df['close'].resample('M').last()
df_week['high'] = df['high'].resample('M').max()
df_week['low'] = df['low'].resample('M').min()
df_week['volume(sum)'] = df['volume'].resample('M').sum()
df_week['money(sum)'] = df['money'].resample('M').sum()

print(df_week)