When using Python for data analysis, we often look at the distribution of a data, and then process the data. For example, there is a scene:
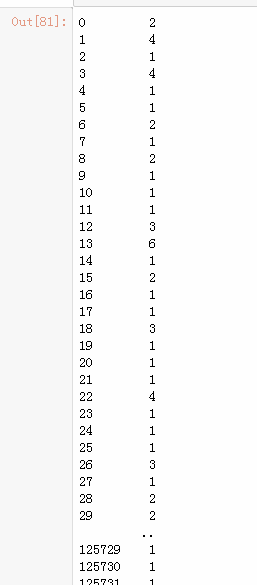
The following data are pre-scheduled dates for a product:
import pandas as pd
import seaborn as sns
import matplotlib.pyplot as plt
import seaborn as sns
import numpy as np
%matplotlib inline
data = (pd.read_csv('D:/Users/Merchants_portrait.csv')).astype('int')
avg_days_befor = (data['avg_days_befor'].value_counts()).reset_index()
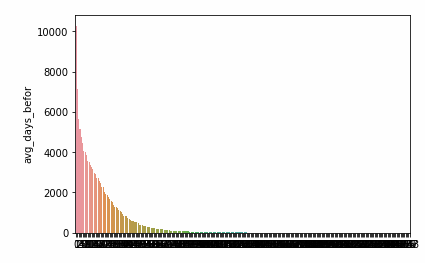
sns.barplot(x = avg_days_befor.index, y = avg_days_befor['avg_days_befor'])
plt.show() # Figure 3This picture looks ugly, because there are many days, so the abscissa is dense.
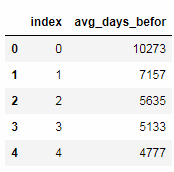
Let's look at the number of days in advance and the number of products per day.
avg_days_befor.head()
Look at the distribution.
#Distribution of pre-scheduled days under observation
avg_days_befor.describe()
As can be seen from the table below, the number of days scheduled in advance ranges from 0 to 633, and 75% of them are within 200.
| index | avg_days_befor | |
|---|---|---|
| count | 259.000000 | 259.000000 |
| mean | 139.382239 | 485.555985 |
| std | 97.080785 | 1240.626948 |
| min | 0.000000 | 1.000000 |
| 25% | 64.500000 | 2.000000 |
| 50% | 129.000000 | 17.000000 |
| 75% | 194.500000 | 180.000000 |
| max | 633.000000 | 10273.000000 |
According to the above analysis, if we want to change the number of days in advance to the stage distribution, we can do the following:
We first define a function rewritten in a predetermined number of days, then apply the lambda function to that column, and update the result to that column of the original data. If we do not rewrite to the original data, the original data frame will not change.
#Rewrite for pre-scheduled days
def fun_avg_days_befor(x):
    if x <= 7:
        return 1
    elif x > 7 and x <= 14:
        return 2
    elif x > 14 and x <= 21:
        return 3
    elif x > 21 and x <= 28:
        return 4
    elif x > 28 and x <= 35:
        return 5
    elif x > 35 and x <= 42:
        return 6
    elif x > 42 and x <= 49:
        return 7
    elif x > 49 and x <= 56:
        return 8
    elif x > 56 and x <= 63:
        return 9
    else:
        return 10

#Effectiveness of data on the original dataframe
data['avg_days_befor'] = data['avg_days_befor'].apply(lambda x:fun_avg_days_befor(x))

avg_days_befor = (data['avg_days_befor'].value_counts()).reset_index()
Let's first look at the results of the changes:
sns.barplot(x = avg_days_befor.index, y = avg_days_befor['avg_days_befor'])
plt.show() # Figure 3
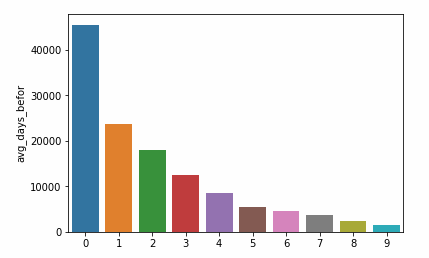
As you can see, the results have been changed to the original data set.
So what if we execute the statement directly without copying the original dataframe? Let's look at the results.
#Rewrite for pre-scheduled days
def fun_avg_days_befor(x):
    if x <= 7:
        return 1
    elif x > 7 and x <= 14:
        return 2
    elif x > 14 and x <= 21:
        return 3
    elif x > 21 and x <= 28:
        return 4
    elif x > 28 and x <= 35:
        return 5
    elif x > 35 and x <= 42:
        return 6
    elif x > 42 and x <= 49:
        return 7
    elif x > 49 and x <= 56:
        return 8
    elif x > 56 and x <= 63:
        return 9
    else:
        return 10

data['avg_days_befor'].apply(lambda x:fun_avg_days_befor(x))
As can be seen from the following results, he is just a simple result, and there will be no change in looking at the original dataframe.