Official website: https://pandas.pydata.org/docs/reference/api/pandas.DataFrame.resample.html
objective
This article is mainly written with the function of resample, the explanation of parameter configuration, and what parameters it can be used with.
It will be explained as follows
1. What effect can resample achieve
2. What are the parameters of resample
3. Common resample classification examples
1. What effect can resample achieve
resample can be combined with various time dimensions for grouping and aggregation. For grouping, you can use max, min, sum, mean, etc.
It can be used with three scenarios
Group by mapping, function, label, or list of labels.
Resample a Series.
Resample a DataFrame
example
Suppose I have a batch of data, with 2 rows, one row of time series and one row of specific numbers, which are displayed in DataFrame. The details are as follows.
import pandas as pd
rng = pd.date_range("1/1/2012", periods=100, freq="D")
ts = pd.Series(np.random.randint(0, 500, len(rng)), index=rng)
ts = ts.reset_index(name='num')
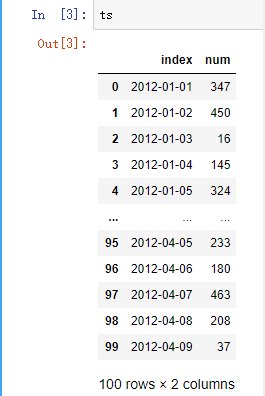
Note: the data generated are from January 1, 2012 to April 09, 2012.
demand
Now there is a demand for the sum of data under different time dimensions, such as weekly and monthly.
Completion requirements
First, set the date type field as the index. This step is to be used with resample. It can only be used with datetimeindex
ts = ts.set_index('index')
ts.head()
-----------------------
            num
index
2012-01-01  104
2012-01-02  249
2012-01-03  177
2012-01-04  262
2012-01-05  318
-------------------------
ts.index
-------------------------
DatetimeIndex(['2012-01-01', '2012-01-02', '2012-01-03', '2012-01-04',
               '2012-01-05', '2012-01-06', '2012-01-07', '2012-01-08',
               '2012-01-09', '2012-01-10', '2012-01-11', '2012-01-12',
               '2012-01-13', '2012-01-14', '2012-01-15', '2012-01-16',
               '2012-01-17', '2012-01-18', '2012-01-19', '2012-01-20',
               '2012-01-21', '2012-01-22', '2012-01-23', '2012-01-24',
               '2012-01-25', '2012-01-26', '2012-01-27', '2012-01-28',
               '2012-01-29', '2012-01-30', '2012-01-31', '2012-02-01',
               '2012-02-02', '2012-02-03', '2012-02-04', '2012-02-05',
               '2012-02-06', '2012-02-07', '2012-02-08', '2012-02-09',
               '2012-02-10', '2012-02-11', '2012-02-12', '2012-02-13',
               '2012-02-14', '2012-02-15', '2012-02-16', '2012-02-17',
               '2012-02-18', '2012-02-19', '2012-02-20', '2012-02-21',
               '2012-02-22', '2012-02-23', '2012-02-24', '2012-02-25',
               '2012-02-26', '2012-02-27', '2012-02-28', '2012-02-29',
               '2012-03-01', '2012-03-02', '2012-03-03', '2012-03-04',
               '2012-03-05', '2012-03-06', '2012-03-07', '2012-03-08',
               '2012-03-09', '2012-03-10', '2012-03-11', '2012-03-12',
               '2012-03-13', '2012-03-14', '2012-03-15', '2012-03-16',
               '2012-03-17', '2012-03-18', '2012-03-19', '2012-03-20',
               '2012-03-21', '2012-03-22', '2012-03-23', '2012-03-24',
               '2012-03-25', '2012-03-26', '2012-03-27', '2012-03-28',
               '2012-03-29', '2012-03-30', '2012-03-31', '2012-04-01',
               '2012-04-02', '2012-04-03', '2012-04-04', '2012-04-05',
               '2012-04-06', '2012-04-07', '2012-04-08', '2012-04-09'],
              dtype='datetime64[ns]', name='index', freq=None)
-
weekly
# Sum by week ts.resample('7D').sum() -------------------------- num index 2012-01-01 1817 2012-01-08 2460 2012-01-15 2070 2012-01-22 2104 2012-01-29 1812 2012-02-05 2008 2012-02-12 1949 2012-02-19 2092 2012-02-26 2527 2012-03-04 1934 2012-03-11 1856 2012-03-18 1546 2012-03-25 1206 2012-04-01 1865 2012-04-08 441 -
monthly
# Sum by month
ts.resample('M').sum()
--------------------------
             num
index
2012-01-31  9552
2012-02-29  8233
2012-03-31  7596
2012-04-30  2306
2. What are the parameters of resample
2.1 parameters of resample function
Signature:
ts.resample(
    rule,
    axis=0,
    closed: Union[str, NoneType] = None,
    label: Union[str, NoneType] = None,
    convention: str = 'start',
    kind: Union[str, NoneType] = None,
    loffset=None,
    base: int = 0,
    on=None,
    level=None,
)
Docstring:
Resample time-series data.
| parameter | explain |
|---|---|
| freq | Indicates the resampling frequency, such as'M ',' 5min ', Second(15) |
| how='mean' | The function name or array function used to generate aggregate values, such as ‘mean’,‘ohlc’,np.max, etc. the default is' mean ', and other commonly used values There are 'first', 'last', 'medium', 'max' and 'min' |
| axis=0 | The default is the vertical axis, and the horizontal axis is set to axis=1 |
| fill_method = None | How to interpolate in ascending sampling, such as' fill ',' bfill ', etc |
| closed = 'right' | When downsampling, which section of each time period is closed, 'right' or 'left', the default is' right ' |
| label= 'right' | How to set the label of aggregate value during downsampling, for example, whether 9:30-9:35 will be marked as 9:30 or 9:35, Default 9:35 |
| loffset = None | The time correction value of the bin tag, such as' - 1s' or Second(-1), is used to advance the aggregation tag by 1 second |
| limit=None | The maximum number of periods allowed to fill when filling forward or backward |
| kind = None | Aggregate to period ('period ') or timestamp ('timestamp'), which is the index type of time series by default |
| convention = None | The Convention (start or end) used to convert the low frequency to the high frequency during the resampling period. Default 'end' |
If you need to understand the function parameters in detail, you can type the code yourself and experience the actual application. You can also press shift+tab to see the examples in the function description. There is no more detail here.
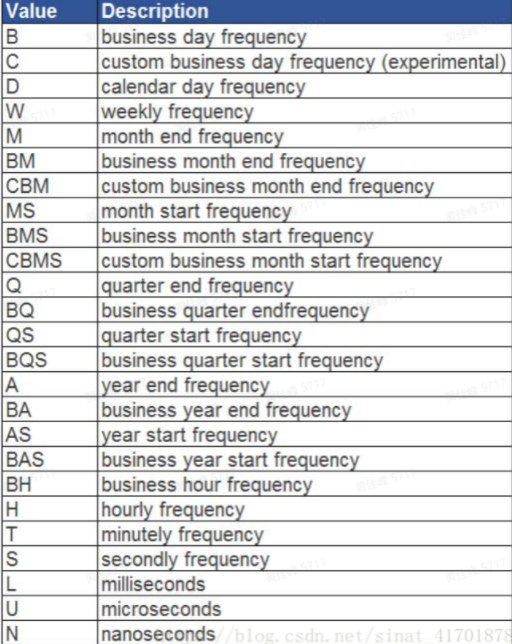
2.2 freq resampling parameters
freq resampling frequency has many parameters. Here are some collected by the network.
| alias | Offset type | explain |
|---|---|---|
| D | Day | Daily calendar day |
| B | BusinessDay | Daily working days (holidays) |
| H | Hour | Per hour |
| T/min | Minute | per minute |
| S | Second | Every second |
| M | MonthEnd | Last calendar day of each month |
| BM | BusinessMonthEnd | Last working day of each month |
| Q-JAN,Q-FRB | QuarterEnd | For a year ending in a specified month, The last calendar day of the last month of each quarter |
| A-JAN,A-FEB | YearEnd | The last calendar day of the specified month of each year |
3. Common resample classification examples
The key point is to observe the official examples. I think it is more important to briefly list the following.
January 1st of every decade
.resample('10AS')
Displayed as December 31 of every decade
.resample('10A')
days = pd.date_range('1/1/2000', periods=4, freq='D')
>>> d2 = {'price': [10, 11, 9, 13, 14, 18, 17, 19],
...       'volume': [50, 60, 40, 100, 50, 100, 40, 50]}
>>> df2 = pd.DataFrame(d2,
...                    index=pd.MultiIndex.from_product([days,
...                                                     ['morning',
...                                                      'afternoon']]
...                                                     ))
>>> df2
                      price  volume
2000-01-01 morning       10      50
           afternoon     11      60
2000-01-02 morning        9      40
           afternoon     13     100
2000-01-03 morning       14      50
           afternoon     18     100
2000-01-04 morning       17      40
           afternoon     19      50
>>> df2.resample('D', level=0).sum()
            price  volume
2000-01-01     21     110
2000-01-02     22     140
2000-01-03     32     150
2000-01-04     36      90