Preface
Although the data of financial management applications such as Tonghuashun is good enough, there is still an impulse to customize the data. Naturally, the data will not be much better than the former, but it is good to customize it according to your own ideas.
target
Data is obtained through a free data interface, and the historical transaction data of the subject matter is updated incrementally every day. Then visualization and data analysis are done through Kibana.
In fact, it is a good choice to do visualization through visualization frameworks such as echarts, but the cost is too high. Also, pandas+matplotlib is enough to meet most of the requirements, but the interaction is too weak, so it is necessary to use a visual application. kibana is chosen here, and its competitor is Grafana.
This goal should go on forever. You can get the code through the following links
https://github.com/youerning/stock_playground
Environmental configuration
Python 3 (recommended Anaconda installation)
Installation-related dependencies:
pip install -r requirement.txt
Configure eleastic search, kibana environment (docker is recommended)
Elasticsearch, Logstash, Kibana 7.2.0
data source
There are many ways to get data, charging or free, as amateurs naturally choose free, here choose tushare.pro, but in fact, tushare will have some limitations, such as the frequency of access to data is limited, and the interface is also limited, need a lot of points. If you are interested in registering, register through my recommendation link, so that I can share more about data visualization with you, and share the data I downloaded.
https://tushare.pro/register?reg=277890
It's worth noting that tushare is actually a free version with almost no restrictions. But pro version has more complete data. In order to avoid the cost of later maintenance, we choose pro version.
In fact, there are other free ways of data acquisition, you can try it yourself.
get data
Configure your own token
import tushare as ts
ts.set_token("<your_token>")
pro = ts.pro_api("<your_token>")
For Token access, you can refer to the link
Attempt to get data manually
Take the whole history of a certain day by date
df = pro.daily(trade_date='20190725')

df.head()
ts_code trade_date  open    high    low close   pre_close   change  pct_chg vol amount  value
0   000032.SZ   20190725    9.49    9.60    9.47    9.56    9.49    0.07    0.7376  12658.35    12075.625   8906.981000
1   000060.SZ   20190725    4.39    4.40    4.35    4.36    4.39    -0.03   -0.6834 129331.65   56462.292   -38586.330353
2   000078.SZ   20190725    3.37    3.38    3.35    3.38    3.37    0.01    0.2967  76681.00    25795.633   7653.564311
3   000090.SZ   20190725    5.66    5.66    5.56    5.61    5.64    -0.03   -0.5319 105582.72   59215.389   -31496.665409
4   000166.SZ   20190725    4.97    4.98    4.93    4.96    4.97    -0.01   -0.2012 268122.48   132793.120  -26717.975744

//Getting Daily Market Data of a Stock
data = ts.pro_bar(ts_code="601668.SH", adj='qfq', start_date="20120101")
data.head()
ts_code trade_date  open    high    low close   pre_close   change  pct_chg vol amount
0   601668.SH   20190726    6.01    6.06    5.98    6.03    6.04    -0.01   -0.17   696833.16   419634.547
1   601668.SH   20190725    6.05    6.07    6.02    6.04    6.04    0.00    0.00    543074.55   327829.380
2   601668.SH   20190724    6.09    6.11    6.02    6.04    6.05    -0.01   -0.17   788228.12   477542.609
3   601668.SH   20190723    5.93    6.07    5.92    6.05    5.94    0.11    1.85    1077243.46  650250.021
4   601668.SH   20190722    6.02    6.03    5.92    5.94    6.00    -0.06   -1.00   811369.73   485732.343
Data acquisition naturally requires automation, but due to interface limitations, the following issues need to be considered.
- Stock List
- Determine whether the interface limit is exceeded, and if so, pause for a period of time
Key Code Section
def save_data(code, start_date, fp):
    print("Download Stocks(%s)Daily data to %s" % (code, fp))

    try:
        data = ts.pro_bar(ts_code=code, adj='qfq', start_date=start_date)
        # Returns None when the number of calls exceeds the limit
        if data is None:
            time.sleep(10)
            return
        pass_set.add(code)
    except Exception:
        time.sleep(10)
        print("shares: %s Download failure" % code)
        return

    if len(data) == 0:
        pass_set.add(code)
        return

    try:
        data.trade_date = pd.to_datetime(data.trade_date)
        data = data.sort_values("trade_date")
        if path.exists(fp):
            data.to_csv(fp, mode="a", header=False, index=False)
        else:
            data.to_csv(fp, index=False)
    except Exception:
        print("shares:%s Save failed" % code)
You can refer to save_data.py of my GitHub repository and download the data automatically by following commands
python save_data.py
The starting time of the configuration in the code is 2012-01-01. The classes need to be changed by themselves. It is worth noting that config.json needs to be configured in the same directory, as follows.
{
    "token": "<your_token>"
}
Match your own token
Configure elastic search, kibana
The docker is used for configuration.
# Pull out the mirror
docker pull sebp/elk:720

# Start the docker environment
docker run -p 5601:5601 -p 9200:9200 -p 5044:5044 -v /home/elasticsearch/:/var/lib/elasticsearch -itd  sebp/elk:720
Transfer data
Upload data to elastic search for data analysis
Configure settings.py
# Change ip:port to your elastic search address, such as 192.168.56.102:9200
config["es_host"] = ["ip:port"]
Running code
# Upload stock data
python cmd.py dump

# Upload Shanghai Stock Index Data
python cmd.py dump_index
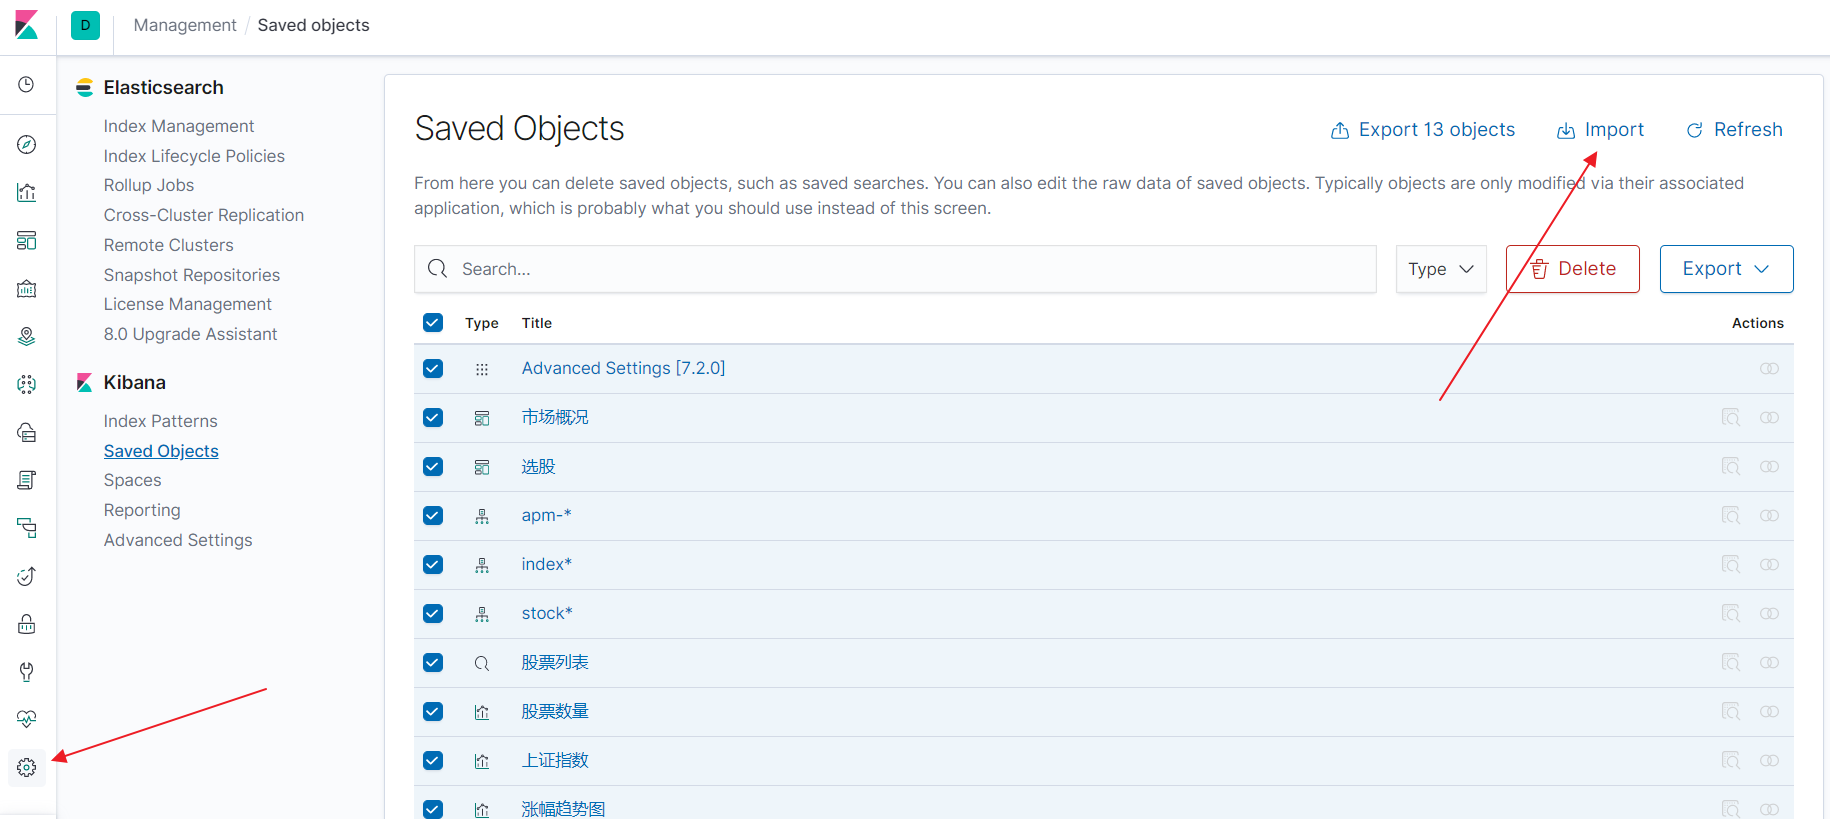
visualization
It takes some time to configure kibana. Fortunately, kibana now supports import and export in most configurations, so you can import it directly through the export.ndjson file in my warehouse.
Effect Show
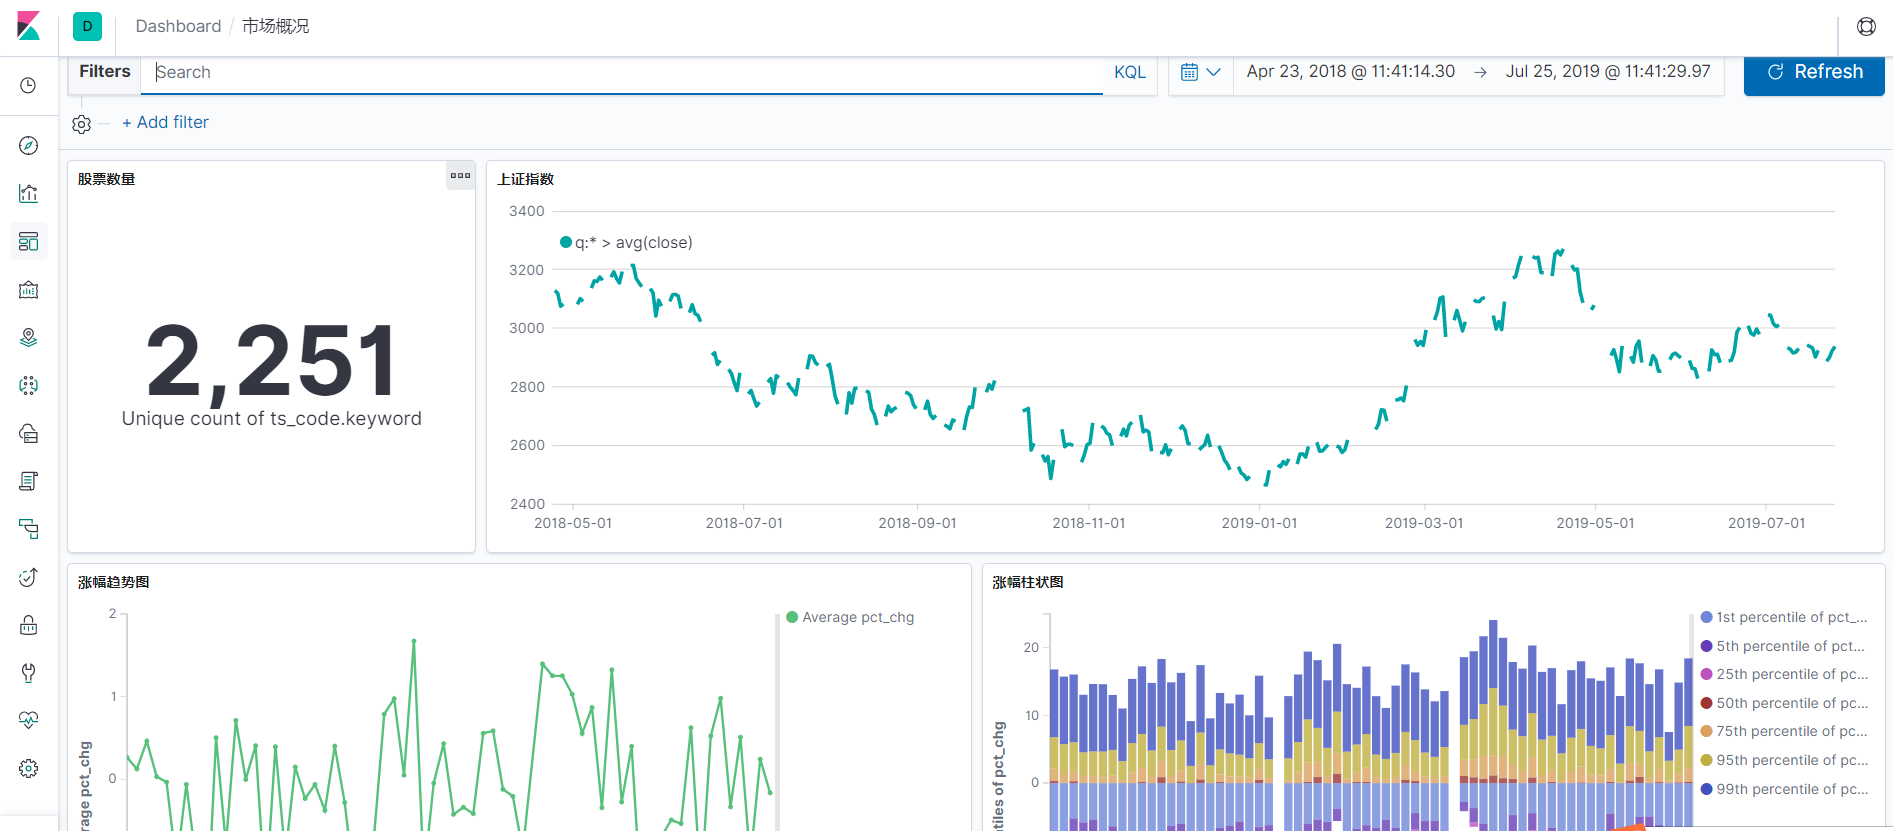
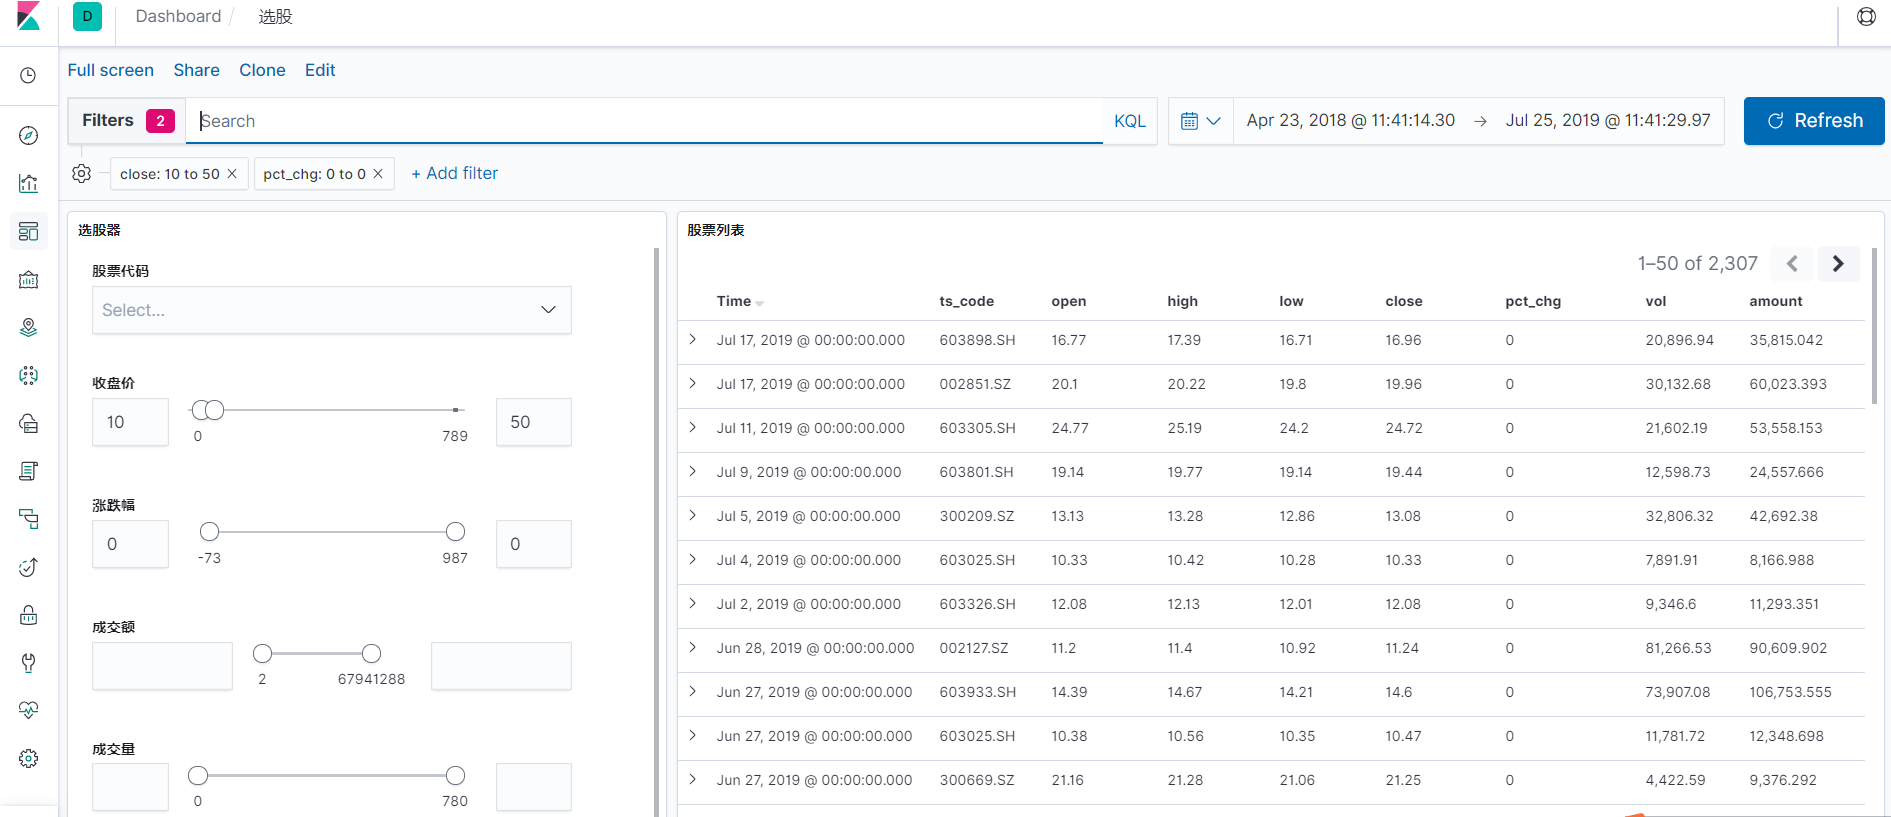
Because the interface is limited and the stock factor is limited, I will add more dashboard s and visualization when I get more points.
Epilogue
I hope I can complete my series of articles on building a trading system from scratch, and then lead to the road to freedom of working time and place.
Not for absolute wealth freedom, but for time and place freedom^^