Decision tree is a popular supervised learning method. The advantage of decision tree is that it can be used not only for regression, but also for classification. It does not need feature scaling, and it has better interpretability and is easy to visualize decision tree. Visual decision tree is not only a good way to understand your model, but also a good tool to introduce the operation mechanism of your model to others. Therefore, it is very important for data analysts to master the method of decision tree visualization.
Machine learning related courses: TensorFlow practice | Fundamentals of machine learning | Flash in simple terms | Python Foundation
In this tutorial, we will learn the following:
- How to train a decision tree model with scikit learn
- How to use Matplotlib to visualize decision tree
- How to use Graphviz to visualize decision tree
- How to visualize a single decision tree in a random forest or decision tree package
The code for the tutorial is available from Here Download. Now let's start.
1. Training decision tree model with scikit learn
In order to visualize the decision tree, we first need to train a decision tree model with scikit learn.
First, import the necessary Python libraries:
import matplotlib.pyplot as plt
from sklearn.datasets import load_iris
from sklearn.datasets import load_breast_cancer
from sklearn.tree import DecisionTreeClassifier
from sklearn.ensemble import RandomForestClassifier
from sklearn.model_selection import train_test_split
import pandas as pd
import numpy as np
from sklearn import tree
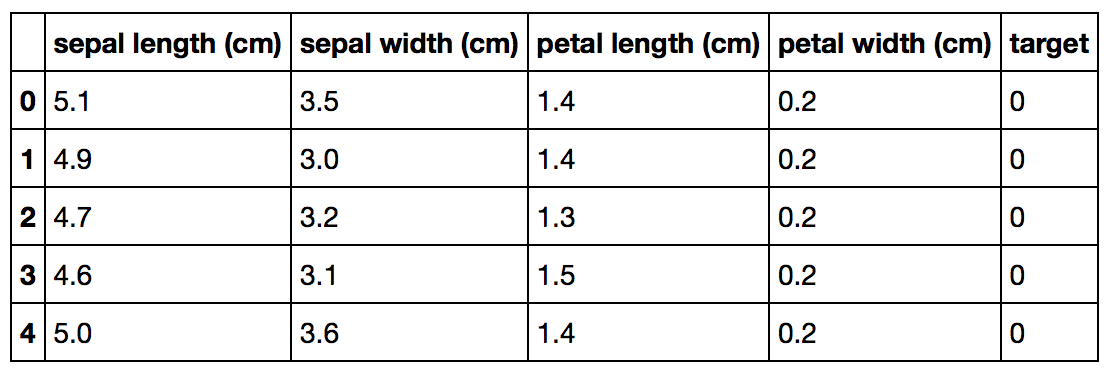
Then load the iris dataset. Scikit learn has iris datasets built in, so we don't need to download them from other websites. The following Python code loads the iris dataset:
import pandas as pd
from sklearn.datasets import load_irisdata = load_iris()
df = pd.DataFrame(data.data, columns=data.feature_names)
df['target'] = data.target
The Iris dataset looks like this:
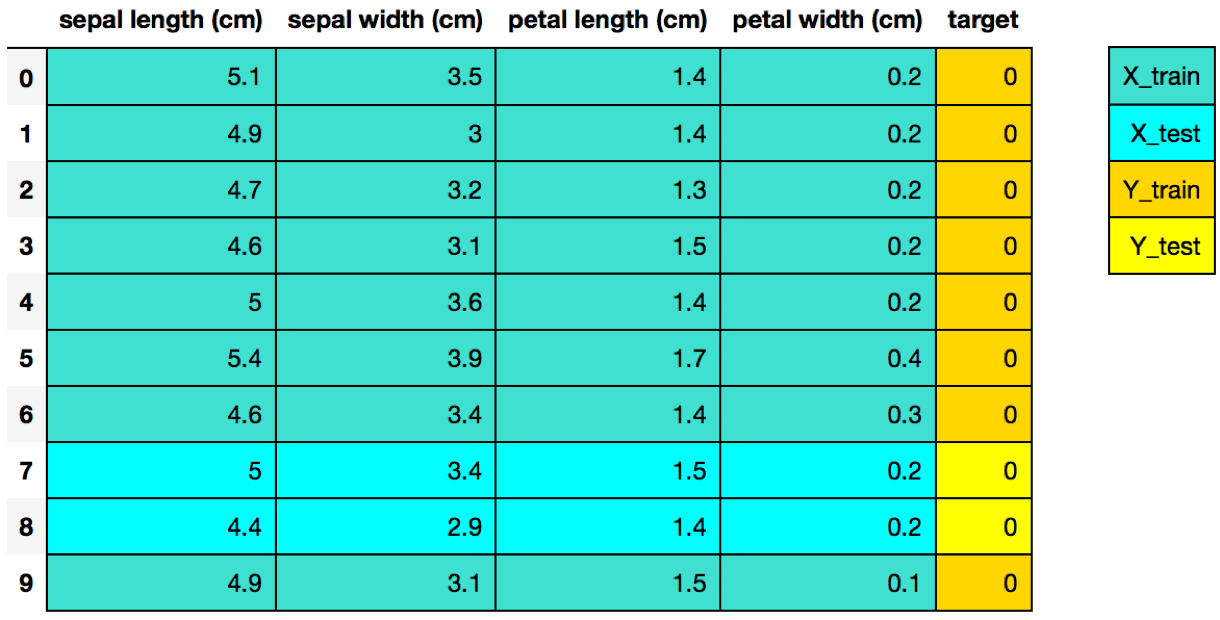
Next, we split Iris data set into training set and test set:
X_train, X_test, Y_train, Y_test = train_test_split(df[data.feature_names], df['target'], random_state=0)
The split Iris dataset looks like this:
Finally, we use the classic 4-step model of scikit learn to train the decision tree model
# Step 1: Import the model you want to use
# This was already imported earlier in the notebook so commenting out
#from sklearn.tree import DecisionTreeClassifier
# Step 2: Make an instance of the Model
clf = DecisionTreeClassifier(max_depth = 2,
                             random_state = 0)
# Step 3: Train the model on the data
clf.fit(X_train, Y_train)
# Step 4: Predict labels of unseen (test) data
# Not doing this step in the tutorial
# clf.predict(X_test)
2. Visualization of decision tree using Matplotlib
Starting from scikit learn version 21.0, you can use scikit learn's tree.plot'tree method to visualize the decision tree by using matplotlib instead of relying on the dot library that is difficult to install. The following Python code shows how to use scikit learn to visualize the decision tree:
tree.plot_tree(clf);
The visualization results of decision tree are as follows: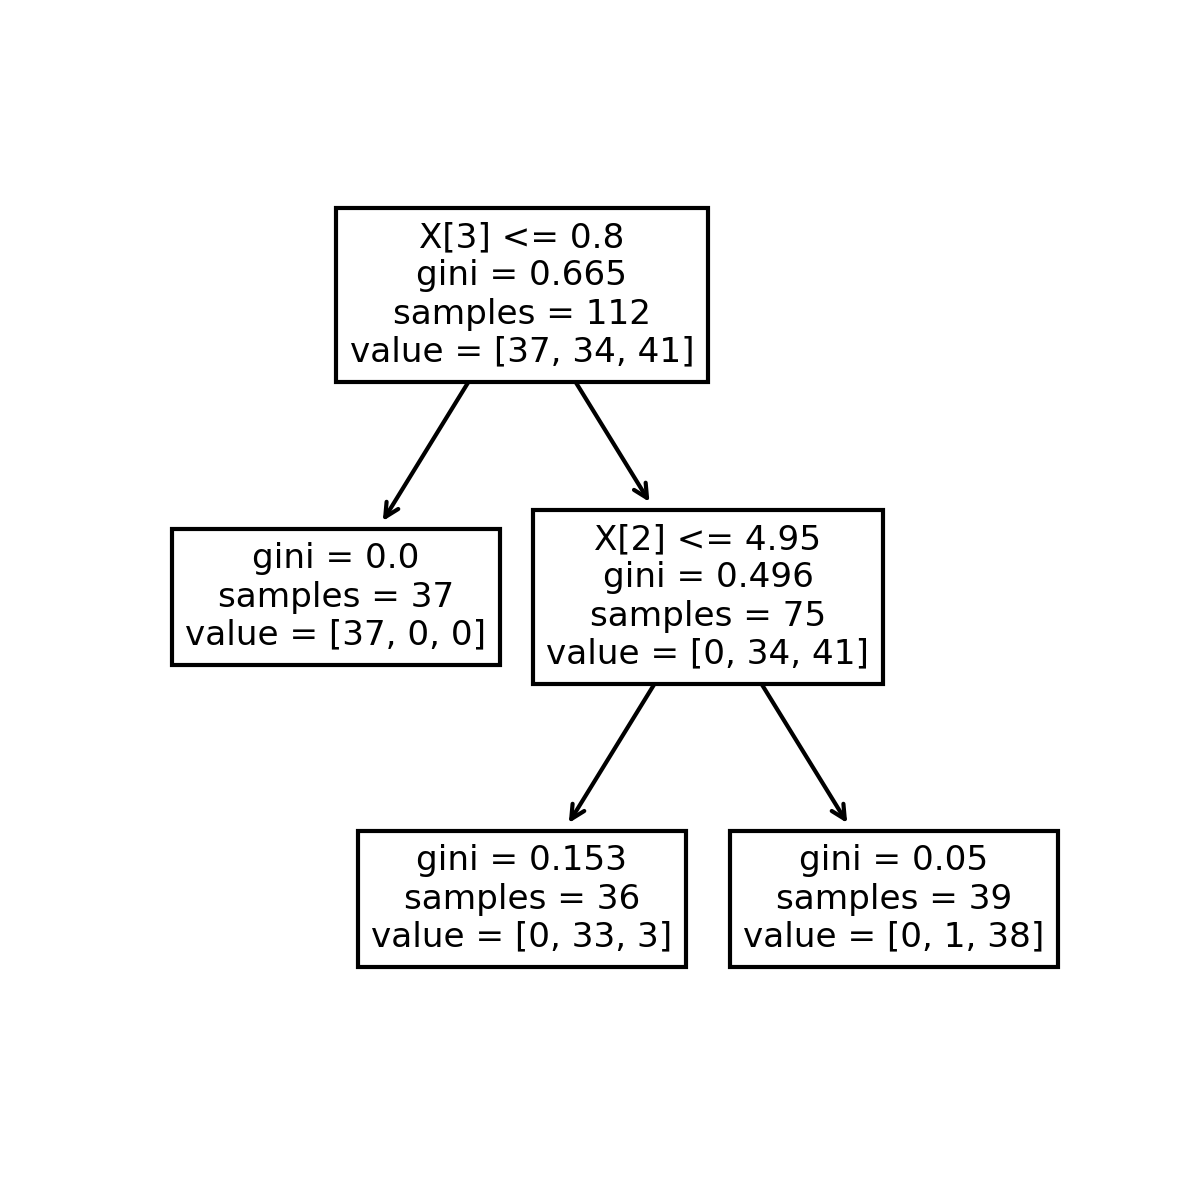
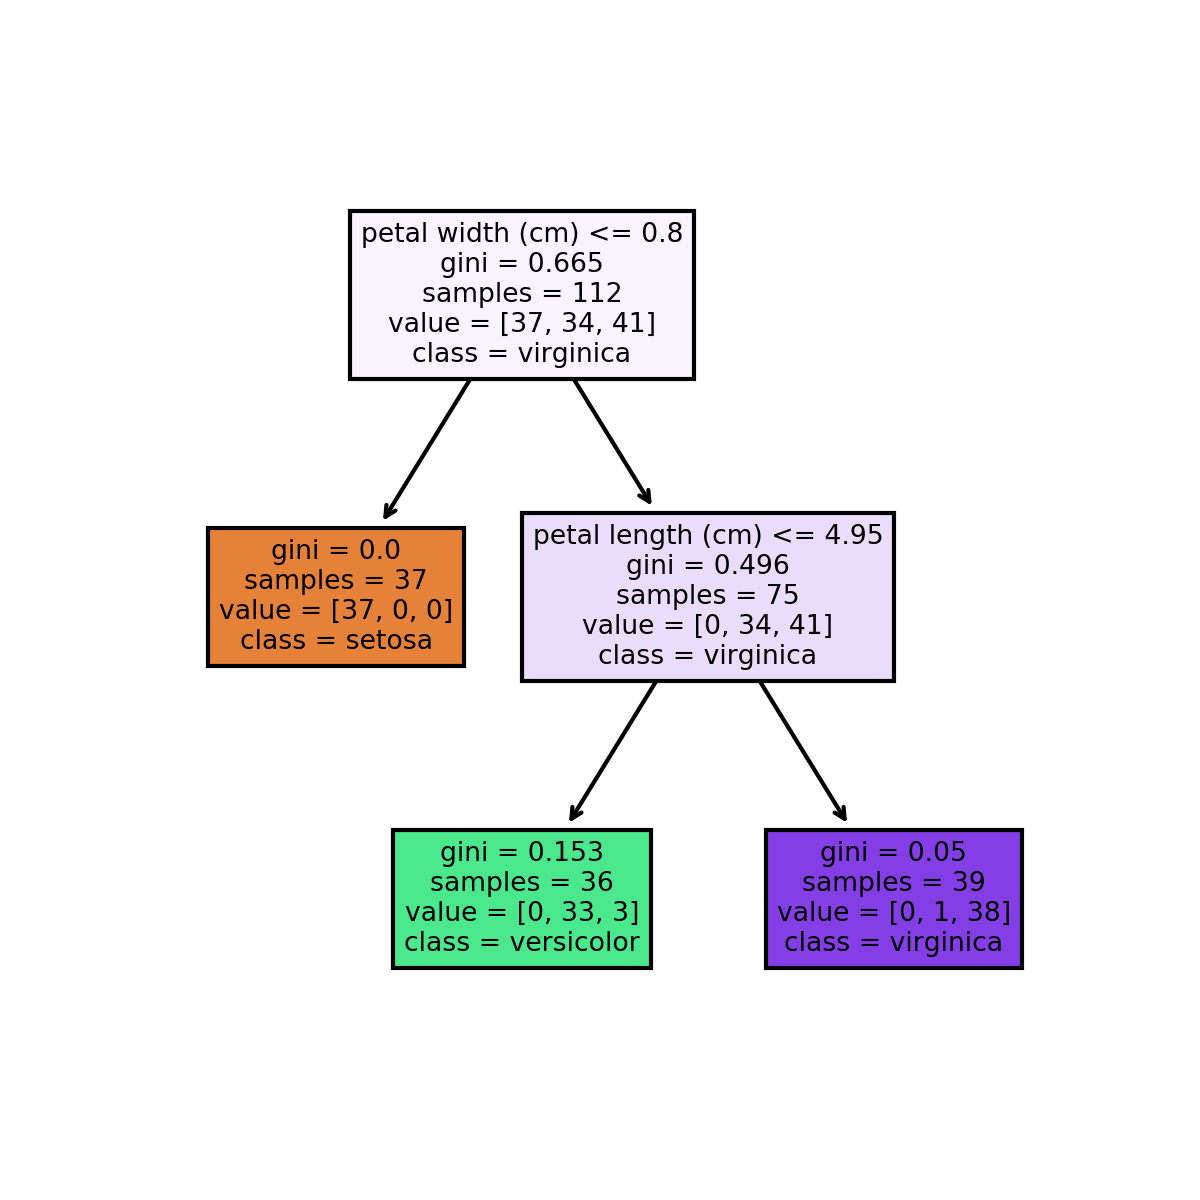
You can also add some extra Python code to make the decision tree drawn better
Interpretability, such as adding features and classification names:
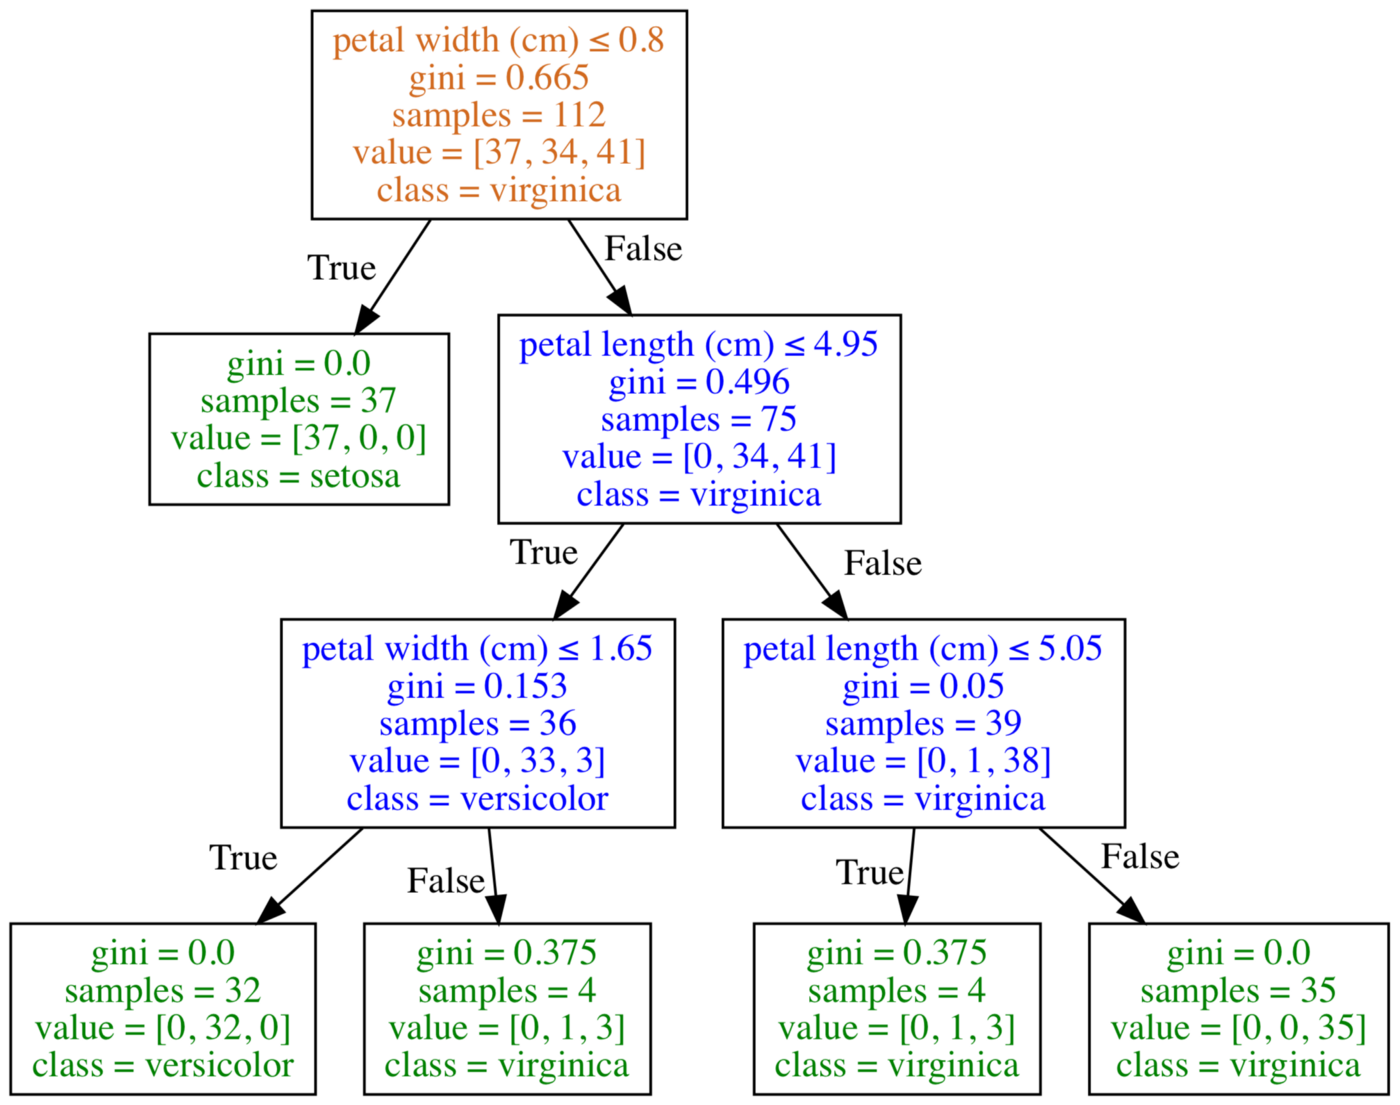
fn=['sepal length (cm)','sepal width (cm)','petal length (cm)','petal width (cm)']
cn=['setosa', 'versicolor', 'virginica']
fig, axes = plt.subplots(nrows = 1,ncols = 1,figsize = (4,4), dpi=300)
tree.plot_tree(clf,
               feature_names = fn,
               class_names=cn,
               filled = True);
fig.savefig('imagename.png')
The decision tree visualization results with more information are as follows:
3. Visualization of decision tree using Graphviz
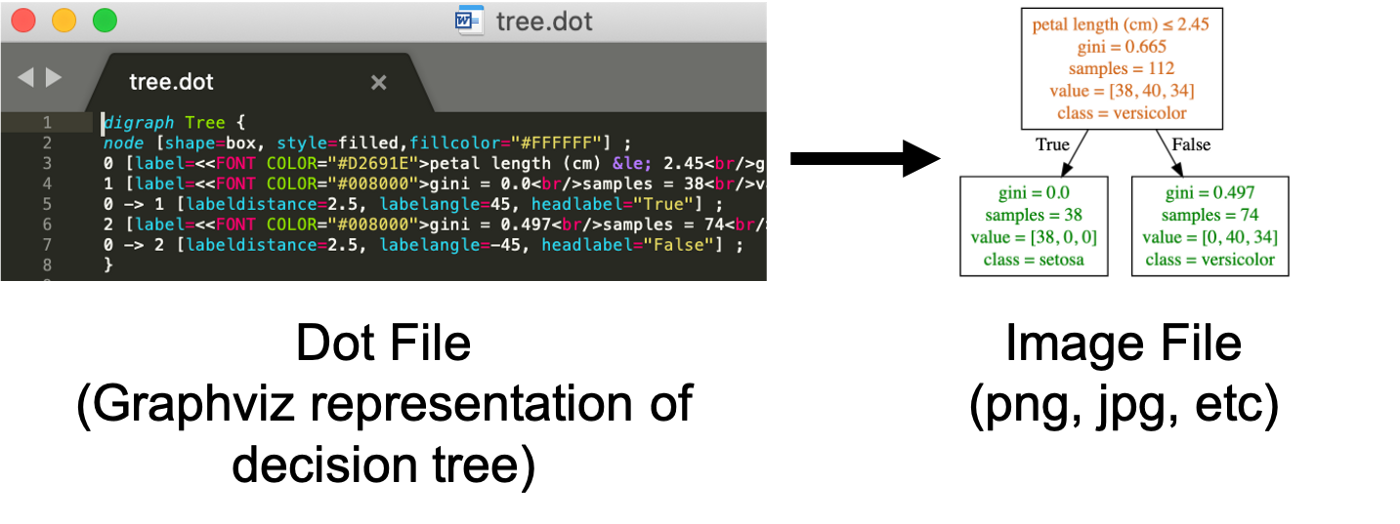
The following figure is a visualization of the decision tree using Graphviz:
Graphviz is an open source Graph visualization software, which uses abstract Graph and network to represent structured information. In the field of data science, one of the purposes of graphviz is to realize the visualization of decision tree. I put the graphviz method after the matplotlib method because the software is a bit complicated to use.
In order to visualize the decision tree, it is not difficult to create a dot file to describe the decision tree. The problem is that using Graphviz to convert a dot file to a graphics file, such as png, jpg, and so on, can be a bit difficult.
There are some ways to reduce the use threshold of graphviz, such as installing Python graphviz through Anaconda, installing grahpviz with homebrew of mac, using the official windows installation file, or using online converter to convert the dot file of decision tree into graphics:
First, we export the decision tree model as a dot file:
tree.export_graphviz(clf,
                     out_file="tree.dot",
                     feature_names = fn,
                     class_names=cn,
                     filled = True)
Then we use conda to install graphviz:
conda install python-graphviz
Now you can convert the dot file exported from the decision tree model to a graphic file:
dot -Tpng tree.dot -o tree.png
4. Visualization of decision tree package or single decision tree in random forest
One disadvantage of decision tree is that its prediction accuracy is usually not good enough. This is partly because of the large range of changes, and different ways of splitting training data may generate different decision tree models.
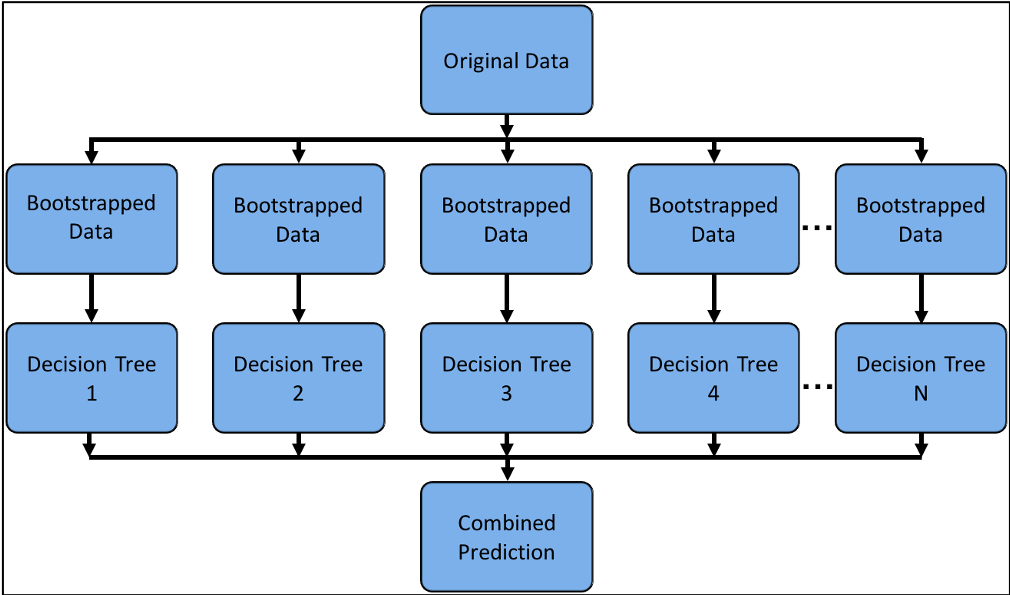
The above figure can represent the combination learning methods such as decision tree package or random forest model, which can achieve better prediction performance by combining multiple machine learning algorithms. In this section, we learn how to visualize a single decision tree in these composite models.
First, we use scikit learn to train a random forest model:
# Load the Breast Cancer (Diagnostic) Dataset
data = load_breast_cancer()
df = pd.DataFrame(data.data, columns=data.feature_names)
df['target'] = data.target
# Arrange Data into Features Matrix and Target Vector
X = df.loc[:, df.columns != 'target']
y = df.loc[:, 'target'].values
# Split the data into training and testing sets
X_train, X_test, Y_train, Y_test = train_test_split(X, y, random_state=0)
# Random Forests in `scikit-learn` (with N = 100)
rf = RandomForestClassifier(n_estimators=100,
                            random_state=0)
rf.fit(X_train, Y_train)
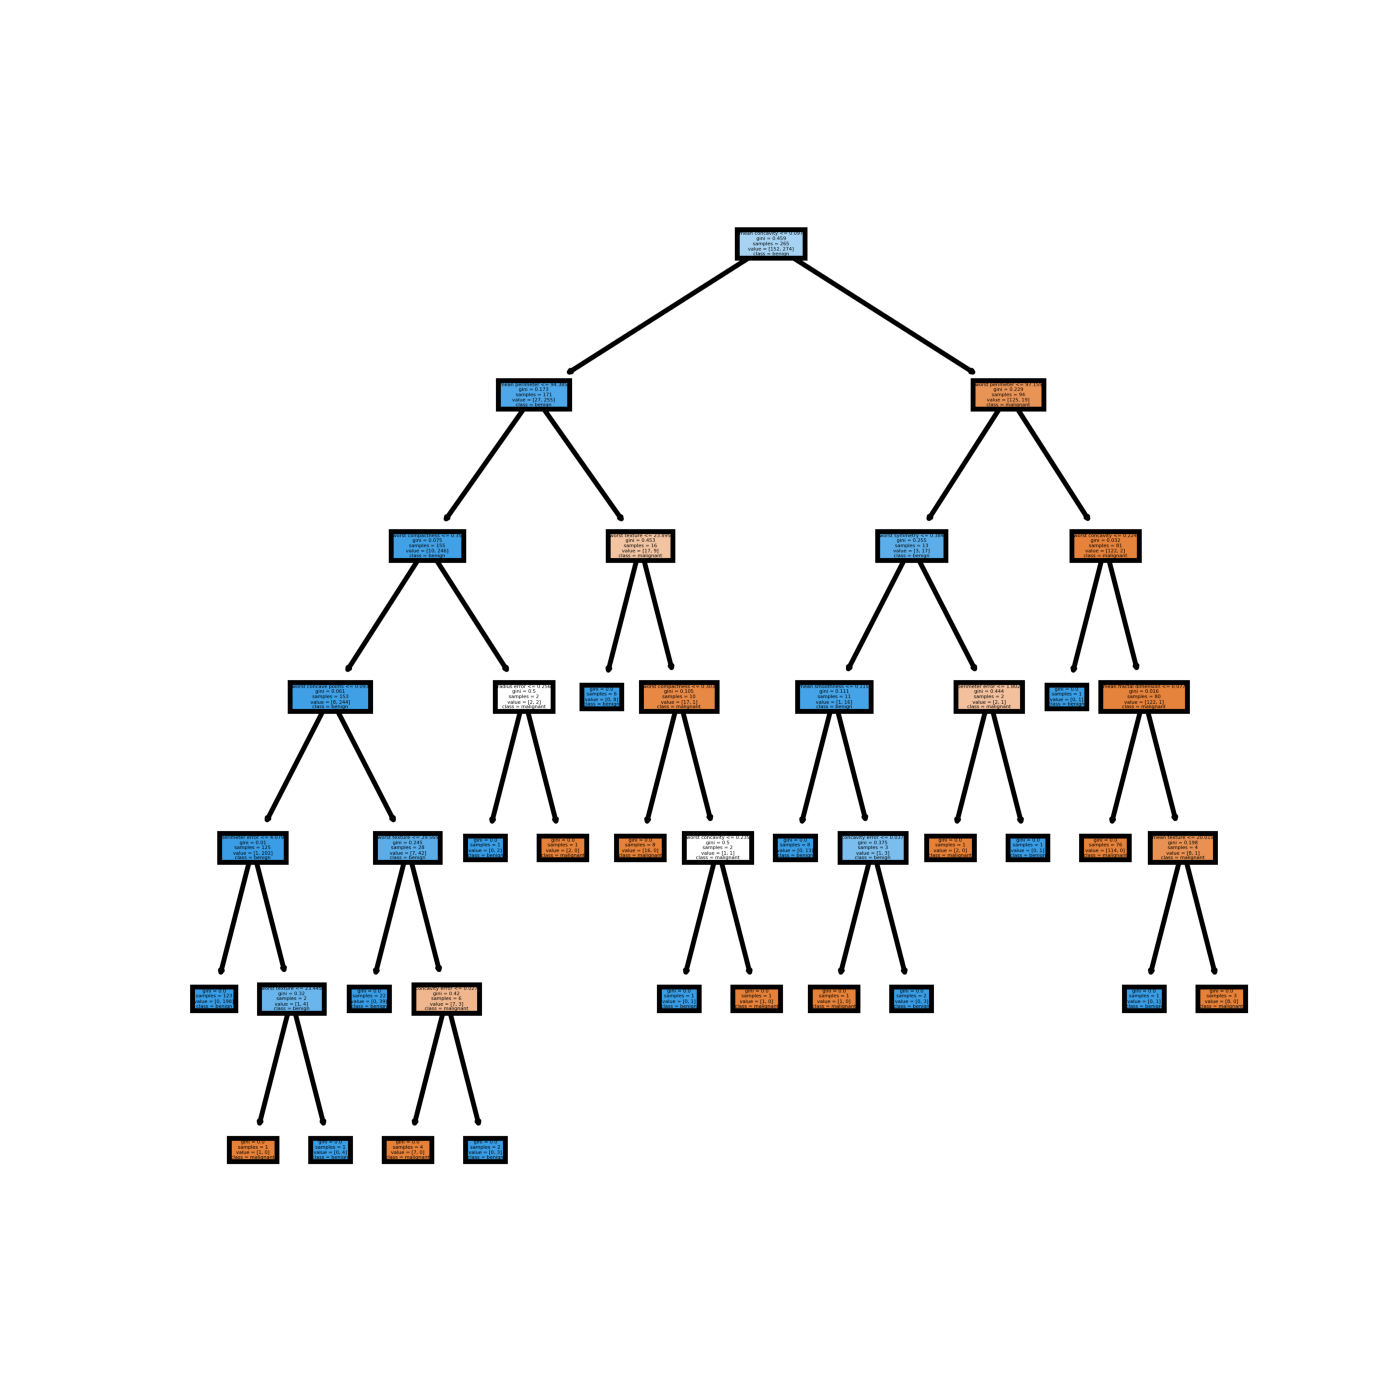
Now we can visualize a single decision tree in the model. First, use matplotlib. The following python code visualizes the first decision tree:
fn=data.feature_names
cn=data.target_names
fig, axes = plt.subplots(nrows = 1,ncols = 1,figsize = (4,4), dpi=800)
tree.plot_tree(rf.estimators_[0],
               feature_names = fn,
               class_names=cn,
               filled = True);
fig.savefig('rf_individualtree.png')
The visualization results of the decision tree are as follows:
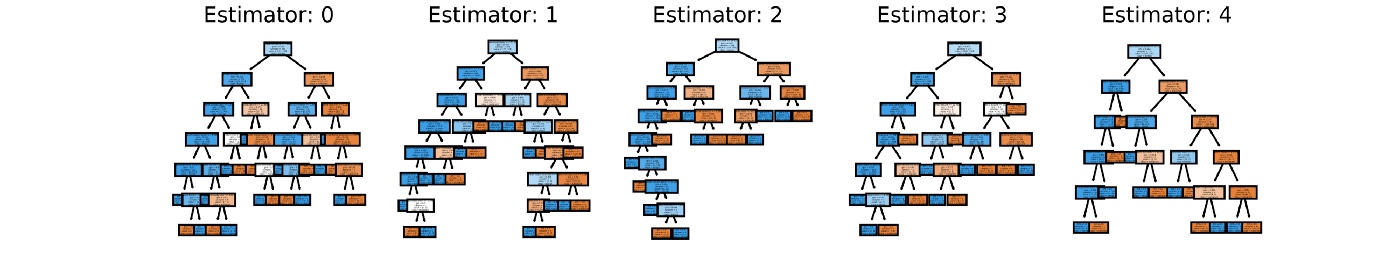
You can try to use subplot of matplotlib to visualize multiple decision trees you want. For example, the following Python code visualizes the first five decision trees in the composite model:
# This may not the best way to view each estimator as it is smallfn=data.feature_names
cn=data.target_names
fig, axes = plt.subplots(nrows = 1,ncols = 5,figsize = (10,2), dpi=3000)for index in range(0, 5):
    tree.plot_tree(rf.estimators_[index],
                   feature_names = fn,
                   class_names=cn,
                   filled = True,
                   ax = axes[index]);

    axes[index].set_title('Estimator: ' + str(index), fontsize = 11)fig.savefig('rf_5trees.png')
But I don't like it personally, because it seems too hard to see:
5. Summary of the course
In this tutorial, we learned how to use matplotlib and graphviz to visualize the decision tree obtained from scikit learn training, and also learned how to visualize one or more decision trees in the composite model, hoping this will help your data analysis work.
Original link: Decision tree visualization - Huizhi network