(I) background of the topic
Why choose this topic?
I'm interested in reading and understanding online novels
What is the expected goal of data analysis to be achieved? (10 points)
How is the ranking list constructed and the economic degree of the novel fans
Description in terms of society, economy, technology, data source, etc. (within 200 words)
During the epidemic period, most people began to publish a large number of articles on the Internet. From the 2020 network literature development report, we can know that the number of network novels has soared, which is a breakthrough change in the cultural field. A large number of cultural inputs not only solved the problem of work stoppage for some people, but also enriched people's recreational activities at home, While increasing the input of the new generation of writers, it also introduces the participation of many readers. Through the data of the novels of the starting point reading network reading group, we can see the analysis of the reward records of the main sources of the novel economy during the period.
(II) thematic web crawler design scheme
1. Data crawling and analysis of fans' reward ranking of starting reading novels
2. Content and data feature analysis of topic web crawler
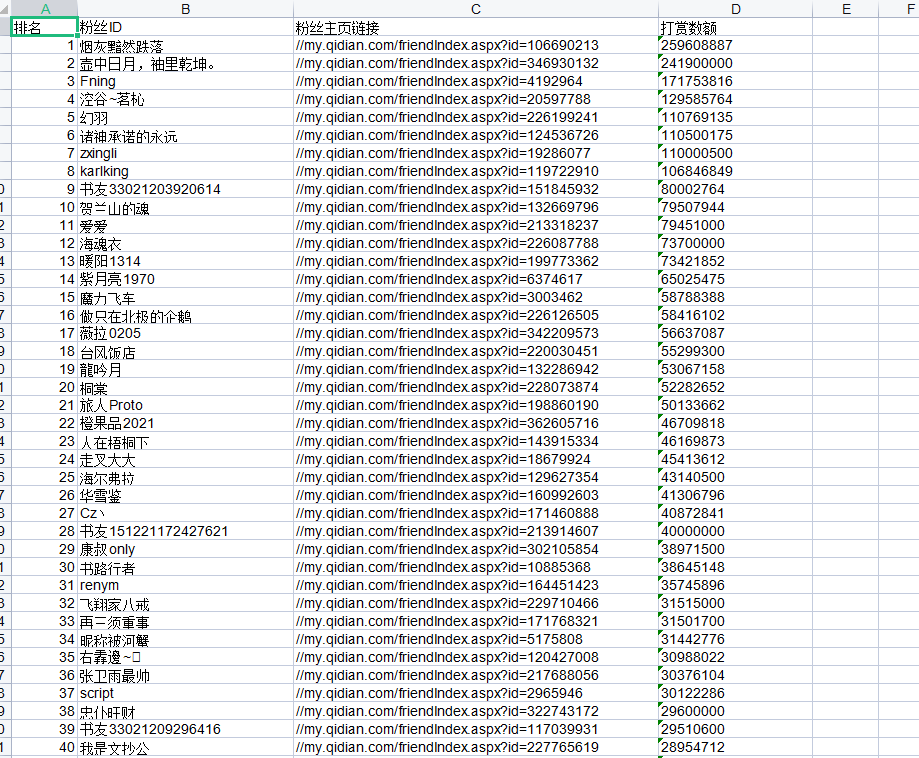
The data of fans' reward is obtained from the starting novel ranking list. From the data set of the top 100, it can be seen that there is a large gap in the reward of fans in the top 10. After the tenth place, it generally tends to a relatively stable state, which can reflect the extreme phenomenon of fans' reward.
3. Overview of thematic web crawler design scheme (including implementation ideas and technical difficulties)
Crawl the relevant content and data from the starting site, and analyze the program code and data, so as to obtain a considerable analysis of the fan reward list.
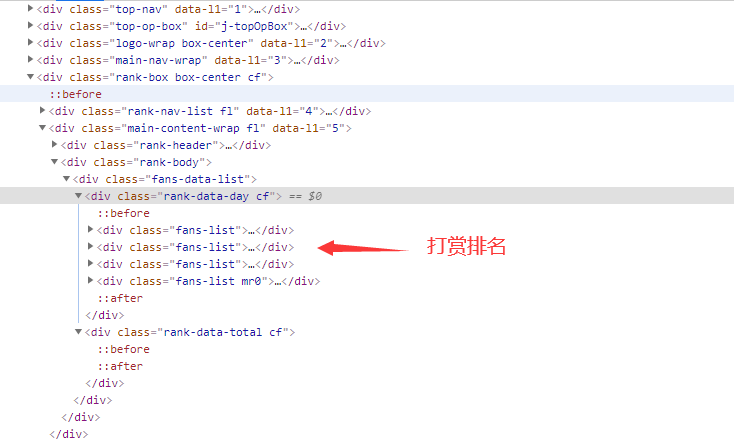
(III) analysis of structural features of theme pages (10 points)
1. Structure and feature analysis of theme page
2. HTML page parsing
3. Node (label) search method and traversal method

(4) . web crawler program design (60 points)
1. Data crawling and acquisition
#-*- coding = utf-8 -*-
from bs4 import BeautifulSoup
#Perform web page parsing

import re
#Text matching

import urllib.request,urllib.error
#formulate URL,Get web page data

import xlwt
#conduct excel operation

import sqlite3
#conduct SQLite Database operation

def main():
    askURL("https://www.qidian.com/rank/fans/datetype2/")

    datalist = getData(url)
    savepath = ".\\Su Hexiang.xls"
    saveData(datalist,savepath)

def getData(url):
    datalist = []

    html = askURL(url)
    soup = BeautifulSoup(html,"html.parser")
    i=1

    for item in soup.find_all('li'):
        data = []
        item = str(item)
#        print(item)


        findname = re.compile(r'target="_blank" title="(.*?)">')
        name = re.findall(findname, item)
        if name == []:
            continue
        else:
            pm = i
            i=i+1
            data.append(pm)
            name1=name[0]
            data.append(name1)
            findlink = re.compile(r'</em><a href="(.*?)" target=')
            link = re.findall(findlink, item)[0]
            data.append(link)
        findnum = re.compile(r'</a><i>(.*?)</i> </li>')
        num = re.findall(findnum, item)[0]
        data.append(num)
        datalist.append(data)

    return datalist

def saveData(datalist,savepath):

    book = xlwt.Workbook(encoding="utf-8",style_compression=0)
    #establish workbook object
    sheet = book.add_sheet('Su Hexiang',cell_overwrite_ok=True)

    #Create worksheet
    col = ("ranking","fans ID","Fan homepage link","Reward amount")

    for i in range(0,4):
        sheet.write(0,i,col[i]) #Listing

    for i in range(0,100):

        #test print("The first%d strip" %(i+1))

        data = datalist[i]
        for j in range(0,4):
            sheet.write(i+1,j,data[j])
            #data

    book.save(savepath)

    print('Exported table!')


def askURL(url):
    head = {
        "User-Agent": "Mozilla / 5.0 (Windows NT 10.0; Win64; x64) AppleWebKit/537.36(KHTML, like Gecko) Chrome / 96.0.4664.110 Safari / 537.36"
    }
    request = urllib.request.Request(url, headers=head)
    html = ""
    try:
        response = urllib.request.urlopen(request)
        html = response.read().decode("utf-8")
    except urllib.error.URLError as e:
        if hasattr(e, "code"):
            print(e.code)

        if hasattr(e, "reason"):
            print(e.reason)
    return html


url = "https://www.qidian.com/rank/fans/datetype2/"
main()
print("Climb over!")
Output results:
Output table:
(2) Data visualization
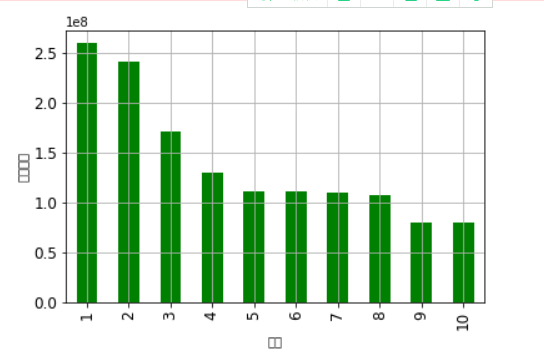
#Histogram
#histogram
import matplotlib.pyplot as plt
import pandas as pd
import numpy as np
qidian_df=pd.read_excel(r'C:\Users\1\Starting point fan list.xls')
data=np.array(qidian_df['Reward amount'][0:10])
#Indexes
index=np.arange(1,11)
#Used to display Chinese labels normally
plt.rcParams['font.sans-serif']=['Arial Unicode MS']
#modify x Axis font size is 12
plt.xticks(fontsize=12)
#modify y Axis font size is 12
plt.yticks(fontsize=12)
print(data)
print(index)
#x label
plt.xlabel('ranking')
#y label
plt.ylabel('Reward amount')
s = pd.Series(data, index)
s.plot(kind='bar',color='g')
plt.grid()
plt.show()
Output results:
#Scatter chart, line chart
#Scatter chart, line chart
qidian_df=pd.read_excel(r'C:\Users\1\Starting point fan list.xls')
plt.rcParams['font.sans-serif']=['Arial Unicode MS']
plt.rcParams['axes.unicode_minus']=False
plt.xticks(fontsize=12)
plt.yticks(fontsize=12)
#Scatter
plt.scatter(qidian_df.ranking, qidian_df.Reward amount,color='r')
#broken line
plt.plot(qidian_df.ranking, qidian_df.Reward amount,color='b')
#x label
plt.xlabel('ranking')
#y label
plt.ylabel('Reward amount')
plt.show()
Output results:

# regression equation
#Linear regression between ranking and reward amount
import seaborn as sns
sns.regplot(qidian_df.ranking,qidian_df.Reward amount)
plt.xlabel('ranking')#x label
plt.ylabel('Reward amount')#y label
Output results:
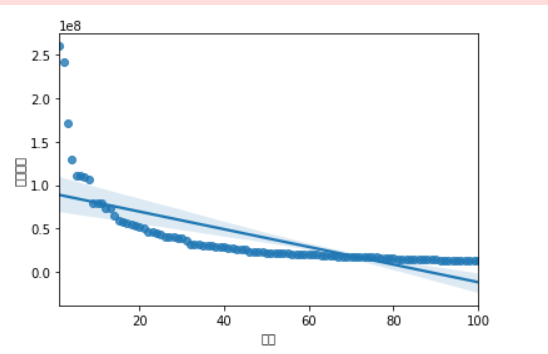
Correlation coefficient analysis:
The vertical axis is the reward amount and the horizontal axis is the ranking. From the regression equation, it can be seen that the gap between the top ten reward amounts will be larger, and the subsequent reward amount will gradually tend to a relatively stable value. From this figure, it can also be seen that the economy tends to a relatively stable state.
(3) Complete code
#-*- coding = utf-8 -*-
from bs4 import BeautifulSoup
#Perform web page parsing

import re
#Text matching

import urllib.request,urllib.error
#formulate URL,Get web page data

import xlwt
#conduct excel operation

import sqlite3
#conduct SQLite Database operation

def main():
    askURL("https://www.qidian.com/rank/fans/datetype2/")

    datalist = getData(url)
    savepath = ".\\Su Hexiang.xls"
    saveData(datalist,savepath)

def getData(url):
    datalist = []

    html = askURL(url)
    soup = BeautifulSoup(html,"html.parser")
    i=1

    for item in soup.find_all('li'):
        data = []
        item = str(item)
#        print(item)


        findname = re.compile(r'target="_blank" title="(.*?)">')
        name = re.findall(findname, item)
        if name == []:
            continue
        else:
            pm = i
            i=i+1
            data.append(pm)
            name1=name[0]
            data.append(name1)
            findlink = re.compile(r'</em><a href="(.*?)" target=')
            link = re.findall(findlink, item)[0]
            data.append(link)
        findnum = re.compile(r'</a><i>(.*?)</i> </li>')
        num = re.findall(findnum, item)[0]
        data.append(num)
        datalist.append(data)

    return datalist

def saveData(datalist,savepath):

    book = xlwt.Workbook(encoding="utf-8",style_compression=0)
    #establish workbook object
    sheet = book.add_sheet('Su Hexiang',cell_overwrite_ok=True)

    #Create worksheet
    col = ("ranking","fans ID","Fan homepage link","Reward amount")

    for i in range(0,4):
        sheet.write(0,i,col[i]) #Listing

    for i in range(0,100):

        #test print("The first%d strip" %(i+1))

        data = datalist[i]
        for j in range(0,4):
            sheet.write(i+1,j,data[j])
            #data

    book.save(savepath)

    print('Exported table!')


def askURL(url):
    head = {
        "User-Agent": "Mozilla / 5.0 (Windows NT 10.0; Win64; x64) AppleWebKit/537.36(KHTML, like Gecko) Chrome / 96.0.4664.110 Safari / 537.36"
    }
    request = urllib.request.Request(url, headers=head)
    html = ""
    try:
        response = urllib.request.urlopen(request)
        html = response.read().decode("utf-8")
    except urllib.error.URLError as e:
        if hasattr(e, "code"):
            print(e.code)

        if hasattr(e, "reason"):
            print(e.reason)
    return html


url = "https://www.qidian.com/rank/fans/datetype2/"
main()
print("Climb over!")
#histogram
import matplotlib.pyplot as plt

import pandas as pd

import numpy as np

qidian_df=pd.read_excel(r'C:\Users\1\Starting point fan list.xls')
data=np.array(qidian_df['Reward amount'][0:10])

#Indexes
index=np.arange(1,11)

#Used to display Chinese labels normally
plt.rcParams['font.sans-serif']=['Arial Unicode MS']

plt.xticks(fontsize=12)#modify x Axis font size is 12

plt.yticks(fontsize=12)#modify y Axis font size is 12
print(data)
print(index)

#x label
plt.xlabel('ranking')
#y label
plt.ylabel('Reward amount')

s = pd.Series(data, index)

s.plot(kind='bar',color='g')

plt.grid()

plt.show()


#Scatter chart, line chart
qidian_df=pd.read_excel(r'C:\Users\1\Starting point fan list.xls')

plt.rcParams['font.sans-serif']=['Arial Unicode MS']

plt.rcParams['axes.unicode_minus']=False

plt.xticks(fontsize=12)

plt.yticks(fontsize=12)

plt.scatter(qidian_df.ranking, qidian_df.Reward amount,color='r')#Scatter

plt.plot(qidian_df.ranking, qidian_df.Reward amount,color='b')#broken line

plt.xlabel('ranking')#x label

plt.ylabel('Reward amount')#y label

plt.show()


#Linear regression between ranking and reward amount
import seaborn as sns

sns.regplot(qidian_df.ranking,qidian_df.Reward amount)

plt.xlabel('ranking')#x label

plt.ylabel('Reward amount')#y label
(V) summary (10 points)
1. What conclusions can be drawn from the analysis and visualization of subject data? Is the expected goal achieved?
After analyzing and visualizing the theme data, we can get the data of fans' reward from the starting novel ranking list. From the data set of the top 100, we can see that there is a large gap between the top 10 fans, and generally tends to a relatively stable state after the tenth, which can reflect the extreme phenomenon of fans' reward, Although I wanted to climb the relationship between the author and the monthly ticket list at first, because the real-time update of the monthly ticket is too uncertain, my strength is too limited, so I can't climb to get the relevant data. For the data climbing of the fan reward list, I can also see some desired purposes.
2. What are the gains in the process of completing this design? And suggestions for improvement?
After completing this course design, I have a deeper understanding of reptiles, a closer understanding of the economic sources of novel writing from fans, and a deeper understanding of Python.