1. numpy Foundation
(1). numpy create array (matrix)
import numpy as np
a=np.array([1,2,3,4,5])
b=np.array(range(1,6))
c=np.arange(1,6)
Usage of np.orange: Orange ([start,] stop [, step,], dtype = none)
#Class name of array
a=np.array([1,2,3,4,5])
print(type(a))
Operation results:
numpy.ndarray

#Type of array
print(a.dtype)
Operation results:
dtype('int64')

#Specifies the data type of the created array
a=np.array([1,0,1,0],dtype=np.bool)  #Or use dtype = '?'
print(a)
Operation results:
array[True,False,True,False]

#Modify the data type of the array
print(a.astype('i1')) #Or use a.astype(np.int8)
Operation results:
[1,0,1,0],dtype=int8

#Modify decimal places of floating point type
b=np.array([random.random() for i in range(10)])  #Generate 10 decimals from 0 to 1
print(b)
print(np.round(b,2))  #Keep two decimal places for numbers in
 Operation results:
[0.07859284 0.63999421 0.87230539 0.20005099 0.99937676 0.04664788
 0.11377768 0.05528047 0.88686356 0.7185658 ]
[0.08 0.64 0.87 0.2  1.   0.05 0.11 0.06 0.89 0.72]
0.012

#Array shape
a=np.array([[3,4,5,6,7,8],[4,5,6,7,8,9]])
print(a)
Operation results:
[[3 4 5 6 7 8]
 [4 5 6 7 8 9]]

#View the shape of an array
print(a.shape)
Operation results:
(2,6)    #The first number is the number of rows and the second number is the number of columns
#If there are three numbers, the first number is how many matrices there are

#Modify the shape of the array
print(a.reshape(3,4))
Operation results;
[[3 4 5 6]
 [7 8 4 5]
 [6 7 8 9]]

#Array shape
a=np.array([[3,4,5,6,7,8],[4,5,6,7,8,9]])
a.flatten()  #Directly change multi-dimensional array into one-dimensional array
 Operation results:
[3 4 5 6 7 8 4 5 6 7 8 9]

#add , subtract , multiply and divide
print(a+1)
print(a-1)
print(a*2)
print(a/2)
Operation results:
[[2 3 4 5 6 7]
 [3 4 5 6 7 8]]
[[ 6  8 10 12 14 16]
 [ 8 10 12 14 16 18]]
[[1.5 2.  2.5 3.  3.5 4. ]
 [2.  2.5 3.  3.5 4.  4.5]]

Addition, subtraction, multiplication and division between arrays
a=np.array([[3,4,5,6,7,8],[4,5,6,7,8,9]])
b=np.array([[21,22,23,24,25,26],[27,28,29,30,31,32]])
c=np.array(range(18))
c=c.reshape(3,6)
print(c)
d=np.array(range(2))
d=d.reshape(2,1)
print(a+b)
print(a*b)
print(a+c)  #An error will be reported because no dimension is the same
print(a+d)
print(a*d)  #As long as one dimension is the same, it can be added or subtracted

Operation results:
[[24 26 28 30 32 34]
 [31 33 35 37 39 41]]
[[ 63  88 115 144 175 208]
 [108 140 174 210 248 288]]

[[ 3  4  5  6  7  8]
 [ 5  6  7  8  9 10]]
[[0 0 0 0 0 0]
 [4 5 6 7 8 9]]
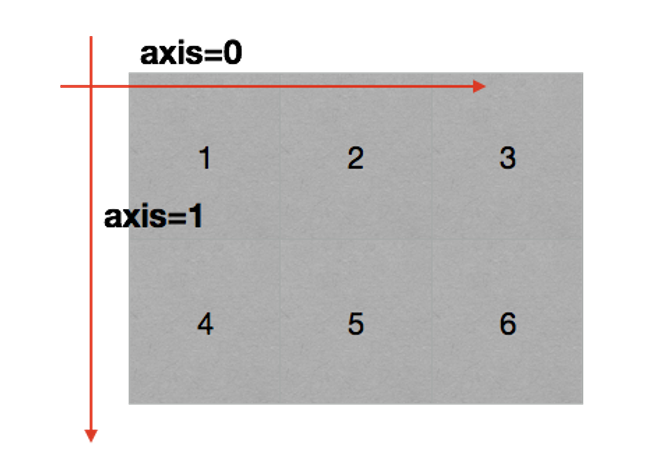
(2) . axis
- Axis of two-dimensional array
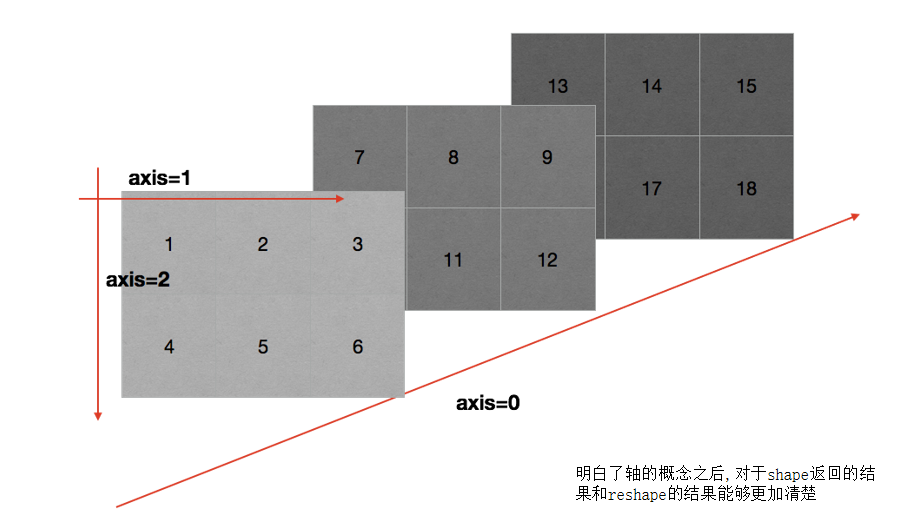
- Axis of 3D array
(3) . numpy (read data)
np.loadtxt(frame,dtype=np.float,delimiter=None,skiprows=0,usecols=None,unpack=False)
| parameter | explain |
|---|---|
| frame | File, string, or producer, which can be a. gz or ba2 compressed file |
| dtpye | Data type: optional. What data type is used to read the CSV string into the array? The default is np.float |
| delimiter | Separate strings. The default is any space. Change to comma |
| skiprows | Skip the first X line, generally skip the header of the first line |
| usecols | Reads the specified column, index, tuple type |
| unpack | If True, the read in attribute will be written to different array variables respectively. If False, only one array variable will be written to the read in data. The default is False |
(4). numpy reads and stores data
- problem
Now there is a csv with more than 1000 videos of YouTube in the UK and the US, like, dislike and comments (["views", "likes", "dislikes", "comment_total"). What we just learned is that we try to operate it
(5) Transpose in. Numpy
- Transpose is a kind of transformation. For arrays in numpy, it is to exchange data in the diagonal direction, and the purpose is to process data more conveniently
Three methods of transposition
import numpy as np
t=np.array(range(24))
t=t.reshape(4,6)

print(t.T)
print(t.transpose())
print(t.swapaxes)

Operation results:
[[ 0  6 12 18]
 [ 1  7 13 19]
 [ 2  8 14 20]
 [ 3  9 15 21]
 [ 4 10 16 22]
 [ 5 11 17 23]]
(6). numpy index and slice
import numpy as np
t=np.array(range(24))
t=t.reshape(4,6)
print(t)
print(t[1])  #Take one line
print(t[1:3])  #Take multiple rows
print(t[:,2])  #Take a column
print(t[:,2:4])  #Take multiple columns

Operation results:
[[ 0  1  2  3  4  5]
 [ 6  7  8  9 10 11]
 [12 13 14 15 16 17]
 [18 19 20 21 22 23]]
[ 6  7  8  9 10 11]
[[ 6  7  8  9 10 11]
 [12 13 14 15 16 17]]
[ 2  8 14 20]
[[ 2  3]
 [ 8  9]
 [14 15]
 [20 21]]
(7) Modification of values in. Numpy
import numpy as np
t=np.array(range(24))
t=t.reshape(4,6)
t[:,2:4]=0
print(t)

Operation results:
[[ 0  1  0  0  4  5]
 [ 6  7  0  0 10 11]
 [12 13  0  0 16 17]
 [18 19  0  0 22 23]]
(8) Boolean index in. Numpy
import numpy as np
t=np.array(range(24))
t=t.reshape(4,6)
print(t)
print(t<10)
t[t<10]=0   #Assign less than 10 to 0
print(t)

Operation results:
[[ 0  1  2  3  4  5]
 [ 6  7  8  9 10 11]
 [12 13 14 15 16 17]
 [18 19 20 21 22 23]]
[[ True  True  True  True  True  True]
 [ True  True  True  True False False]
 [False False False False False False]
 [False False False False False False]]
 [[ 0  0  0  0  0  0]
 [ 0  0  0  0 10 11]
 [12 13 14 15 16 17]
 [18 19 20 21 22 23]]
(9) Ternary operator in. Numpy
import numpy as np
t=np.arange(24).reshape(4,6)
print(t)
t=np.where(t<10,0,10)
#In the np.where matrix, those less than 10 become 0 and those greater than 10 become 10
print(t)

Operation results:
[[ 0  1  2  3  4  5]
 [ 6  7  8  9 10 11]
 [12 13 14 15 16 17]
 [18 19 20 21 22 23]]
[[ 0  0  0  0  0  0]
 [ 0  0  0  0 10 10]
 [10 10 10 10 10 10]
 [10 10 10 10 10 10]]
(10) Clip in. Numpy
import numpy as np
t=np.arange(24).reshape(4,6)
print(t)
t=t.astype(float)
t[3,3:6]=np.nan  #Change the fourth column to the sixth column in the fourth row into nan, and pay attention to the character format
print(t.clip(10,18))  #Those less than 10 are replaced by 10, and those greater than 18 are replaced by 18

Operation results:
[[ 0  1  2  3  4  5]
 [ 6  7  8  9 10 11]
 [12 13 14 15 16 17]
 [18 19 20 21 22 23]]
[[10. 10. 10. 10. 10. 10.]
 [10. 10. 10. 10. 10. 11.]
 [12. 13. 14. 15. 16. 17.]
 [18. 18. 18. nan nan nan]]
(11) nan and inf in. Numpy
- nan(NAN,Nan):not a number means not a number
- When will nan appear in numpy:
When we read that the local file is float, nan will appear if it is missing
As an inappropriate calculation (such as infinity minus infinity) - inf(-inf,inf):infinity,inf means positive infinity, - inf means negative infinity
- When does inf appear, including (- inf, + INF)
For example, a number divided by 0 (an error will be reported directly in python, and an inf or - inf in numpy)
Note for nan in numpy:
- Two nan are not equal
IN:np.nan==np.nan
OUT:False
IN:np.nan!=np.nan
OUT:True - Using the above t matrix, the number of nan in the array is determined
IN:np.count_nonzero(t != t)
out:3 - Use np.isnan(t) to judge whether the number is nan and return the bool value type. For example, you want to replace nan with 0
IN:t[np.isnan(t)]=0
OUT:print(t) - nan and any value calculation result is nan
- So the question is, is it appropriate to simply replace nan with 0 in a set of data? What kind of impact will it bring?
For example, after all are replaced with 0, if the average value before replacement is greater than 0, the average value after replacement will certainly become smaller. Therefore, a more general way is to replace the missing value with the mean (median) or directly delete the line with missing value
Outcome method
#coding=utf-8
import numpy as np
def fill_ndarray(t1):
    for i in range(t1.shape[1]):   #shape0 is the number of rows and shape1 is the number of columns
        temp_col=t1[:,i]   #Does the current column have nan
        nan_num = np.count_nonzero(temp_col!=temp_col)   #count_ How many nonzero numbers are not 0
        if nan_num !=0: #Not 0 indicates that nan exists in the current column
            temp_not_nan_col=temp_col[temp_col==temp_col]   #The array of nan in the current column will be assigned if it is equal to
            temp_col[np.isnan(temp_col)] = temp_not_nan_col.mean() #Select the position that is currently nan and assign the value to the mean value that is not nan
    return t1

if __name__=='__main__':
    t1=np.arange(24).reshape(4,6).astype('float')
    t1[3,3:6]=np.nan
    print(t1)
    t1=fill_ndarry(t1)
    print(t1)

Operation results:
[[ 0.  1.  2.  3.  4.  5.]
 [ 6.  7.  8.  9. 10. 11.]
 [12. 13. 14. 15. 16. 17.]
 [18. 19. 20. nan nan nan]]
[[ 0.  1.  2.  3.  4.  5.]
 [ 6.  7.  8.  9. 10. 11.]
 [12. 13. 14. 15. 16. 17.]
 [18. 19. 20.  9. 10. 11.]]
(12) . common statistical functions in numpy
Summation: t.sum(axis=None)
Mean: t.mean(a,axis=None) is greatly affected by outliers
Median: np.median(t,axis=None)
Maximum: t.max(axis=None)
Minimum value: t.min(axis=None)
Extreme value: np.ptp(t,axis=None), i.e. there is only difference between the maximum value and the minimum value
Standard deviation: t.std(axis=None) (standard deviation is a measure of the dispersion of the average value of a group of data. A large standard deviation means that there is a large difference between most values and their average value; a small standard deviation means that these values are closer to the average value, reflecting the fluctuation stability of the data. The larger the standard deviation means that the fluctuation is greater, which is about unstable.)
By default, it returns all the statistical results of the multidimensional array. If axis is specified, it returns a result on the current axis
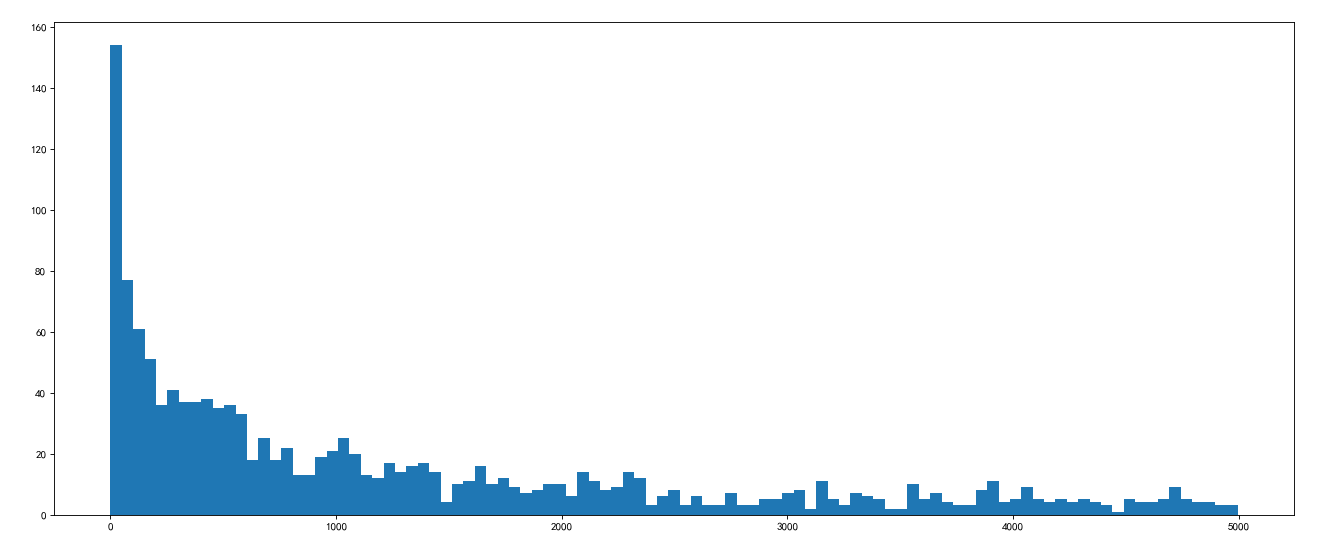
(13) 1. Problem solving
#coding=utf-8
'''
1.Britain and the United States each youtube1000 Combined with previous data matplotlib Draw a histogram of the number of comments
'''
import numpy as np
from matplotlib import pyplot as plt
us_file_path='./youtube_video/US_video_data_numbers.csv'
uk_file_path='./youtube_video/GB_video_data_numbers.csv'

# t1=np.loadtxt(us_file_path,delimiter=',',dtype='int',unpack=True)
t_us=np.loadtxt(us_file_path,delimiter=',',dtype='int')

#Get comment data
t_us_comments=t_us[:,-1]  #-1 is the last column


#Select data smaller than 5000
t_us_comments=t_us_comments[t_us_comments<=5000]
print(t_us_comments.max(),t_us_comments.min())

d=50
bin_nums=(t_us_comments.max()-t_us_comments.min())//d

#Draw histogram
plt.figure(figsize=(20,8),dpi=80)
plt.hist(t_us_comments,bin_nums)

plt.show()
Operation results:
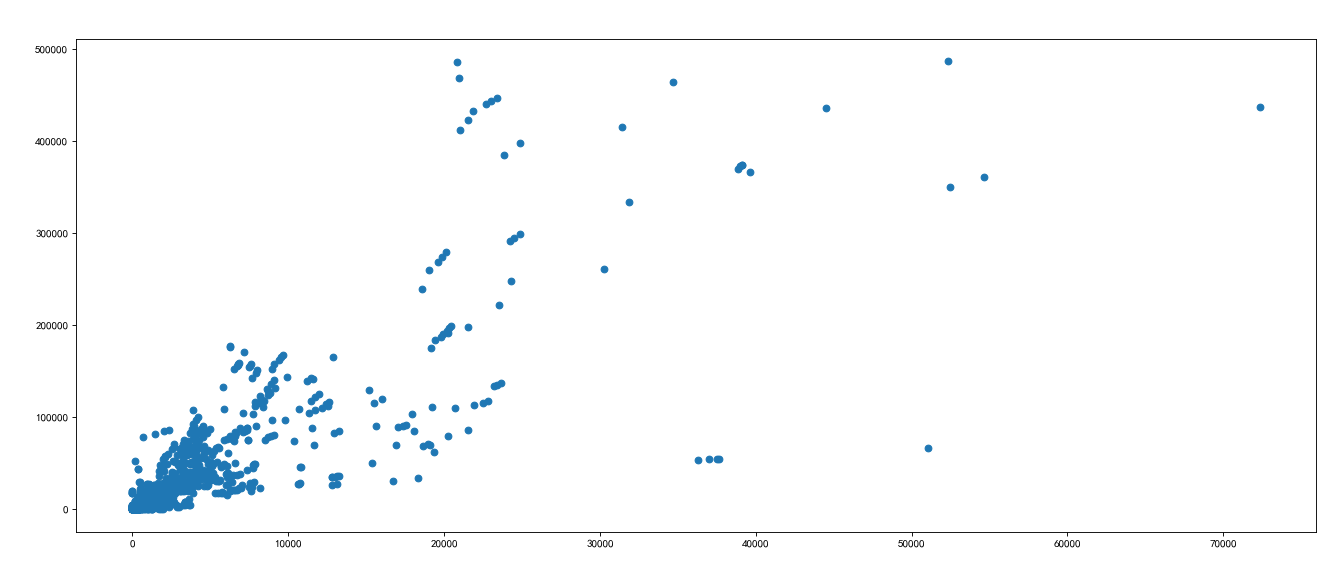
#coding=utf-8
'''
2.Hope to know about the UK youtube How to draw the relationship between the number of comments and the number of likes in the video
'''
import numpy as np
from matplotlib import pyplot as plt
us_file_path='./youtube_video/US_video_data_numbers.csv'
uk_file_path='./youtube_video/GB_video_data_numbers.csv'

t_uk=np.loadtxt(uk_file_path,delimiter=',',dtype='int')
t_uk=t_uk[t_uk[:,1]<=500000]

t_uk_comment = t_uk[:,-1]  #Number of comments
t_uk_like = t_uk[:,1]  #Like counting


plt.figure(figsize=(20,8),dpi=80)
plt.scatter(t_uk_comment,t_uk_like)   #Scatter diagram

plt.show()
Operation results:
(14) . splicing of arrays
- Vertical splicing
np.vstack((t1,t2)) - Horizontal splicing
np.hstack((t1,t2))
Splitting is the opposite direction of splicing. Don't confuse it
practice:
#coding=utf-8
'''
Now I want to study and analyze the data methods of the two countries in the previous case together, while retaining the national information (the national source of each data). What should I do
'''
import numpy as np
us_data='./youtube_video/US_video_data_numbers.csv'
uk_data='./youtube_video/GB_video_data_numbers.csv'
# Load country data
us_data=np.loadtxt(us_data,delimiter=',',dtype='int')
uk_data=np.loadtxt(uk_data,delimiter=',',dtype='int')

#Add country information
#Construct data np.zeros ((row, column)) with all 0
zeros_data=np.zeros((us_data.shape[0],1)).astype('int')
#Construct data np.ones ((row, column)) with all 1
ones_data=np.ones((uk_data.shape[0],1)).astype('int')

#Add a column of data with all 0 and 1 respectively
us_data=np.hstack((us_data, zeros_data))
uk_data=np.hstack((uk_data, ones_data))

#Splice two pieces of data
fin_data=np.vstack((us_data, uk_data))
print(fin_data)

Operation results:
[[4394029  320053    5931   46245       0]
 [7860119  185853   26679       0       0]
 [5845909  576597   39774  170708       0]
 ...
 [ 109222    4840      35     212       1]
 [ 626223   22962     532    1559       1]
 [  99228    1699      23     135       1]]
(15). numpy more easy-to-use methods
- Gets the location of the maximum and minimum values
np.argmax(t,axis=0)
np.argmin(t,axis=1) - Create an array of all zeros: np.zeros((3,4))
- Create an array of all 1: np.ones((3,4))
- Create a square array (square array) with diagonal 1: np.eye(3)
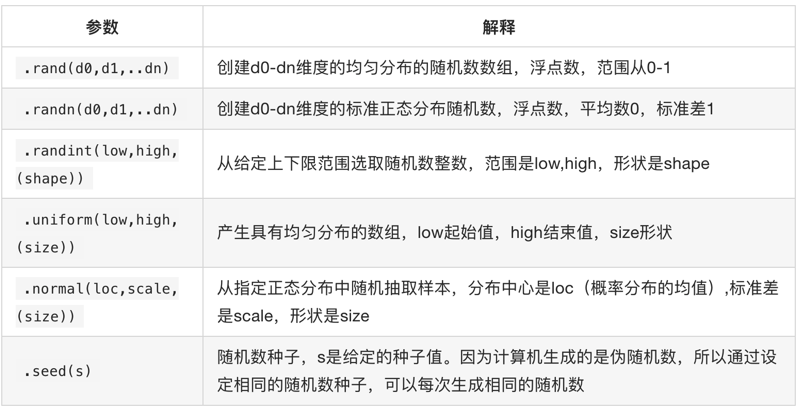
(16). numpy generates random numbers
(17). numpy's notes copy and view
- a=b does not replicate at all, and a and b affect each other
- a = b [:], the operation of the view, a kind of slice, will create a new object a, but the data of a is completely kept by b, and their data changes are consistent,
- a = b.copy(), copy, a and b do not affect each other