1, TensorBoard introduction and installation
TensorBoard is a visualization tool. In the training process, we need to visualize the training process to monitor the training status of our current training. TensorBoard is a powerful visualization tool in TensorFlow, but PyTorch has supported the use of TensorBoard, supporting scalar, image, text, audio, video, Eembedding and other data visualization.
1. Operation mechanism of tensorboard
- Record visual data in python script
- Store the data in the hard disk in the form of event file
- TensorBoard tool is used to read the formal data of event file at the terminal, and TensorBoard tool is used for visualization at the Web end

The web address is the visualized web address
2. TensorBoard installation
directly enter pip install tensorboard in conda to install
2, Use of TensorBoard
1.SummaryWriter
class SummaryWriter(object):
	def __init__(self, log_dir=None, comment='',
		purge_step=None, max_queue=10,
		flush_secs=120, filename_suffix=''):
		...
Function: provides a high-level interface for creating event file s
Main attributes:
- log_dir: event file output folder
- comment: do not specify log_dir, folder suffix
- filename_suffix: event file file name suffix
The use of these three parameters is shown below
import os
import numpy as np
import matplotlib.pyplot as plt
from torch.utils.tensorboard import SummaryWriter
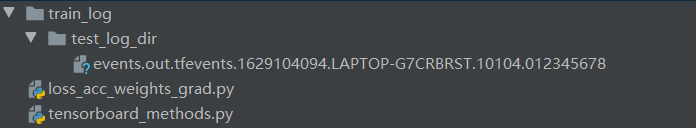
log_dir = "./train_log/test_log_dir"
writer = SummaryWriter(log_dir=log_dir, comment='_scalars', filename_suffix="12345678")
for x in range(100):
writer.add_scalar('y=pow_2_x', 2 ** x, x)
writer.close()
import os
import numpy as np
import matplotlib.pyplot as plt
from torch.utils.tensorboard import SummaryWriter
log_dir = "./train_log/test_log_dir"
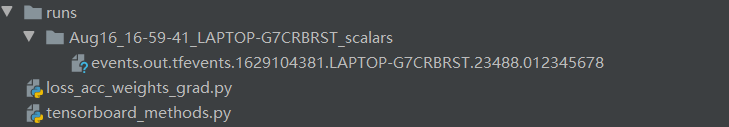
writer = SummaryWriter(comment='_scalars', filename_suffix="12345678")
for x in range(100):
writer.add_scalar('y=pow_2_x', 2 ** x, x)
writer.close()
Main methods:
-
add_scalar
add_scalar(tag, scalar_value, global_step=None, walltime=None)
Function: record scalar. The disadvantage is that only one curve can be recorded
- Tag: tag name, unique identification
- scalar_value: scalar to record
- global_step: x axis
-
add_scalars()
add_scalars(main_tag, tag_scalar_dict, global_step=None, walltime=None)
- main_tag: Label
- tag_scalar_dict: key is the tag of the variable, and value is the value of the variable
The above two methods are used as follows:
import os
import numpy as np
import matplotlib.pyplot as plt
from torch.utils.tensorboard import SummaryWriter
max_epoch = 100
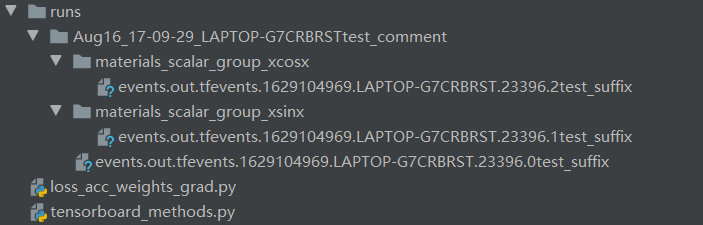
writer = SummaryWriter(comment='test_comment', filename_suffix="test_suffix")
for x in range(max_epoch):
writer.add_scalar('y=2x', x * 2, x)
writer.add_scalar('y=pow_2_x', 2 ** x, x)
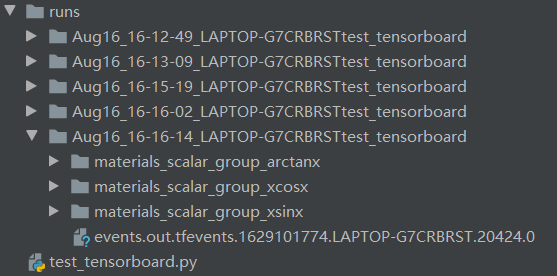
writer.add_scalars('materials/scalar_group', {"xsinx": x * np.sin(x),
"xcosx": x * np.cos(x)}, x)
writer.close()
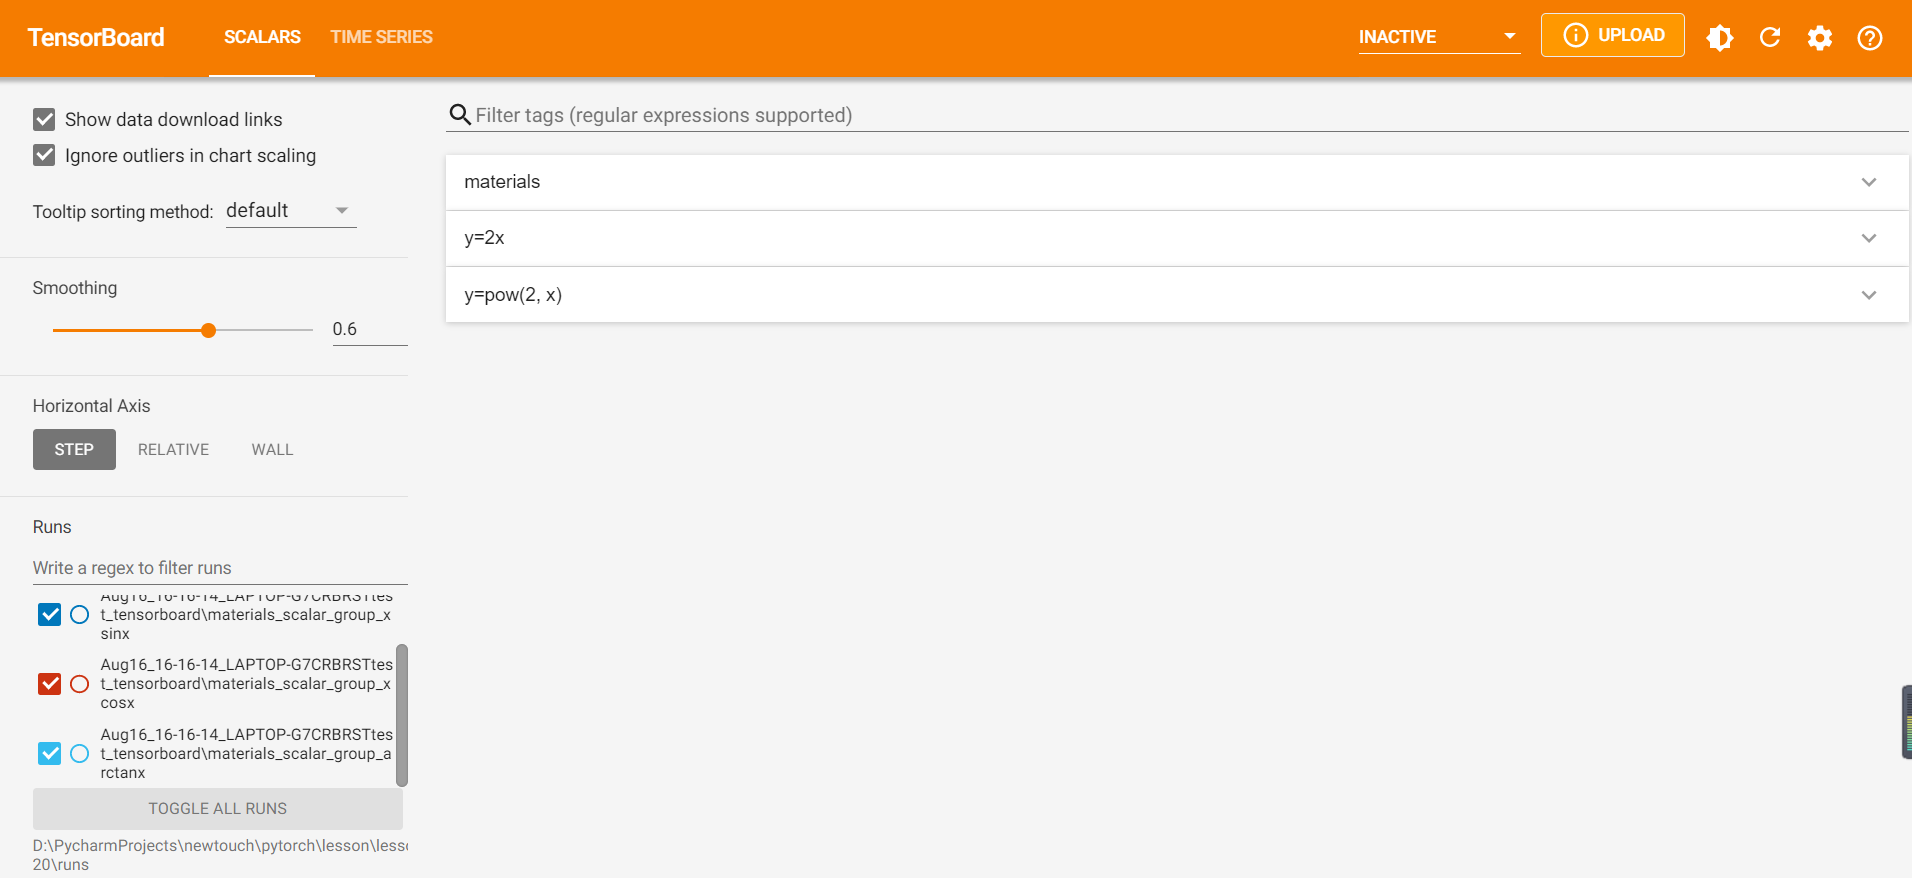
The generated event files are:
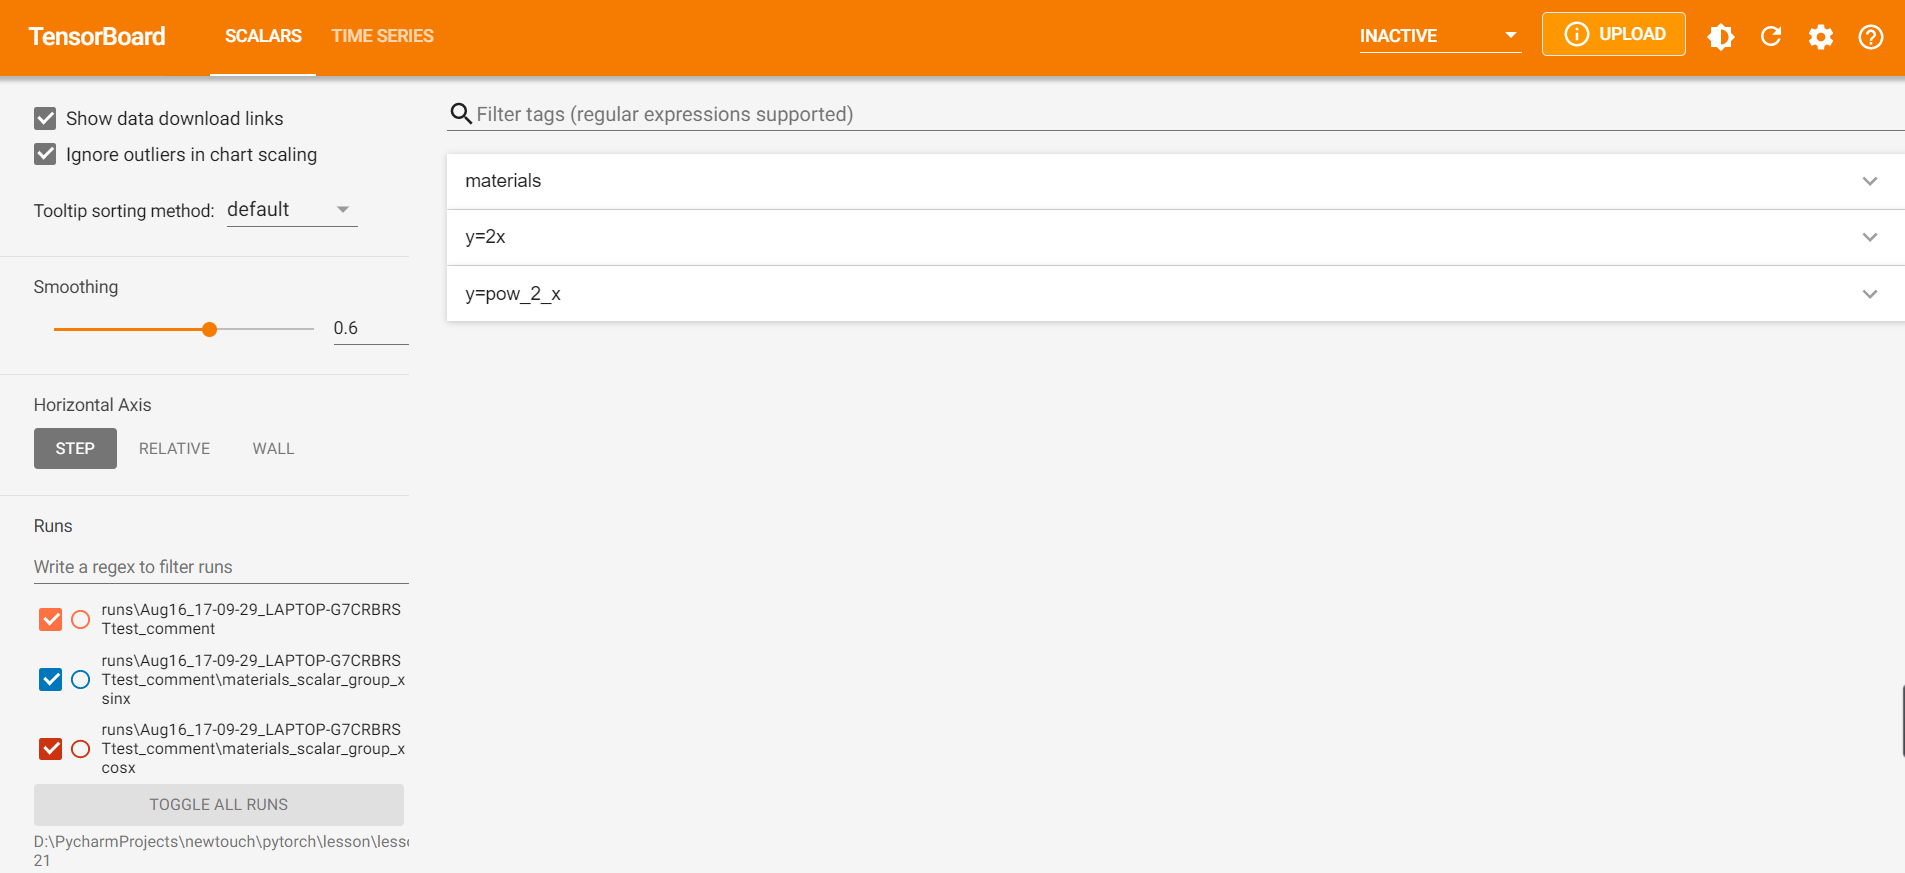
At this time, it can be obtained after terminal visualization

Click this URL and the default browser will be used to open the visual interface
-
add_histogram()
add_histogram(tag, values, global_step=None, bins='tensorflow', walltime=None)
Function: statistical histogram and multi quantile line chart are very useful for analyzing model parameter distribution and gradient distribution
- Tag: tag name, unique identification
- values: parameters to be counted
- global_step: y axis
- Bins: bins of histogram
import os
import numpy as np
import matplotlib.pyplot as plt
from torch.utils.tensorboard import SummaryWriter
writer = SummaryWriter(comment='test_comment', filename_suffix="test_suffix")
for x in range(2):
np.random.seed(x)
# Isochronous distribution
data_union = np.arange(100)
# Normal distribution
data_normal = np.random.normal(size=1000)
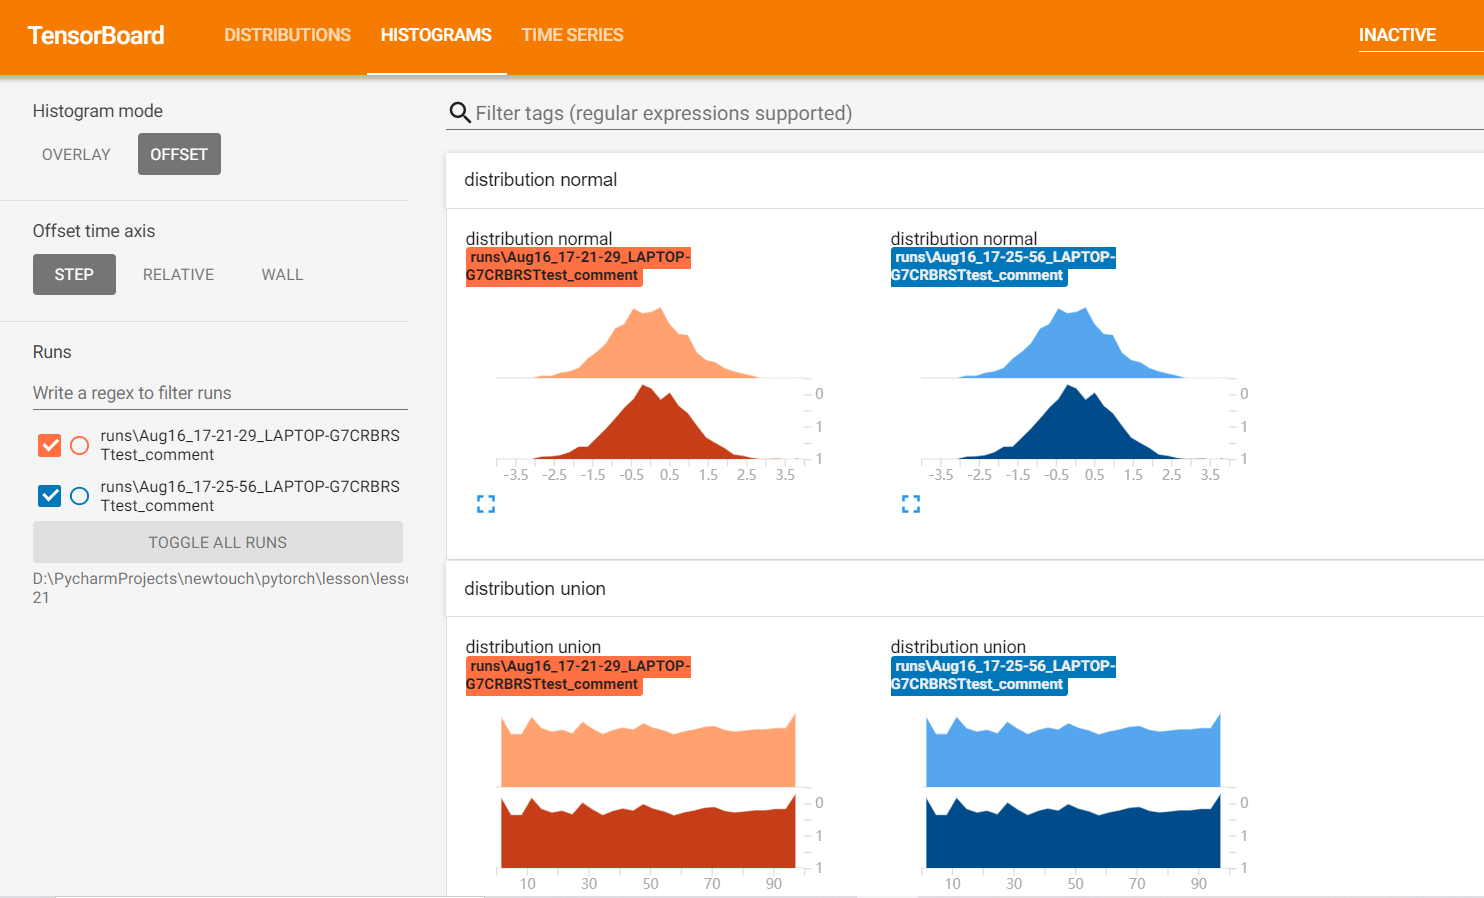
writer.add_histogram('distribution union', data_union, x)
writer.add_histogram('distribution normal', data_normal, x)
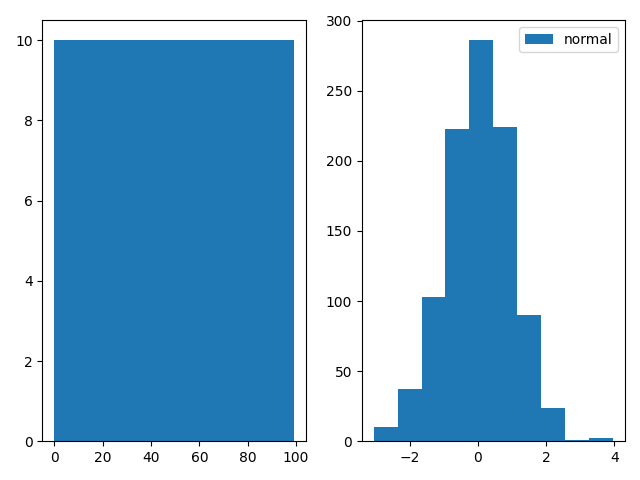
plt.subplot(121).hist(data_union, label="union")
plt.subplot(122).hist(data_normal, label="normal")
plt.legend()
plt.show()
writer.close()
The following information is displayed on the wed side of the tensorboard:
If it is helpful to you, please praise and pay attention, which is really important to me!!! If you need to communicate with each other, please comment or send a private letter!