0: project requirements
There is a new demand for the recent project. It is necessary to draw the corresponding chart according to the seismic data. There is little information about this chart. I turned to many websites, but I didn't find much useful data. There is only one paper on Qt However, after searching so many materials, I didn't get nothing. At least I knew the name of this kind of map As shown in the title, it is hereinafter uniformly referred to as seismic profile
1: Graphic analysis:
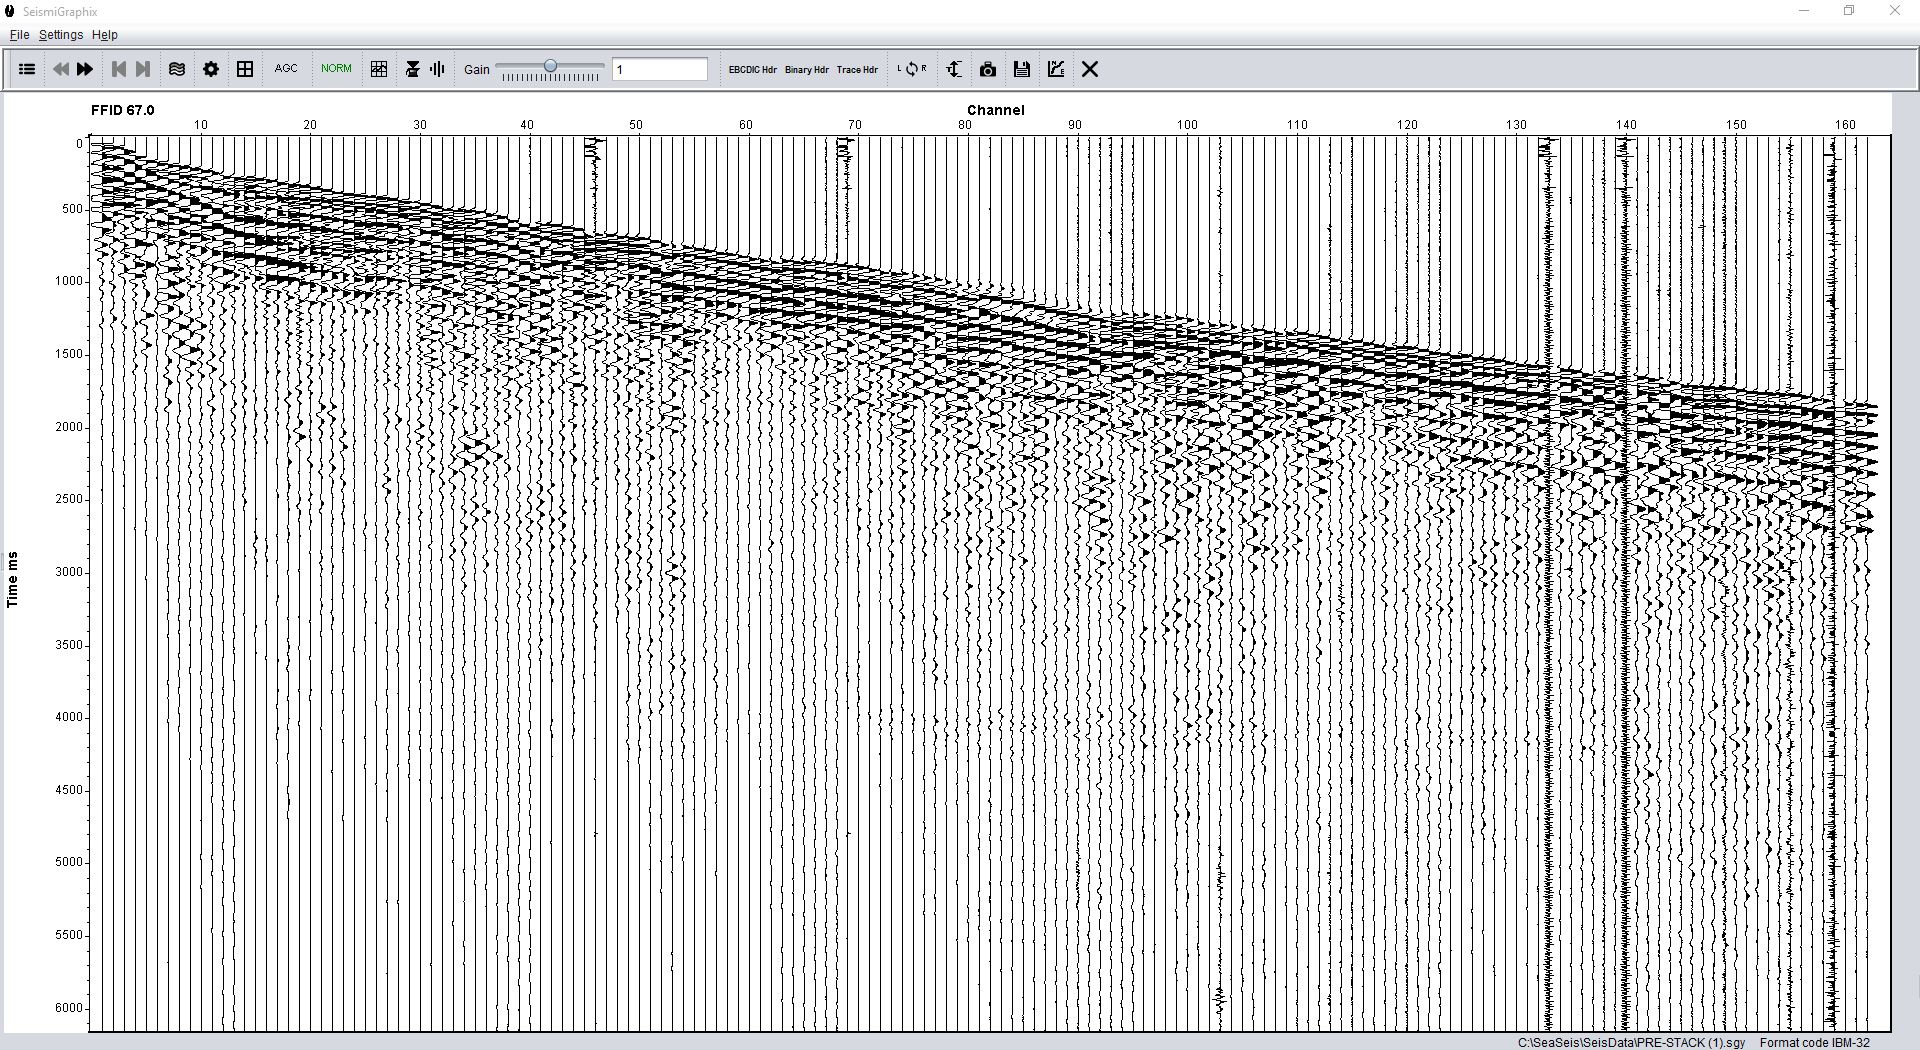
The above figure is a picture of a seismic profile found when I checked the data. It can be seen that the horizontal axis represents the channel and the vertical axis represents the time. The broken line in the chart represents the intensity and direction of the vibration (this may not be accurate). If the vibration exceeds a certain value, the wave crest will be dyed black, and the wave trough will not be processed
2: Qt effect display
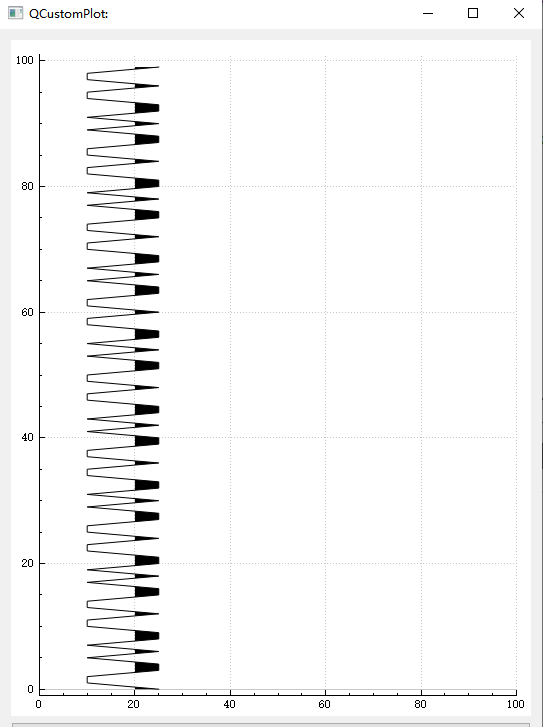
Before continuing the analysis, let's take a look at the effect achieved by Qt
3: Graph decomposition
As shown in the first figure, the broken lines and coordinate axes in the figure can be realized by QCustomPlot As for wave dyeing, if the Brush brush is set when QCustomPlot is used, it actually comes with its own dyeing, but the effect may be different from our needs
The following is a simple line diagram, and then add the brush screenshot. You can see that the part pointed by the arrow is the dyeing effect we need But there is still some gap between this and our needs
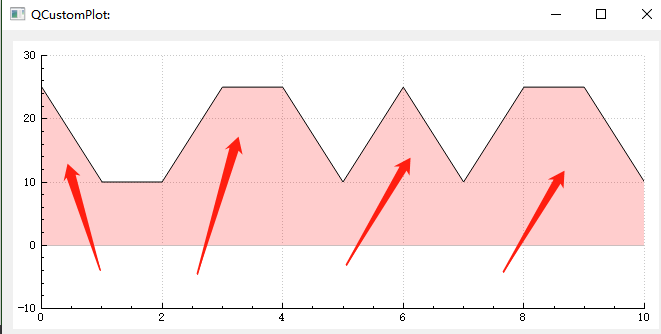
There are two main points
1) The coloring here is based on 0, and the color value is filled in the broken line diagram from 0 to the waveform, which can not control the effect of "filling after the amplitude exceeds a certain value. Moreover, there are many curves in the seismic profile, which can not start from 0, so it is necessary to add offset display"
2) The figure is horizontal, and the seismic profile is generally vertical, so this point also needs to be adjusted
4: Try the existing solution first
In QCustomPlot, the QGraph class has a setChannelFillGraph function, which can fill the part between the two layers and test the bottom
1) First create 2 layers and set the data
    QVector<double> x, y, y2;
    for(int i=0; i<11; i++)
    {
        x.push_back(i);

        if(i%3 == 0 || i%4 == 0 || i%8 == 0)
        {
            y.push_back(25);
        }
        else
        {
            y.push_back(10);
        }

        y2.push_back(20);

    }

    //Set interactive properties, drag and zoom
    customPlot->setInteractions(QCP::iRangeDrag | QCP::iRangeZoom);

    //Add layers and set brush and brush colors
    customPlot->addGraph();
    customPlot->graph(0)->setPen(QPen(Qt::black));
    customPlot->graph(0)->setBrush(QColor(255, 0, 0, 50));

    //Set data in
    customPlot->graph(0)->setData(x, y);


    //Add layer 2 and set brush and brush colors
    customPlot->addGraph();
    customPlot->graph(1)->setPen(QPen(Qt::red));
    customPlot->graph(1)->setBrush(QColor(0, 0, 255, 50));

    //Set data in
    customPlot->graph(1)->setData(x, y2);

    //Fill between layers
    customPlot->graph(0)->setChannelFillGraph(customPlot->graph(1));

    //Set axis range
    customPlot->xAxis->setRange(0, 10);
    customPlot->yAxis->setRange(-10, 30);

    //Repaint
    customPlot->replot();
Run up and the result is this
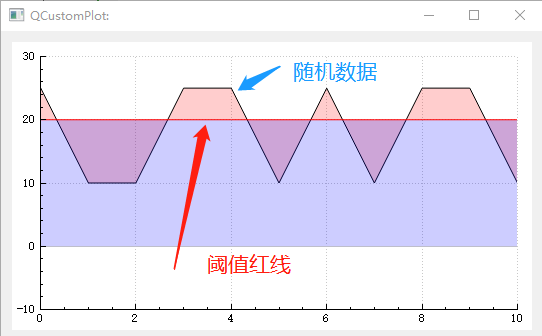
As shown in the figure, compared with directly setting the default brush, the filling between layers can indeed take a line as the boundary and then take the line as the center for filling (perhaps this is no different from directly setting the brush, but if the brush with the red line is transparent or the code for setting the brush of layer 1 is commented out directly, the difference can be seen)
// customPlot->graph(1)->setBrush(QColor(0, 0, 255, 50));
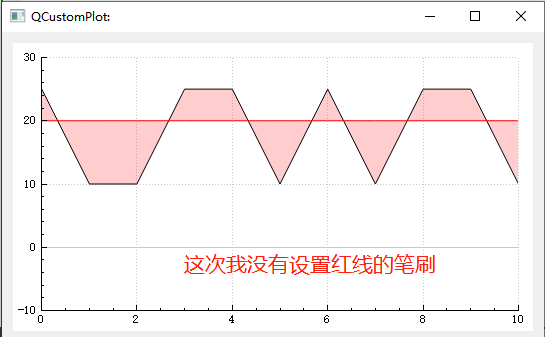
So, the question is whether to follow this idea, remove the filling under the red line and fill only the part above the red line You're done?
I don't think so. Using this method to display a curve requires two layers, and the amount of data needs to be doubled If only one line is displayed, it is easy to say that a large number of lines will inevitably lead to jamming
5: source code analysis
The existing code can not meet the requirements, so we can only redevelop QCustomPlot The first step to solve this problem is to find the painting logic of the filled part of the brush
Go to qcustomplot CPP source code, find the draw function of QCPGraph
void QCPGraph::draw(QCPPainter *painter)
{
if (!mKeyAxis || !mValueAxis) { qDebug() << Q_FUNC_INFO << "invalid key or value axis"; return; }
if (mKeyAxis.data()->range().size() <= 0 || mDataContainer->isEmpty()) return;
if (mLineStyle == lsNone && mScatterStyle.isNone()) return;
QVector<QPointF> lines, scatters; // line and (if necessary) scatter pixel coordinates will be stored here while iterating over segments
// loop over and draw segments of unselected/selected data:
QList<QCPDataRange> selectedSegments, unselectedSegments, allSegments;
getDataSegments(selectedSegments, unselectedSegments);
allSegments << unselectedSegments << selectedSegments;
for (int i=0; i<allSegments.size(); ++i)
{
bool isSelectedSegment = i >= unselectedSegments.size();
// get line pixel points appropriate to line style:
QCPDataRange lineDataRange = isSelectedSegment ? allSegments.at(i) : allSegments.at(i).adjusted(-1, 1); // unselected segments extend lines to bordering selected data point (safe to exceed total data bounds in first/last segment, getLines takes care)
getLines(&lines, lineDataRange);
// check data validity if flag set:
#ifdef QCUSTOMPLOT_CHECK_DATA
QCPGraphDataContainer::const_iterator it;
for (it = mDataContainer->constBegin(); it != mDataContainer->constEnd(); ++it)
{
if (QCP::isInvalidData(it->key, it->value))
qDebug() << Q_FUNC_INFO << "Data point at" << it->key << "invalid." << "Plottable name:" << name();
}
#endif
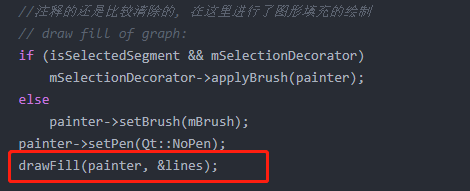
//The annotation is still relatively cleared, and the graphic filling is drawn here
// draw fill of graph:
if (isSelectedSegment && mSelectionDecorator)
mSelectionDecorator->applyBrush(painter);
else
painter->setBrush(mBrush);
painter->setPen(Qt::NoPen);
drawFill(painter, &lines);
// draw line:
if (mLineStyle != lsNone)
{
if (isSelectedSegment && mSelectionDecorator)
mSelectionDecorator->applyPen(painter);
else
painter->setPen(mPen);
painter->setBrush(Qt::NoBrush);
if (mLineStyle == lsImpulse)
drawImpulsePlot(painter, lines);
else
drawLinePlot(painter, lines); // also step plots can be drawn as a line plot
}
// draw scatters:
QCPScatterStyle finalScatterStyle = mScatterStyle;
if (isSelectedSegment && mSelectionDecorator)
finalScatterStyle = mSelectionDecorator->getFinalScatterStyle(mScatterStyle);
if (!finalScatterStyle.isNone())
{
getScatters(&scatters, allSegments.at(i));
drawScatterPlot(painter, scatters, finalScatterStyle);
}
}
// draw other selection decoration that isn't just line/scatter pens and brushes:
if (mSelectionDecorator)
mSelectionDecorator->drawDecoration(painter, selection());
}The code segment above is the content of the draw function of QCPGraph. As shown in the comment, the filled place is drawn in the drawFill function
So let's take a look at the drawFill function
void QCPGraph::drawFill(QCPPainter *painter, QVector<QPointF> *lines) const
{
if (mLineStyle == lsImpulse) return; // fill doesn't make sense for impulse plot
if (painter->brush().style() == Qt::NoBrush || painter->brush().color().alpha() == 0) return;
applyFillAntialiasingHint(painter);
const QVector<QCPDataRange> segments = getNonNanSegments(lines, keyAxis()->orientation());
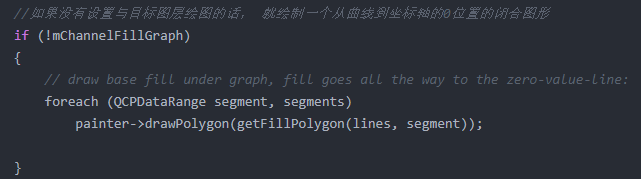
//If the drawing with the target layer is not set, a closed drawing from the curve to the 0 position of the coordinate axis is drawn
if (!mChannelFillGraph)
{
// draw base fill under graph, fill goes all the way to the zero-value-line:
foreach (QCPDataRange segment, segments)
painter->drawPolygon(getFillPolygon(lines, segment));
}
else //If the target layer fill is set, a closed drawing is drawn from the current layer to the target layer fill
{
// draw fill between this graph and mChannelFillGraph:
QVector<QPointF> otherLines;
mChannelFillGraph->getLines(&otherLines, QCPDataRange(0, mChannelFillGraph->dataCount()));
if (!otherLines.isEmpty())
{
QVector<QCPDataRange> otherSegments = getNonNanSegments(&otherLines, mChannelFillGraph->keyAxis()->orientation());
QVector<QPair<QCPDataRange, QCPDataRange> > segmentPairs = getOverlappingSegments(segments, lines, otherSegments, &otherLines);
for (int i=0; i<segmentPairs.size(); ++i)
painter->drawPolygon(getChannelFillPolygon(lines, segmentPairs.at(i).first, &otherLines, segmentPairs.at(i).second));
}
}
}I annotated the code snippet above
Where does the mChannelFillGraph variable come from? Let's have a look
void QCPGraph::setChannelFillGraph(QCPGraph *targetGraph)
{
    // prevent setting channel target to this graph itself:
    if (targetGraph == this)
    {
        qDebug() << Q_FUNC_INFO << "targetGraph is this graph itself";
        mChannelFillGraph = nullptr;
        return;
    }
    // prevent setting channel target to a graph not in the plot:
    if (targetGraph && targetGraph->mParentPlot != mParentPlot)
    {
        qDebug() << Q_FUNC_INFO << "targetGraph not in same plot";
        mChannelFillGraph = nullptr;
        return;
    }

    /*
        Yes, in our previous test, we called the setChannelFillGraph function for inter layer filling, and this function
        The value of the mChannelFillGraph is eventually modified
    */
    mChannelFillGraph = targetGraph;
}
As shown in the figure, if we call the setting function of inter layer filling, drawFill function, we will enter the else option. Otherwise, we will draw the filling from the curve to the coordinate axis 0 line. Painter - > drawpolygon(), which is the function of drawing polygon of QPainter object. Let's skip here for the time being. We need to pay attention to getFillPolygon, which can be seen from the name, This function returns a polygon range to be filled
So let's go to the getFillPolygon function and have a look
//This function returns a shape on which to draw
const QPolygonF QCPGraph::getFillPolygon(const QVector<QPointF> *lineData, QCPDataRange segment) const
{
    if (segment.size() < 2)
        return QPolygonF();
      QPolygonF result(segment.size()+2);
      result[0] = getFillBasePoint(lineData->at(segment.begin()));
      std::copy(lineData->constBegin()+segment.begin(), lineData->constBegin()+segment.end(), result.begin()+1);
      result.push_back(getFillBasePoint(lineData->at(segment.end()-1)));
      result[result.size()-1] = getFillBasePoint(lineData->at(segment.end()-1));
      return result;
}
The getFillPolygon function obtains the baseline coordinates through the vertex list of the line graph passed in, combined with the getFillBasePoint function (the baseline coordinates refer to the two coordinates obtained when the X axis is the horizontal coordinate axis, the Y axis is 0, the leftmost X axis and the rightmost X axis) This explains why graphics are always filled to 0
So the place where we need to move is here. With the vertex coordinate list of the polyline graph, we can realize the filling polygon we want according to our own needs
In order to verify our conjecture, let's test it and directly return a fixed shape to see if it will be drawn
Note that you need to mask the code filled between the previously set layers
// customPlot->graph(0)->setChannelFillGraph(customPlot->graph(1));
Modify the getFillPolygon function as follows
//This function returns a shape on which to draw
const QPolygonF QCPGraph::getFillPolygon(const QVector<QPointF> *lineData, QCPDataRange segment) const
{
    //        if (segment.size() < 2)
//            return QPolygonF();
//        QPolygonF result(segment.size()+2);
//        result[0] = getFillBasePoint(lineData->at(segment.begin()));


//        std::copy(lineData->constBegin()+segment.begin(), lineData->constBegin()+segment.end(), result.begin()+1);


//        result.push_back(getFillBasePoint(lineData->at(segment.end()-1)));
//        result[result.size()-1] = getFillBasePoint(lineData->at(segment.end()-1));
//        return result;

        //Here we return directly to a triangle
        QPolygonF result;
        result.append(QPointF(150, 50));
        result.append(QPointF(50, 150));
        result.append(QPointF(250, 150));
        return result;


}
Then compile and run, and the results are as follows
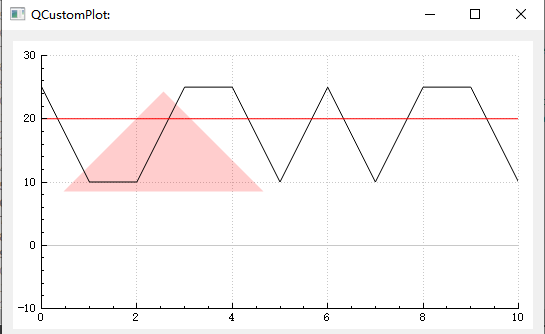
It can be seen that, as we expected, a triangle was indeed drawn
------------------------Eat first and write later-------------------------