1. Streamlit
In a word, Streamlit is a library that can write web app s in python, which can easily and dynamically display your machine learning projects.
advantage
-
You don't need to understand html, css, js, etc. to write web app s in pure python language
-
Including common web components: text box, button, radio box, check box, drop-down box, multimedia (picture, video) and file upload
Application scenario
-
Can explore data dynamically
-
It can facilitate the dynamic display of your machine learning achievements (you can make a comparison with jupyter notebook)
https://github.com/streamlit/streamlit
2. Installation
pip install streamlit
streamlit hello

#Launch web app
# streamlit run [filename]
streamlit run app.py

# You can now view your Streamlit app in your browser.
# Local URL: http://localhost:8501
3. Introduction to basic components
3.1 layout
There are usually layout css in the web, such as the 12 column deletion system in Bootstrap; Streamlit has at most two left and right columns, usually one column. Add a sidebar through st.sidebar, which can usually be used as a menu to select control operations. In the upper and lower structure, streamlit is arranged from top to bottom according to the code order
import streamlit as st
import numpy as np
import time
import pandas as pd
import datetime
#Sidebar
st.sidebar.title('Menu sidebar')
add_selectbox = st.sidebar.selectbox(
    "This is a drop-down box, please select?",
    ("1", "Home 2", "Mobile 2")
)
#Main column
st.title('Steamlit machine learning web app')

3.2 text
streamlit provides many text display commands and supports markdown syntax
st.header('1. text Text display')
st.markdown('Streamlit is **_really_ cool**.')
st.text('This is some text.')
st.subheader('This is a subheader')
st.write("st.write You can write a lot of things")
st.warning('This is a warning')
3.3 form controls
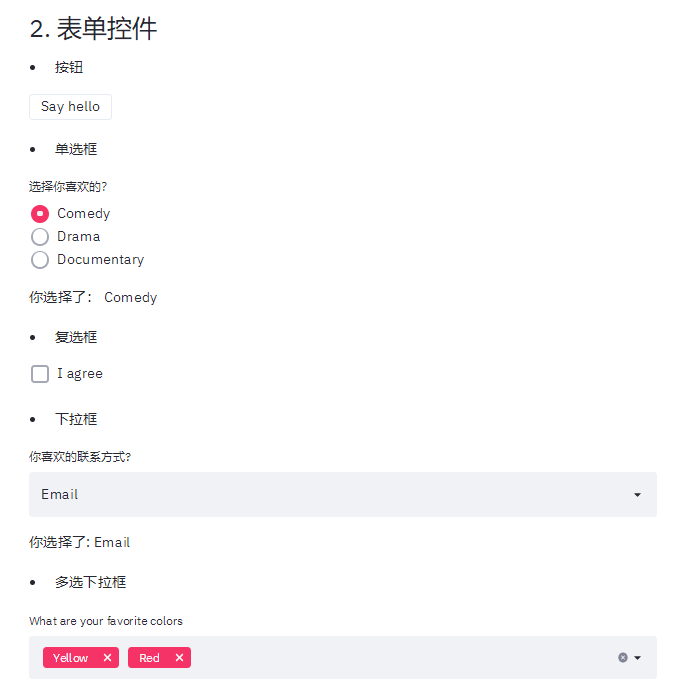
streamlit provides rich form controls, such as buttons, radio boxes, check boxes, drop-down boxes, text boxes and file uploads. The usage is refined as follows:
-
The function call defines the display control, and the return value indicates whether to trigger or trigger the return result; For example, st.button('Say hello ') defines a button. If you press the button, it returns True, otherwise it is False
st.markdown('- Button')
if st.button('Say hello'):
    st.write('Why hello there')

st.markdown('- Radio ')
genre = st.radio(
     "Choose what you like?",
    ('Comedy', 'Drama', 'Documentary'))

st.write('You chose:', genre)


st.markdown('- check box')
agree = st.checkbox('I agree')
if agree:
    st.write('Thank you for agreeing')


st.markdown('- Drop down box')
option = st.selectbox(
    'Contact information you like?',
   ('Email', 'Home phone', 'Mobile phone'))

st.write('You chose:', option)

st.markdown('- Multi selection drop-down box')
options = st.multiselect(
    'What are your favorite colors',
    ['Green', 'Yellow', 'Red', 'Blue'],
    ['Yellow', 'Red'])

st.write('You chose:', options)

st.markdown('- slider')
values = st.slider(
    'Select a range of values',
    0.0, 100.0, (25.0, 75.0))
st.write('Values:', values)


st.markdown('- Text input')
title = st.text_input('Movie title', 'Life of Brian')
st.write('The current movie title is', title)

txt = st.text_area('Text to analyze', '''
    It was the best of times, it was the worst of times, it was
    the age of wisdom, it was the age of foolishness, it was
    the epoch of belief, it was the epoch of incredulity, it
    was the season of Light, it was the season of Darkness, it
    was the spring of hope, it was the winter of despair, (...)
    ''')


st.markdown('- Date and time')
d = st.date_input(
    "birthday",
    datetime.date(2019, 7, 6))
st.write('Your birthday is:', d)

t = st.time_input('alarm clock', datetime.time(8, 45))
st.write('The alarm clock is:', t)

st.markdown('- Upload file')
uploaded_file = st.file_uploader("Choose a CSV file", type="csv")
if uploaded_file is not None:
    data = pd.read_csv(uploaded_file)
    st.write(data)

3.4 images
Common image libraries are supported, and pictures are displayed through st.image
import cv2
img = cv2.imread('sunrise.jpg')
st.image(img[...,::-1], caption='Sunrise by the mountains',
        use_column_width=True)
3.5 chart
-
Support dataframe display chart (line chart, area chart and histogram) in pandas
st.subheader('4.1 dataframe Chart')
@st.cache(persist=True)
def get_data():
    df = pd.DataFrame(
    np.random.randn(200, 3),
    columns=['a', 'b', 'c'])
    return df
df = get_data()
# st.table(df)
st.dataframe(df)
st.line_chart(df)
st.area_chart(df)
st.bar_chart(df)
-
It also supports the chart display of matplotlib, which you should be familiar with
plt.plot(df.a, df.b)
st.pyplot()
3.6 caching
The cache of data in streamlit is decorated with st.cache decorator. Note that it acts on functions. The benefit of caching, as its name suggests, is to avoid reloading data every time it is refreshed.
@st.cache(persist=True)
def get_data():
    df = pd.DataFrame(
    np.random.randn(200, 3),
    columns=['a', 'b', 'c'])
    return df
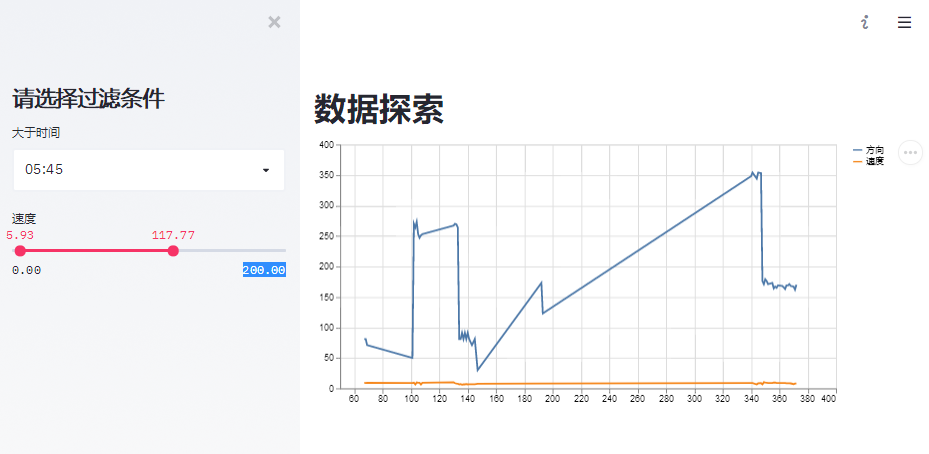
4. Dynamic data demo
import streamlit as st
import numpy as np
import matplotlib.pyplot as plt
import pandas as pd
#Sidebar
st.sidebar.title('Please select filter criteria')
time = st.sidebar.time_input('Greater than time', datetime.time(1, 0))

values = st.sidebar.slider(
    'speed',
    0.0, 200.0, (25.0, 75.0))
#Main column
st.title('Data exploration')
@st.cache(persist=True)
def get_data():
    file = './7000.csv'
    return pd.read_csv(file, header=0)
data = get_data()
# print(values)
display_data = data[data['time'] > str(time)]
display_data = display_data[(display_data['speed'] > values[0]) & (display_data['speed'] < values[1])]
st.line_chart(display_data[['direction', 'speed']])

5. Machine Vision Project demo
In this example, we use face detection to illustrate the display of machine vision projects.
-
Function: upload a picture and detect the face frame
-
The face detection algorithm comes from the facenet project https://github.com/davidsandberg/facenet/tree/master/src/align MTCNN algorithm in
-
The layout is left and right, the upload space is on the left, and the display space is on the right
import streamlit as st
import numpy as np
import matplotlib.pyplot as plt
import time
import pandas as pd
import datetime
import cv2
from PIL import Image
import io
from face_detect.mtcnn_tf import MTCNN

#Sidebar
st.sidebar.title('Please upload a photo and start the test')
uploaded_file = st.sidebar.file_uploader("", type="jpg")

#Main column
st.title('Face detection')
@st.cache()
def init_model():
    mtcnn = MTCNN()
    return mtcnn

detect = init_model()
if uploaded_file is not None:
    # print(uploaded_file)
    data = np.array(Image.open(io.BytesIO(uploaded_file.read())))
    _, bboxs, _, _ = detect.run(data, detect_multiple_faces=True, margin=0)
    # display bbox and landmarks
    for idx, landmark in enumerate(landmarks):
        bbox = bboxs[idx]
        cv2.rectangle(data, (bbox[1], bbox[0]),
                      (bbox[3], bbox[2]), (0, 2255, 0), 2)
    st.image(data, caption='image', use_column_width=False)

6. Summary
Is it convenient to build a web app to show your project in minutes. I hope it will help you. Come on! The summary is as follows:
-
Remember to use cache @ st.cache() for data
-
streamlit can support matplotlib
-
streamlit has beautiful form controls, and the return value of the function is the trigger value
-
streamlit supports markdown