_Following the completion of data storage in the database above, the next function to be achieved is to draw the received data in the form of real-time curves. The main technology used in this paper is a third-party class QCustomPlot, which is powerful and beautiful in drawing. At present, the official version of 1.3.2 and 2.0.0 beta are available. The two versions have the same functions, but there are still many differences. More excellent features are introduced in 2.0.0.
Add QCustomPlot to the project
The blogger uses version 1.3.2, downloads and opens from the web page. The documentation folder provides instructions for use. This help also supports adding to Qt Assistant. Examples are examples, and observation examples are the best way to learn to use this class. "plots" This engineering example gives more than a dozen drawing methods, so long as the sequence number is changed in the program, it can run. To get different results, if you don't want to go into every detail of the QCustomPlot class, the fastest way to apply it is to observe the desired display effect in the example and directly move and modify the relevant code.
_Using this class does not need to add complex operations such as dll, just copy the two files "qcustomplot.c" and "qcustomplot.h" to the project directory.
Drag a Widget control to the area you want to draw when designing the interface. Right-click the control point - > and raise it to "-> QCustomPlot, so that the widget control can use all the functions in QCustomPlot.
Setting Graphic Styles
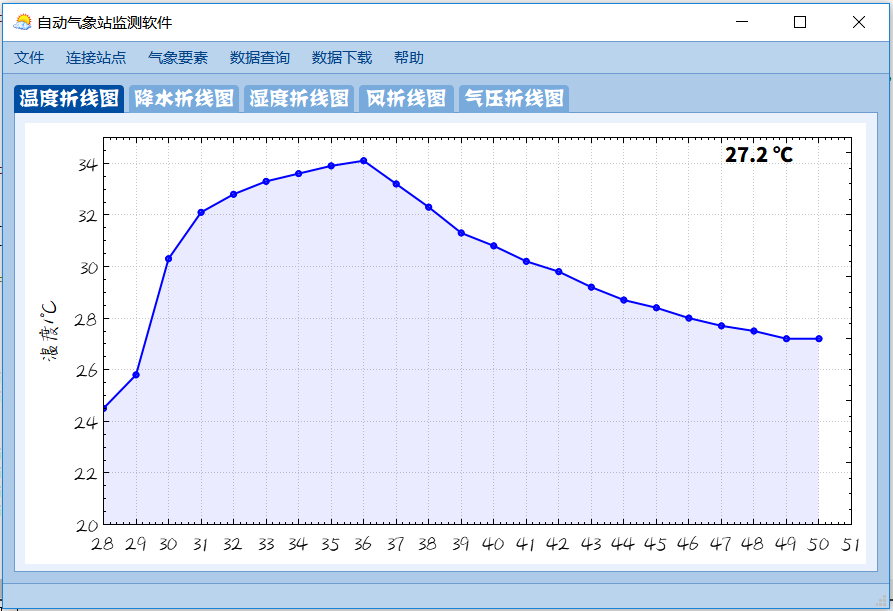
What are the basic elements of a graph? Title, coordinate axis, font and so on, as well as automatic zooming, coordinate axis self-adaptation and other auxiliary functions. I first designed four graphics styles, and then initialized four graphics in the form constructor. Take the temperature polygraph as an example:
void AutomaticStation::plottemp()
{
    //**************************************** Temperature Breakdown Map *************************************************//
    ui->tem_plot->addGraph();                //Add a curve
    QPen pen;
    pen.setWidth(2);
    pen.setColor(Qt::blue);
    ui->tem_plot->graph(0)->setPen(pen);                             //setpc
    ui->tem_plot->graph(0)->setBrush(QBrush(QColor(0, 0, 255, 20))); //Setting Curve Brush Background
    ui->tem_plot->graph(0)->setAntialiasedFill(false);

    /*ui->tem_plot->xAxis->setTickLabelType(QCPAxis::ltDateTime);
    ui->tem_plot->xAxis->setDateTimeFormat("hh:mm:ss");*/
    ui->tem_plot->xAxis->setAutoTickStep(false);
    ui->tem_plot->xAxis->setTickStep(1);
    ui->tem_plot->axisRect()->setupFullAxesBox();

    ui->tem_plot->yAxis->setLabel(QStringLiteral("temperature/℃"));      //Set the y coordinate axis name

    ui->tem_plot->xAxis->setRange(0, 23);
    ui->tem_plot->yAxis->setRange(20, 35);

    ui->tem_plot->setInteractions(QCP::iRangeDrag | QCP::iRangeZoom | QCP::iSelectPlottables);

    ui->tem_plot->graph(0)->setLineStyle((QCPGraph::LineStyle)1);
    ui->tem_plot->graph(0)->setScatterStyle(QCPScatterStyle(QCPScatterStyle::ssCircle, 5));

    //ui->tem_plot->legend->setVisible(true);
    //UI - > tem_plot - > Legend - > setFont (QFont (QString Literal ("New Ti Afternoon Tea Platinum Edition"), 11);
    ui->tem_plot->xAxis->setTickLabelFont(QFont(QStringLiteral("Xinti Afternoon Tea Platinum Edition"),11));
    ui->tem_plot->yAxis->setTickLabelFont(QFont(QStringLiteral("Xinti Afternoon Tea Platinum Edition"),11));
    ui->tem_plot->xAxis->setLabelFont(QFont(QStringLiteral("Xinti Afternoon Tea Platinum Edition"),12));
    ui->tem_plot->yAxis->setLabelFont(QFont(QStringLiteral("Xinti Afternoon Tea Platinum Edition"),12));
    //ui->tem_plot->graph(0)->setScatterStyle(QCPScatterStyle(customScatterPath, QPen(), QColor(40, 70, 255, 50), 10));

    connect(ui->tem_plot->xAxis, SIGNAL(rangeChanged(QCPRange)), ui->tem_plot->xAxis2, SLOT(setRange(QCPRange)));
    connect(ui->tem_plot->yAxis, SIGNAL(rangeChanged(QCPRange)), ui->tem_plot->yAxis2, SLOT(setRange(QCPRange)));
}
It basically shows all the attributes that a drawing can set.
Drawing Real-time Curves
_Close observation will find that there is only a graphics style set here, no data added, the added data should be placed in the slot function bound to the serial port, so that each time new data is received, the graphics will be refreshed, so as to achieve real-time rendering.
         ui->tem_plot->graph(0)->addData(k-1, temp);
         ui->rain_plot->graph(0)->addData(k-1, rain);
         ui->pres_plot->graph(0)->addData(k-1, press);
         ui->hum_plot->graph(0)->addData(k-1, humi);
         // rescale value (vertical) axis to fit the current data:
          if(k >= 24)
          {
              ui->tem_plot->xAxis->setRange(k-23, k);
              ui->rain_plot->xAxis->setRange(k-23, k);
              ui->hum_plot->xAxis->setRange(k-23, k);
              ui->pres_plot->xAxis->setRange(k-23, k);
          }
          ui->tem_plot->replot();
          ui->rain_plot->replot();
          ui->pres_plot->replot();
          ui->hum_plot->replot();
_Use the addData function to add the abscissa and ordinate coordinates of the data to the graph. When the curve exceeds the display range of the current coordinate axis, the setRange function is used to reset the range of the coordinate axis. Finally, you need to use the replot function to redraw the graphics, otherwise the graphics will not be automatically refreshed unless you click with the mouse.
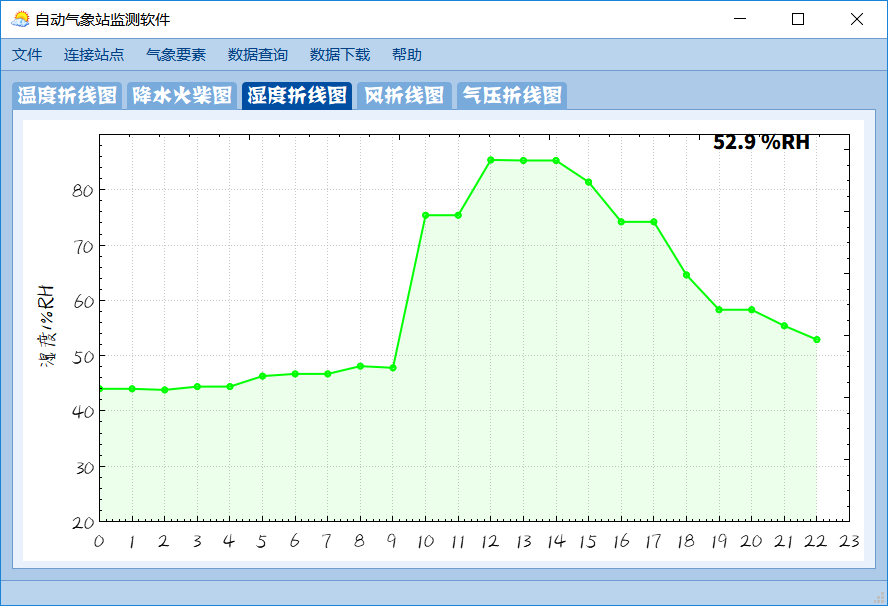
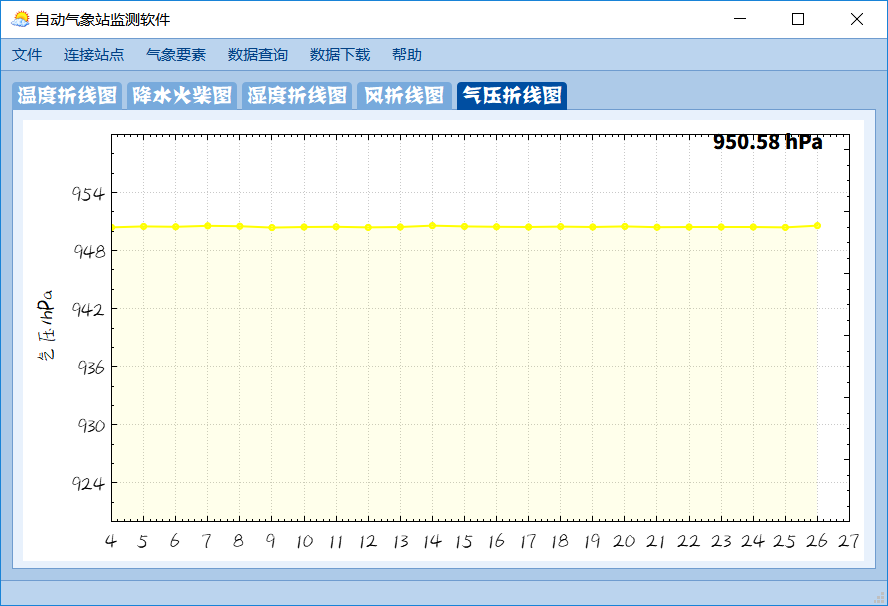
_access to the acquisition board, the display effect is as follows.

_. The intensity of rainfall uses matches instead of polygons. This effect can be achieved by changing the line style of graph s in rainfall plotting.