In the project, I used Canvas to realize the water wave chart, and here I will share with you the principle of its implementation. When you first see waves, you may not know where to start. Let's take a look at the characteristics of waves.
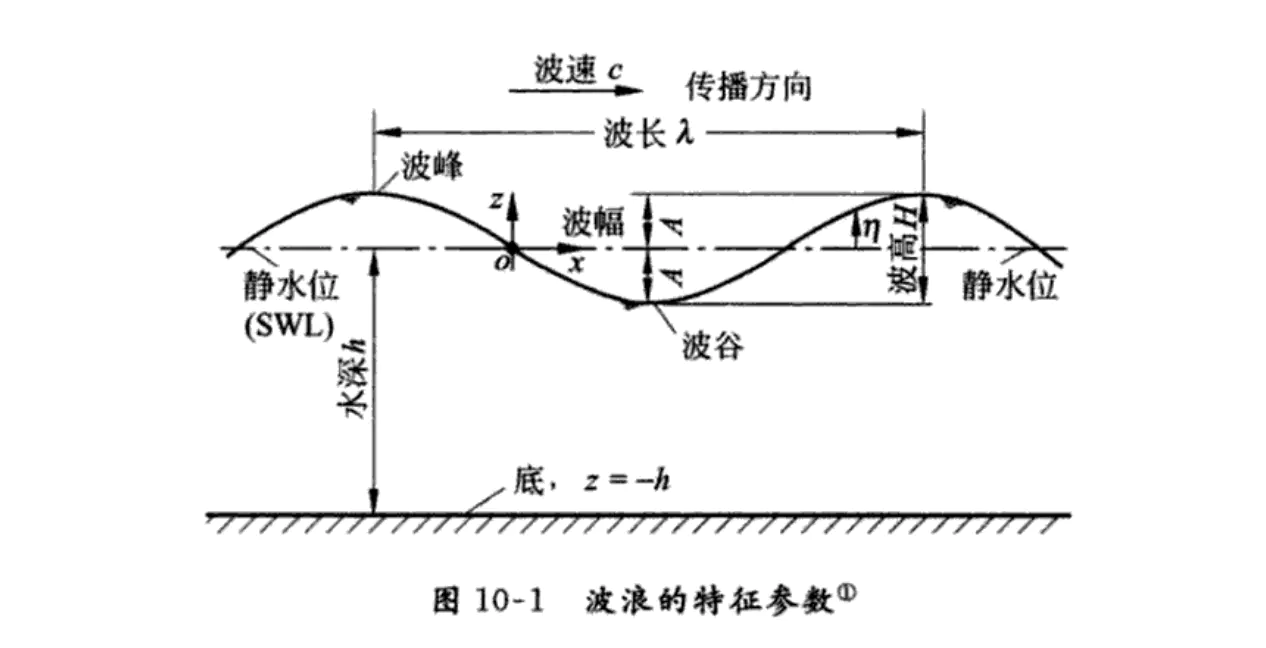
That's right. Someone will surely think of it as a sine-cosine curve. For small wave steepness, the sine or cosine curve is usually chosen to represent the waveform, which is the simplest and closest to the actual waveform. Here I choose the sinusoidal curve to achieve.
Before we talk about the idea of implementation, let's recall the basis of sinusoidal curves.
Sinusoidal curve
Sinusoidal curve formula: y = A sin(Bx + C) + D
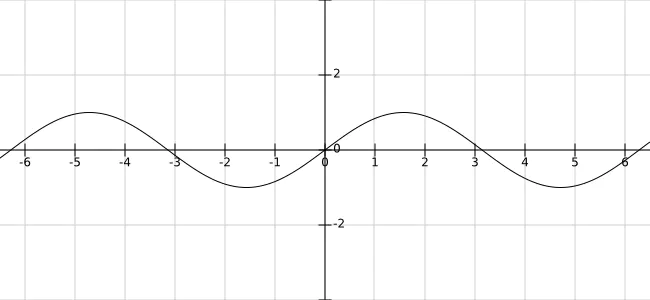
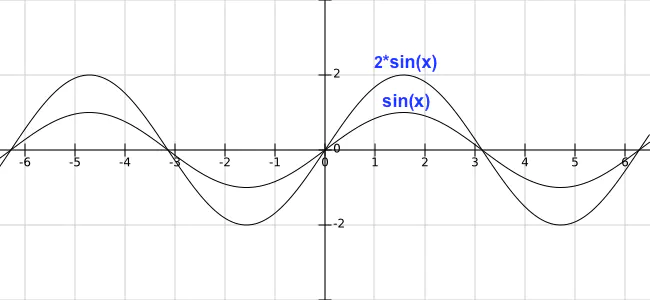
The amplitude is A. The larger the value of A, the steeper the curve is.
The period is 2 pi/B. When the B value is greater than 1, the bigger the B value is, the shorter the period is. When the B value is less than 1 or more than 10, the period becomes longer: 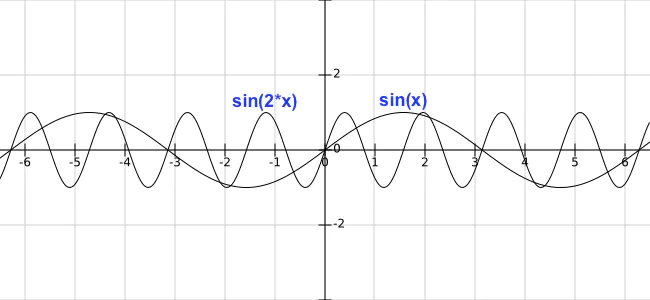
The phase shift is C/B. When B is unchanged and C is positive, the curve moves to the left and C is negative, the curve moves to the right. 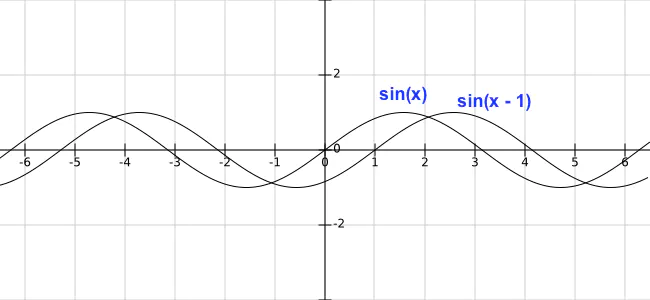
The vertical displacement is D. The control curve moves up and down. 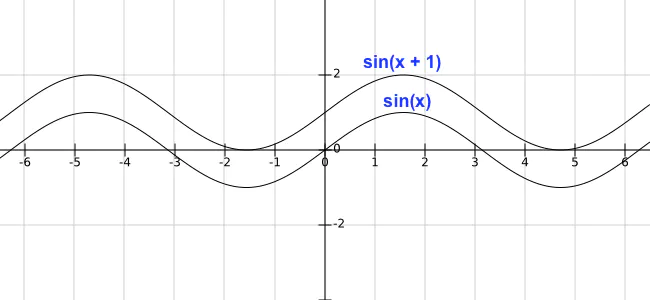
Implementation ideas
Understanding some of the properties of sinusoidal curves, we can use these properties to control waves.
- Amplitude: Controlling the Height of Waves
- Period: Controlling wave width
- Phase Shift: Controlling the Horizontal Movement of Waves
- Vertical Displacement: Controlling the Height of Water Level
The realization of animation effect is mainly based on phase shift, which produces the feeling of wave movement by moving the curve horizontally continuously. Then it can draw many curves. The visual difference between the curves can be generated by controlling the attributes (height, width, moving speed), and the feeling of wave fluctuation will appear.
With these ideas, we will gradually achieve.
Curve drawing
Initialize, define the width of Canvas:
componentDidMount() {
  const self = this;
  const canvas = this.refs.canvas;
  canvas.height = 500;
  canvas.width = 500;
  this.canvas = canvas;
  this.canvasWidth = canvas.width;
  this.canvasHeight = canvas.height;
  const ctx = canvas.getContext('2d');
  this.drawSin(ctx);
}
render() {
  return (
    <div className="content page">
      <canvas ref="canvas"></canvas>
    </div>
  );
}
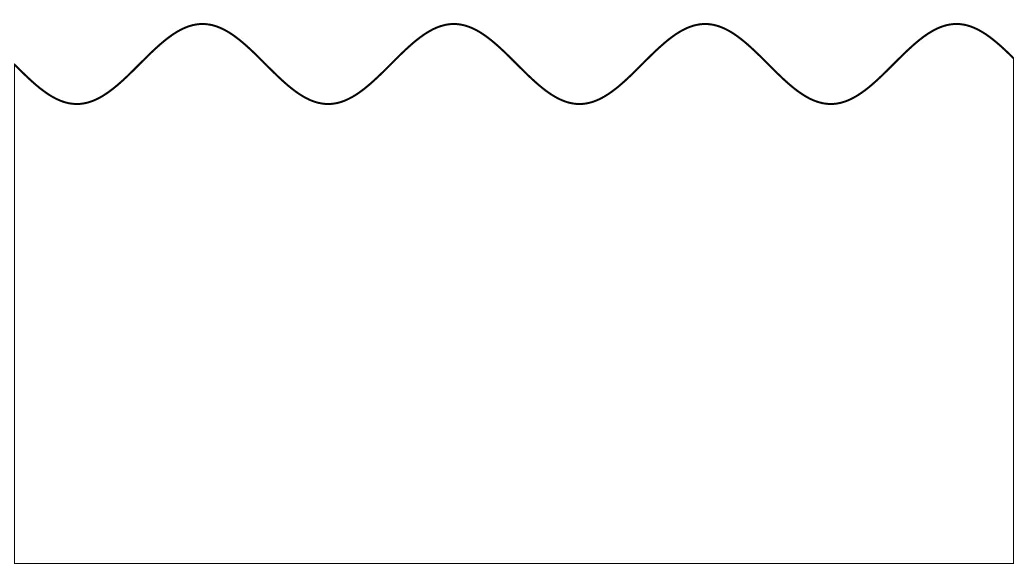
According to the parameter configuration of defined wave, the sinusoidal curve is drawn by formula y = wave height * sin(x * wave width + horizontal displacement):
drawSin(ctx) {
  const points = [];
  const canvasWidth = this.canvasWidth;
  const canvasHeight = this.canvasHeight;
  const startX = 0;
  const waveWidth = 0.05; // Wave width, the smaller the number, the wider the width
  const waveHeight = 20; // The higher the wave height, the higher the number
  const xOffset = 0; // Horizontal displacement

  ctx.beginPath();
  for (let x = startX; x < startX + canvasWidth; x += 20 / canvasWidth) {
    const y = waveHeight * Math.sin((startX + x) * waveWidth + xOffset);
    points.push([x, (canvasHeight / 2) + y]);
    ctx.lineTo(x, (canvasHeight / 2) + y);
  }
  ctx.lineTo(canvasWidth, canvasHeight);
  ctx.lineTo(startX, canvasHeight);
  ctx.lineTo(points[0][0], points[0][1]);
  ctx.stroke();
}
When the curve is drawn, the curve is static. How to make it move? As mentioned in the preceding thought, dynamic effects can be produced by continuously changing the horizontal offset (xOffset) so that the curve moves horizontally.
componentDidMount() {
  ...
  this.xOffset = 0;  // Initial offset
  this.speed = 0.1;  // migration velocity
  requestAnimationFrame(this.draw.bind(this, canvas));
}

draw() {
  const canvas = this.canvas;
  const ctx = canvas.getContext('2d');
  ctx.clearRect(0, 0, canvas.width, canvas.height);
  // Curve drawing
  this.drawSin(ctx, this.xOffset);
  this.xOffset += this.speed;
  requestAnimationFrame(this.draw.bind(this));
}

drawSin(ctx, xOffset = 0) {
  ...
}
Spherical shape rendering
Now that our prototype has come out, the curve and dynamic effects have been achieved, it can be seen that water is mounted on a cuboid, if water is mounted on a sphere?
Here we use clip() method of Canvas to define the shear area. After defining the shear area, the browser will restrict all drawing operations to the region. So we can draw a circle first. After defining the area drawn can only be in the region of the circle, the excess part will not be displayed, so that the effect of wave in a sphere can be formed. 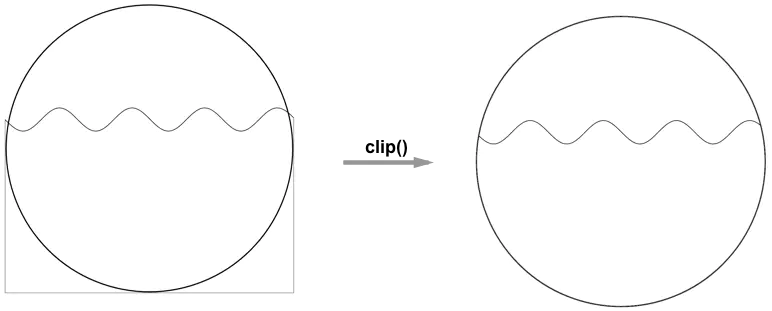
draw() {
  ...
  if (!this.isDrawCircle) {
    this.drawCircle(ctx);
  }
  this.drawSin(ctx, this.xOffset);
  this.xOffset += this.speed;
  requestAnimationFrame(this.draw.bind(this));
}

drawCircle(ctx) {
  const r = this.canvasWidth / 2;
  const lineWidth = 5;
  const cR = r - (lineWidth);
  ctx.lineWidth = lineWidth;
  ctx.beginPath();
  ctx.arc(r, r, cR, 0, 2 * Math.PI);
  ctx.stroke();
  ctx.clip();
  this.isDrawCircle = true;
}
Water level control
Does it feel a little bit? At present, it is still a little bit short of controlling the water level, that is, the percentage mapped to the data. If you pay attention to the above, you will find that the calculation of sinusoidal y coordinates, and finally add canvas Height / 2, in fact, here is the setting of water level.
Let's see: y = A sin(Bx + C) + D, the height of the curve is determined by A and D, A controls the height of the wave, and the actual water level is controlled by D.
The height of water level, visually speaking, means the percentage of data. Assuming that the current percentage is 80%, the height of water level is canvas Height* 0.8. The coordinates mapped to coordinate system y are canvas Height* (1 - 0.8). The origin of the coordinates is in the upper left corner.
In addition to the horizontal movement of the sinusoidal curve, we add the effect of rising water level to the animation effect.
componentDidMount() {
  ...
  this.xOffset = 0;
  this.speed = 0.1;
  // Water level value
  this.rangeValue = 0.6;
  // Initial water level
  this.nowRange = 0;
  requestAnimationFrame(this.draw.bind(this, canvas));
}

draw() {
  ...
  this.drawSin(ctx, this.xOffset, this.nowRange);
  this.xOffset += this.speed;
  if (this.nowRange < this.rangeValue) {
    this.nowRange += 0.01;
  }
  requestAnimationFrame(this.draw.bind(this));
}

drawCircle(ctx) {
  ...
}

drawSin(ctx, xOffset = 0, nowRange = 0) {
  ...
  for (let x = startX; x < startX + canvasWidth; x += 20 / canvasWidth) {
    const y = waveHeight * Math.sin((startX + x) * waveWidth + xOffset);
    points.push([x, (1 - nowRange) * canvasHeight + y]);
    ctx.lineTo(x, (1 - nowRange) * canvasHeight + y);
  }
  ...
}
Final effect
Finally, if we add color and add another sine curve, we will have the feeling of wave fluctuation. 
When drawing the sphere above, we use the method of shearing area. Some people will surely think that I can create the effect of water in various containers by using other shapes instead of cutting the circle.
Source code: https://github.com/beyondxgb/wave-demo
Reprinted in: the martyr of the end of the war