Recently, I analyzed the vision data of a child and recorded it. Small partners who need data can download it.
import numpy as np
import pandas as pd
import matplotlib.pyplot as plt
import re
import os
import seaborn as sns
import scipy.stats as ss
plt.rcParams['font.family'] = ['SimHei']
plt.rcParams['axes.unicode_minus'] = False


res_dir = "E:\colleague\Ophthalmology Department\\use\arrangement\\res_dir_yanke"

df = pd.read_excel(os.path.join(res_dir, "noNullSex_8783.xlsx"))
df.shape
df.keys()
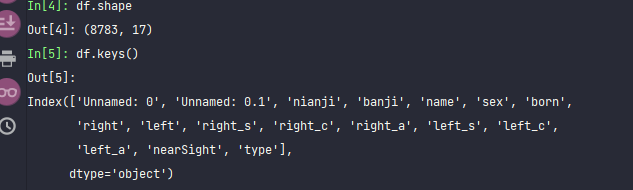
A total of 8783 data. The variables are:
Grade, class, name, gender, date of birth, right eye vision, left eye vision, right ophthalmoscope s, right ophthalmoscope c, right ophthalmoscope a, left ophthalmoscope s, left ophthalmoscope c, left ophthalmoscope a, whether vision is poor, school stage (divided into kindergarten, primary school and junior middle school)
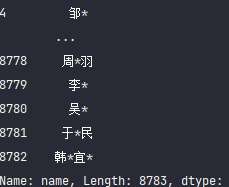
# Replace the name part first. To protect privacy, replace the middle part.

name2 = [  re.sub(r'(\w)(\w)', r'\1*', x) for x in df['name'] ]
name2
df['name'] = name2
df['name']
df.info()
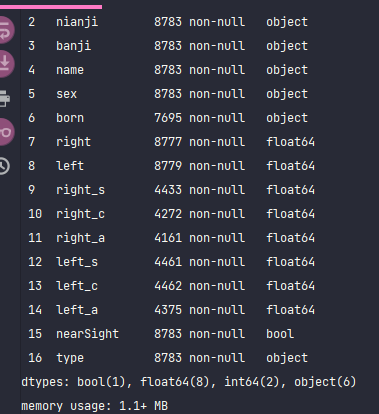
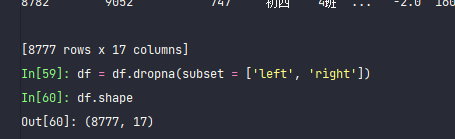
The basic information is complete. In the data of left and right eyes, some visual acuity is missing. There are 8777 valid data for the right eye and 8779 valid data for the left eye. Because two eyes are the main data, the basic visual acuity must be. Delete the missing.
df = df.dropna(subset = ['left', 'right'])
df.shape
df[['right', 'left']].describe()
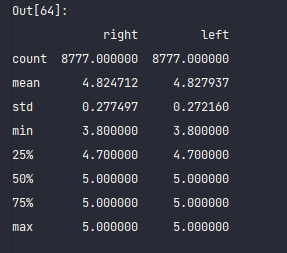
This is all the basic information.
First, you can have a look in groups. Mean.
df['type'].value_counts()
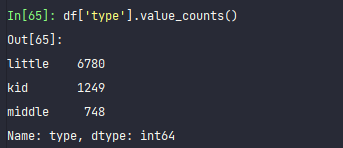
The number of primary schools is 6780, kindergartens 1249 and junior middle schools 748
What is the average of each group.
df.groupby('type')['right', 'left'].mean()
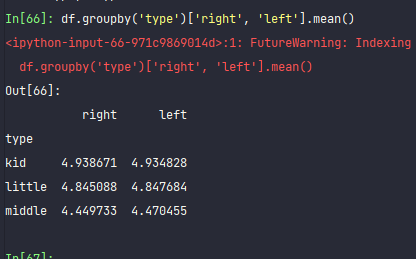
It can be seen that kindergarten children's eyesight is the best. In junior middle school, their eyesight has basically decreased to about 4.5. It's all myopia.
Of course, you can also look at the distribution of data in junior middle school.
df[df['type'] == "middle"]['right'].describe()
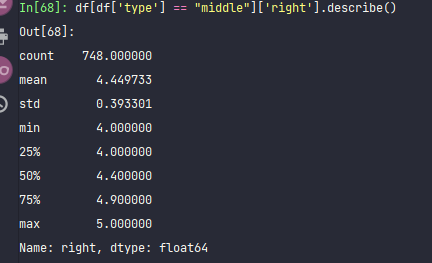
From the perspective of the right eye alone, the median of junior middle school students is 4.4. A quarter of the students have their eyesight below 4.0.
In terms of eyesight, there are the following criteria:
1. Poor eyesight means that the eyesight of any one of the left and right eyes is less than 5.0, even if the eyesight is poor.
2. Myopia, the visual acuity of left and right eyes is less than 5.0, and the spherical mirror a data of monocular is less than -0.5. Even if myopia is greater than a positive number, it is hyperopia. Here only take myopia as an example.
Firstly, a variable of poor vision is generated to judge whether the vision of any eye is below 5.0.
df['sight_impaired'] = ( df['right'] < 5.0  ) | (df['left'] < 5.0 )
df['sight_impaired'].value_counts()
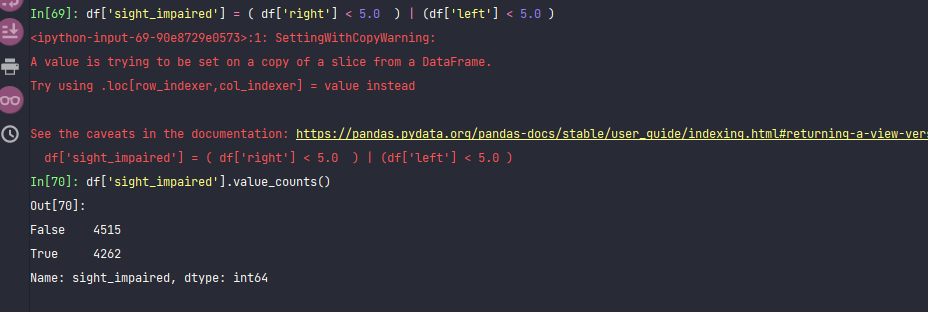
It can be seen that nearly half of them have poor eyesight.
But there are also many children in kindergartens who have poor eyesight. If you don't believe it, you can group and have a look.
df.groupby('type')['sight_impaired'].value_counts(normalize=True).unstack()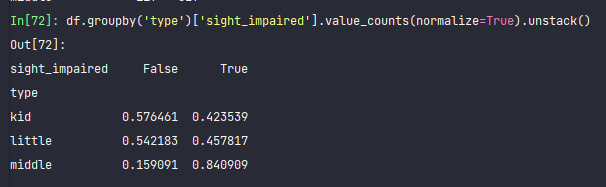
df['nianji'].value_counts()
df.groupby('nianji')['sight_impaired'].value_counts(normalize=True).unstack()
df['nianji'].unique()
nianji_order = ['Toban','a reception class', 'middle shift', 'Big class',   'first grade', 'second grade', 'Third grade', 'fourth grade', 'fifth grade', 'First day', 'Junior three', 'The second day of junior high school', 'fourth day of a lunar month']

x = df.groupby('nianji')['sight_impaired'].value_counts(normalize=True).unstack()
x
x.reindex(nianji_order)[True]
x.reindex(nianji_order)[True].plot()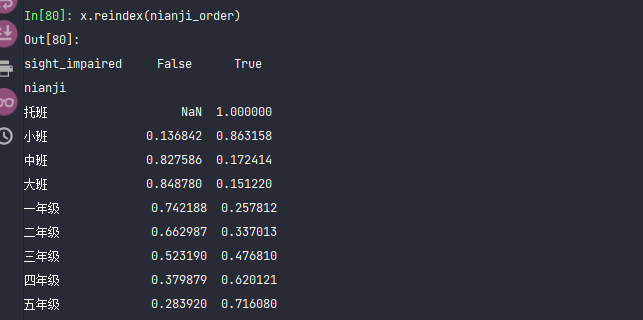
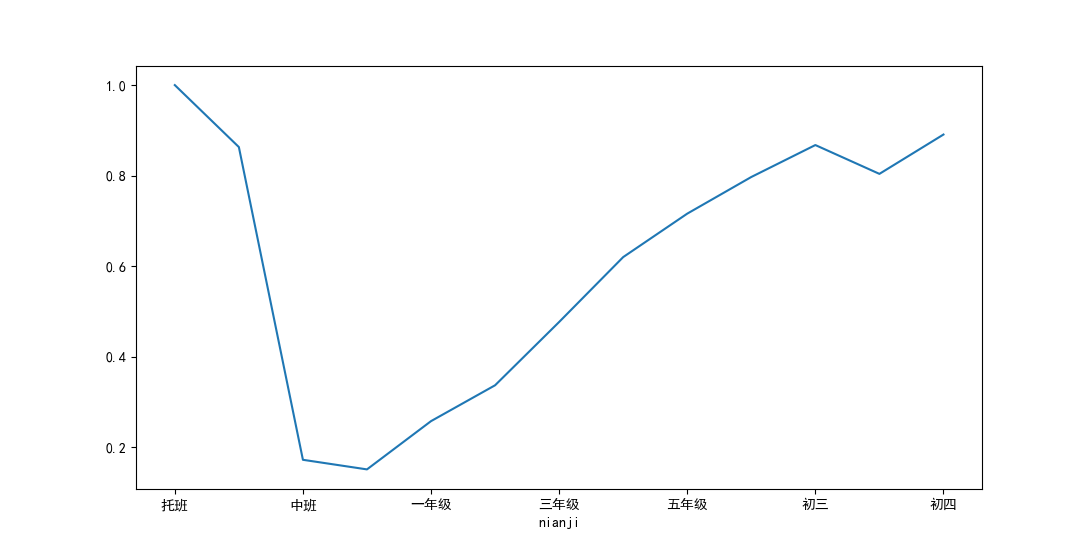
It is found that the proportion of kindergarten children with poor eyesight is high. In fact, this is because most kindergarten children are hyperopia. When they grow up, their eyesight will return to normal. For example, children in grade one basically have vision of 5.0, which is no problem, but the higher the grade, the higher the proportion of poor vision, and the fourth day of junior high school is close to 100%. Almost myopia. Although both kindergarten and junior high school are engaged in, they are two completely different high schools.
It can be seen from the proportion of myopia.
This uses the previous criteria for myopia.
The visual acuity of either of the left and right eyes is below 5.0, and the spherical mirror s value is less than -0.5. A variable needs to be generated. If these conditions are met, it is determined to be True, otherwise it is False