1, Full traversal keys
1) Explain
It is used to list all key s that meet specific regular string rules. When the amount of redis data is large, the performance is poor. It should be avoided.
Popular understanding: if there are few key values, you can directly use keys to obtain all data; After keys, you can use wildcard query. However, keys scans the entire database. If the amount of data is large, the performance will be slow
2)demo
127.0.0.1:6379> keys *
 1) "user:1:balance"
 2) "queue"
 3) "huohuo125"
 4) "test1"
 5) "user:2:balance"
 6) "huohuo123"
 7) "huocount"
 8) "user:2:name"
 9) "exists-key"
10) "test"
11) "not-test1-key"
12) "mykey"
13) "huo"
14) "page_rank"
15) "huohuo"
16) "huohuo124"
17) "user:1:name"
127.0.0.1:6379> keys huohuo*
1) "huohuo125"
2) "huohuo123"
3) "huohuo"
4) "huohuo124"
127.0.0.1:6379> keys huo*huo
1) "huo1huo"
2) "huohuo"
3) "huo2huo"
Note: * can be placed in the front, middle and back positions, just like mysql
2, Progressive traversal key scan
1) Explain
SCAN cursor [MATCH pattern] [COUNT count]
There are three parameters:
- First cursor integer value (index value of hash bucket)
- The second is the regular pattern of key
- The third is the number of key s traversed at one time (reference value, the number of bottom-level traversals is not necessarily), which is not the number of qualified results
2) Understanding of count
For count, the value obtained is inaccurate. Because there is no index in redis, it can not achieve the same paging and accurate query as mysql, and it is only progressive traversal through scan. For example, if I want to fuzzy query huohuo * and want to output count3, it also depends on whether all the three obtained values meet my query conditions, so this count is also a reference value.
count3 may return a result set less than 3 or greater than 3
3) Understanding of cursor
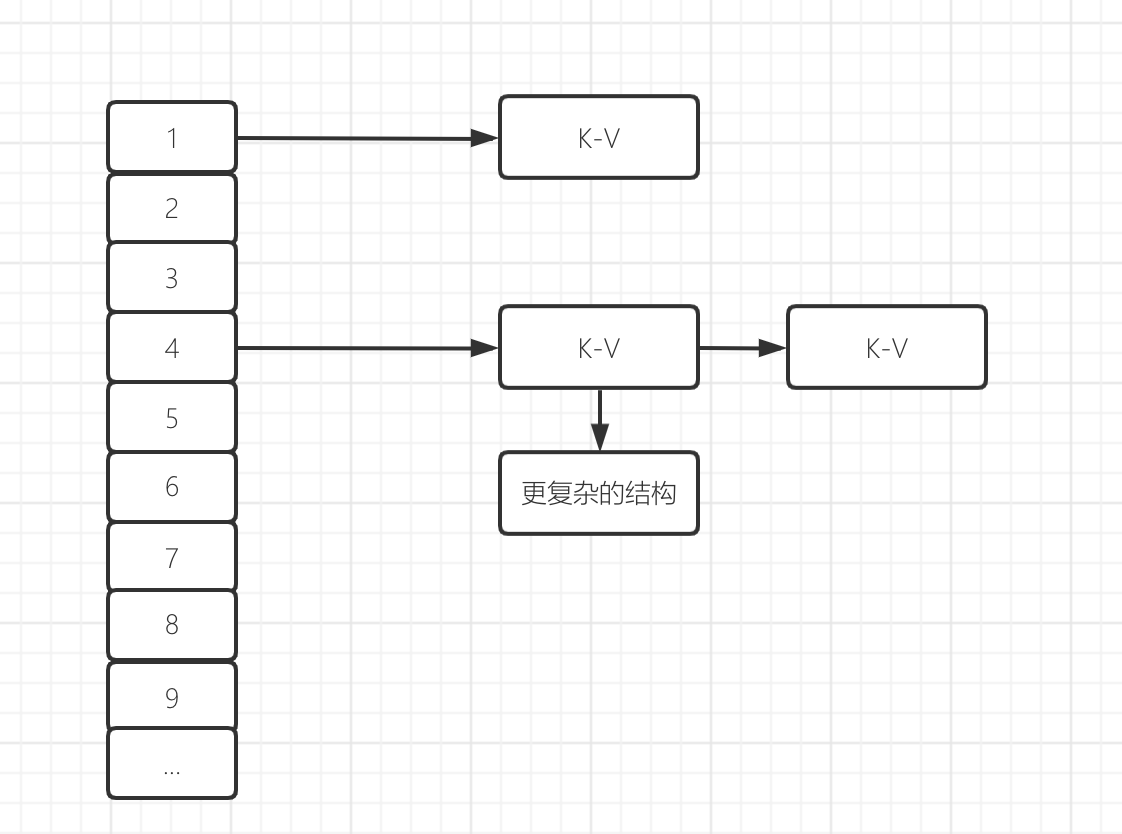
The index value obtained is the hash bucket, which depends on the underlying data structure of redis. In fact, the bottom layer of redis is a hashmap. By calculating the hash and placing it in the corresponding position, cursor obtains the hash value.
During the first traversal, the cursor value is 0, and then the first integer value in the returned result is used as the cursor for the next traversal. The traversal ends when the returned cursor value is 0.
4) redis simple diagram
The underlying principles of redis will be sorted out later

4)demo
Through keys huohuo *, we can see that the qualified result set is 4
127.0.0.1:6379> keys huohuo*
1) "huohuo125"
2) "huohuo123"
3) "huohuo"
4) "huohuo124"
127.0.0.1:6379>
scan progressive paging, and the query results are as follows:
127.0.0.1:6379> scan 0 match huohuo* count 2
1) "4"
2) (empty array)
127.0.0.1:6379> scan 4 match huohuo* count 2
1) "12"
2) (empty array)
127.0.0.1:6379> scan 12 match huohuo* count 2
1) "2"
2) 1) "huohuo"
127.0.0.1:6379> scan 2 match huohuo* count 2
1) "14"
2) (empty array)
127.0.0.1:6379> scan 14 match huohuo* count 2
1) "1"
2) (empty array)
127.0.0.1:6379> scan 1 match huohuo* count 2
1) "25"
2) 1) "huohuo125"
127.0.0.1:6379> scan 25 match huohuo* count 2
1) "3"
2) 1) "huohuo124"
127.0.0.1:6379> scan 3 match huohuo* count 2
1) "15"
2) (empty array)
127.0.0.1:6379> scan 15 match huohuo* count 2
1) "0"
2) 1) "huohuo123"
3, info
127.0.0.1:6379> info
# Server
redis_version:6.0.15
redis_git_sha1:00000000
redis_git_dirty:0
redis_build_id:e95e6f5266fb21ce
redis_mode:standalone
os:Darwin 20.6.0 x86_64
arch_bits:64
multiplexing_api:kqueue
atomicvar_api:atomic-builtin
gcc_version:4.2.1
process_id:94976
run_id:222189a1374272334dca5d7e090669db6bbe6b1d
tcp_port:6379
uptime_in_seconds:1320753
uptime_in_days:15
hz:10
configured_hz:10
lru_clock:9709700
executable:/usr/local/redis-6.0.15/redis-server
config_file:/usr/local/redis-6.0.15/etc/redis.conf
io_threads_active:0

# Clients
connected_clients:1
client_recent_max_input_buffer:16
client_recent_max_output_buffer:0
blocked_clients:0
tracking_clients:0
clients_in_timeout_table:0

# Memory
used_memory:1137712
used_memory_human:1.09M
used_memory_rss:806912
used_memory_rss_human:788.00K
used_memory_peak:3854976
used_memory_peak_human:3.68M
used_memory_peak_perc:29.51%
used_memory_overhead:1098184
used_memory_startup:1079488
used_memory_dataset:39528
used_memory_dataset_perc:67.89%
allocator_allocated:1099296
allocator_active:769024
allocator_resident:769024
total_system_memory:8589934592
total_system_memory_human:8.00G
used_memory_lua:37888
used_memory_lua_human:37.00K
used_memory_scripts:0
used_memory_scripts_human:0B
number_of_cached_scripts:0
maxmemory:0
maxmemory_human:0B
maxmemory_policy:noeviction
allocator_frag_ratio:0.70
allocator_frag_bytes:18446744073709221344
allocator_rss_ratio:1.00
allocator_rss_bytes:0
rss_overhead_ratio:1.05
rss_overhead_bytes:37888
mem_fragmentation_ratio:0.73
mem_fragmentation_bytes:-292384
mem_not_counted_for_evict:196
mem_replication_backlog:0
mem_clients_slaves:0
mem_clients_normal:17440
mem_aof_buffer:208
mem_allocator:libc
active_defrag_running:0
lazyfree_pending_objects:0

# Persistence
loading:0
rdb_changes_since_last_save:0
rdb_bgsave_in_progress:0
rdb_last_save_time:1637047146
rdb_last_bgsave_status:ok
rdb_last_bgsave_time_sec:0
rdb_current_bgsave_time_sec:-1
rdb_last_cow_size:0
aof_enabled:1
aof_rewrite_in_progress:0
aof_rewrite_scheduled:0
aof_last_rewrite_time_sec:-1
aof_current_rewrite_time_sec:-1
aof_last_bgrewrite_status:ok
aof_last_write_status:ok
aof_last_cow_size:0
module_fork_in_progress:0
module_fork_last_cow_size:0
aof_current_size:2131
aof_base_size:1713
aof_pending_rewrite:0
aof_buffer_length:0
aof_rewrite_buffer_length:0
aof_pending_bio_fsync:0
aof_delayed_fsync:0

# Stats
total_connections_received:103
total_commands_processed:45
instantaneous_ops_per_sec:0
total_net_input_bytes:2602076
total_net_output_bytes:10020714
instantaneous_input_kbps:0.00
instantaneous_output_kbps:0.00
rejected_connections:0
sync_full:0
sync_partial_ok:0
sync_partial_err:0
expired_keys:0
expired_stale_perc:0.00
expired_time_cap_reached_count:0
expire_cycle_cpu_milliseconds:558728
evicted_keys:0
keyspace_hits:5
keyspace_misses:2
pubsub_channels:0
pubsub_patterns:0
latest_fork_usec:687
migrate_cached_sockets:0
slave_expires_tracked_keys:0
active_defrag_hits:0
active_defrag_misses:0
active_defrag_key_hits:0
active_defrag_key_misses:0
tracking_total_keys:0
tracking_total_items:0
tracking_total_prefixes:0
unexpected_error_replies:0
total_reads_processed:200149
total_writes_processed:200046
io_threaded_reads_processed:0
io_threaded_writes_processed:0

# Replication
role:master
connected_slaves:0
master_replid:4154e2fdc9c35942aaf4d934564373871339d58a
master_replid2:0000000000000000000000000000000000000000
master_repl_offset:0
second_repl_offset:-1
repl_backlog_active:0
repl_backlog_size:1048576
repl_backlog_first_byte_offset:0
repl_backlog_histlen:0

# CPU
used_cpu_sys:259.603210
used_cpu_user:64.060310
used_cpu_sys_children:0.015204
used_cpu_user_children:0.002908

# Modules

# Cluster
cluster_enabled:0

# Keyspace
db0:keys=19,expires=0,avg_ttl=0
It's divided into nine pieces
- Environment parameters for Server operation
- Clients client related information
connected_clients:1 Connecting client instructions
- Memory server running memory statistics
used_memory:1137712             Redis Total memory allocated(byte),contain redis Internal process overhead and memory occupied by data
used_memory_human:1.09M         Redis Total memory allocated(Kb,human Exhibition display unit)
used_memory_rss_human:788.00K   The amount of memory requested from the operating system(Mb)(This value is generally greater than used_memory Yes, because Redis Memory allocation policy will generate memory fragmentation)
used_memory_peak:3854976        redis Peak memory consumption(byte)
used_memory_peak_human:3.68M    redis Peak memory consumption(KB)

maxmemory:0                     The maximum available memory value set in the configuration(byte),Default 0,No restrictions
maxmemory_human:0B              The maximum available memory value set in the configuration
maxmemory_policy:noeviction     When reached maxmemory Elimination strategy at
- Persistence persistent information
- Stats general statistics
instantaneous_ops_per_sec:0 How many instructions are executed per second
- Replication master-slave replication related information
- CPU usage
- Cluster cluster information
- KeySpace key value pair statistics quantity information