Program Functions
The main function of this program is to import data from files into the clickhouse database.
[Problem Description]
Server memory runs out at regular intervals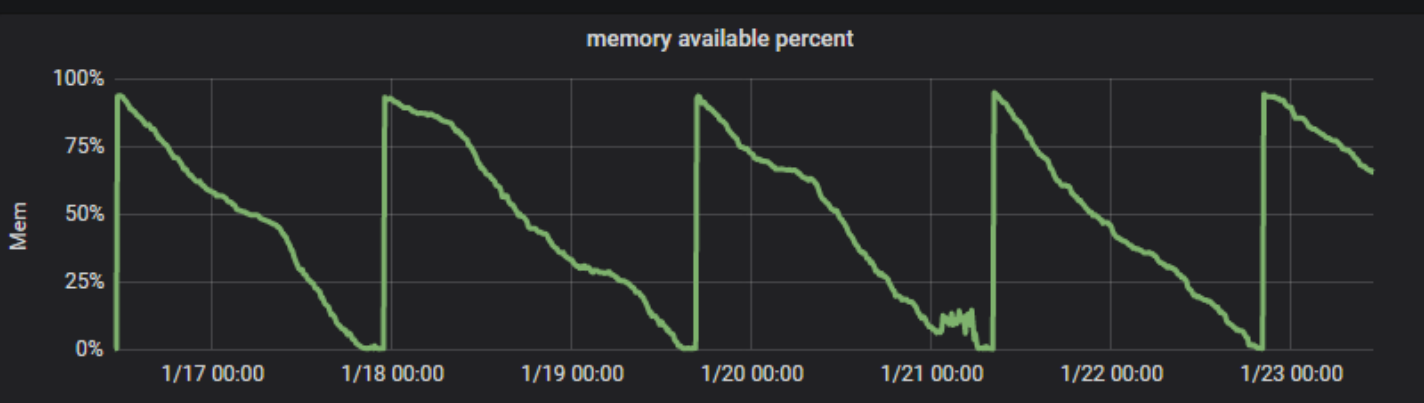
[Problem Analysis]
Because it was developed in go language, pprof, a tool popular in the industry, was used.
Reference URL:https://cizixs.com/2017/09/11/profiling-golang-program/
Use of tools and ideas:
1) Modify the source code first
2) Installation tool observation
3) Analysis based on the phenomenon of tool capture
4) Fix memory defect codes, and then fix memory leaks based on analysis results
5) Release code for tracking analysis
==================================================
1) Modify the code:
You need to write a few lines of code before you can use this tool to collect data.
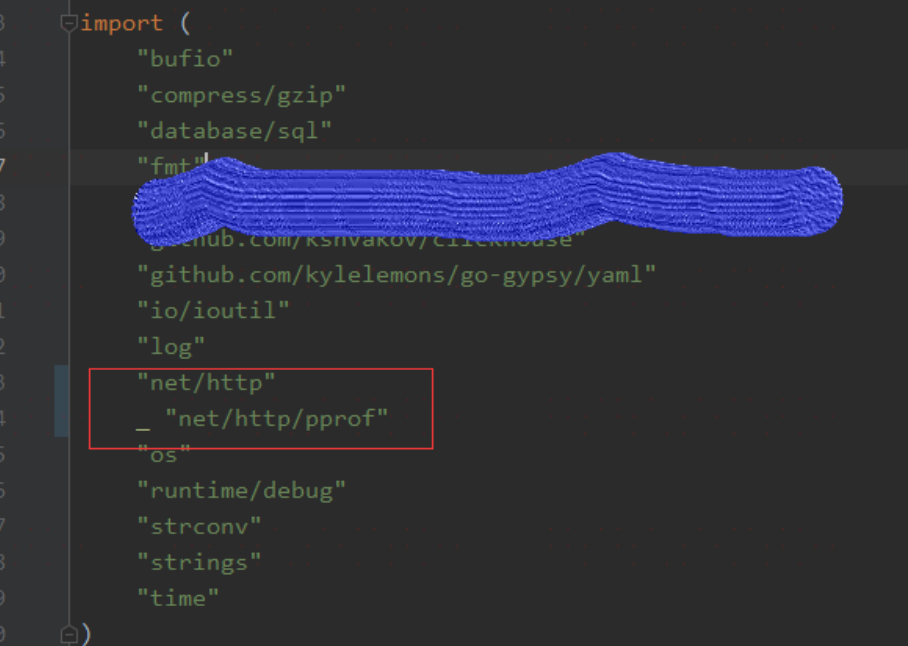
1 //Reference pprof
2 import "net/http"
3 import_ "net/http/pprof"
4
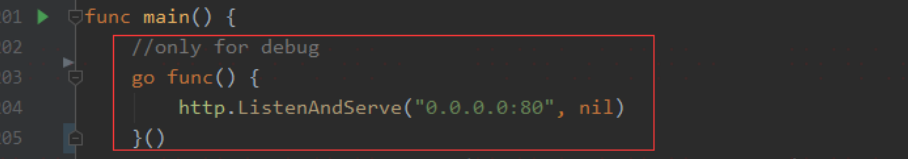
5 //New Port Monitor in Main Function
6 //Since my code is a daemon, here's a new way to open a monitoring protocol to prevent blocking
7 func main(){
8 go func(){
9 http.ListenAndServe("0.0.0.0:80", nil)
10 }()
11 //Other Codes
12 ...
13 }
After the source code modification above, redeploy to the server to observe the memory condition;
Memory can still continue to consume memory without releasing it.
2) Install golang pprof program on the server to collect data.
Installation method: yum install golang pprof
3) Use the command to dump heap. The advantage of this tool is that after dump, pdf or png can be generated directly
1 [root@centos ~]# go tool pprof /root/clickhouse_runner/clickhouse_mssql_e

tl http://0.0.0.0:80/debug/pprof/heap

2 Fetching profile over HTTP from http://0.0.0.0:80/debug/pprof/heap

3 Saved profile in /root/pprof/pprof.clickhouse_mssql_etl.alloc_objects.all

oc_space.inuse_objects.inuse_space.012.pb.gz

4 File: clickhouse_mssql_etl

5 Type: inuse_space

6 Time: Feb 5, 2020 at 4:15pm (CST)

7 Entering interactive mode (type "help" for commands, "o" for options)

8 (pprof) pdf

9 Generating report in profile003.pdf

10 (pprof) quit

11 [root@centos ~]
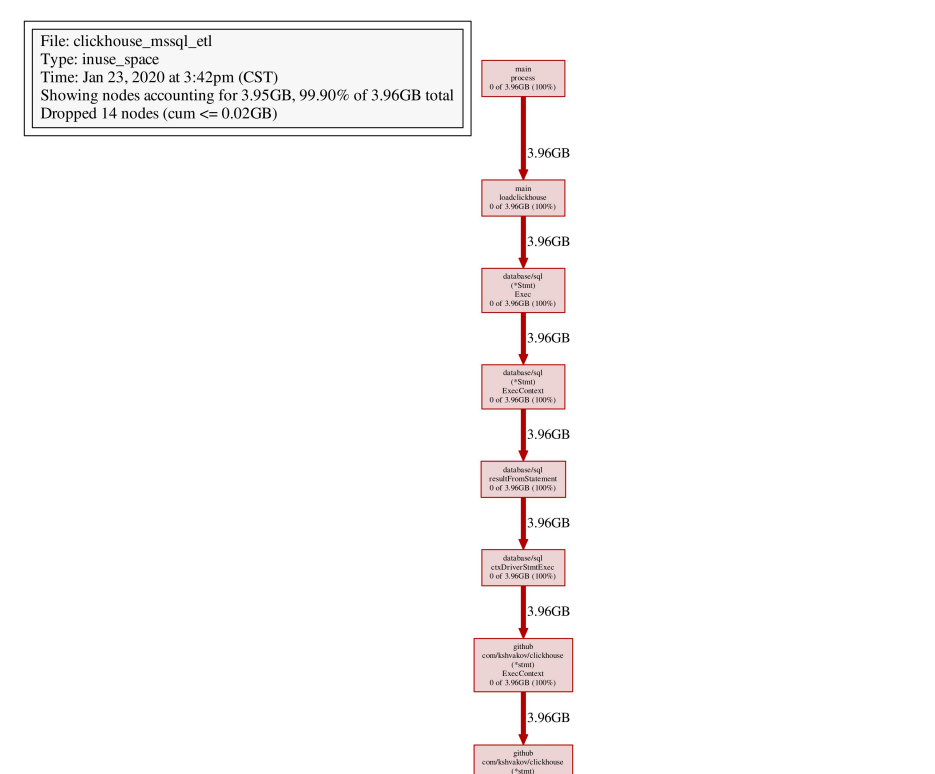
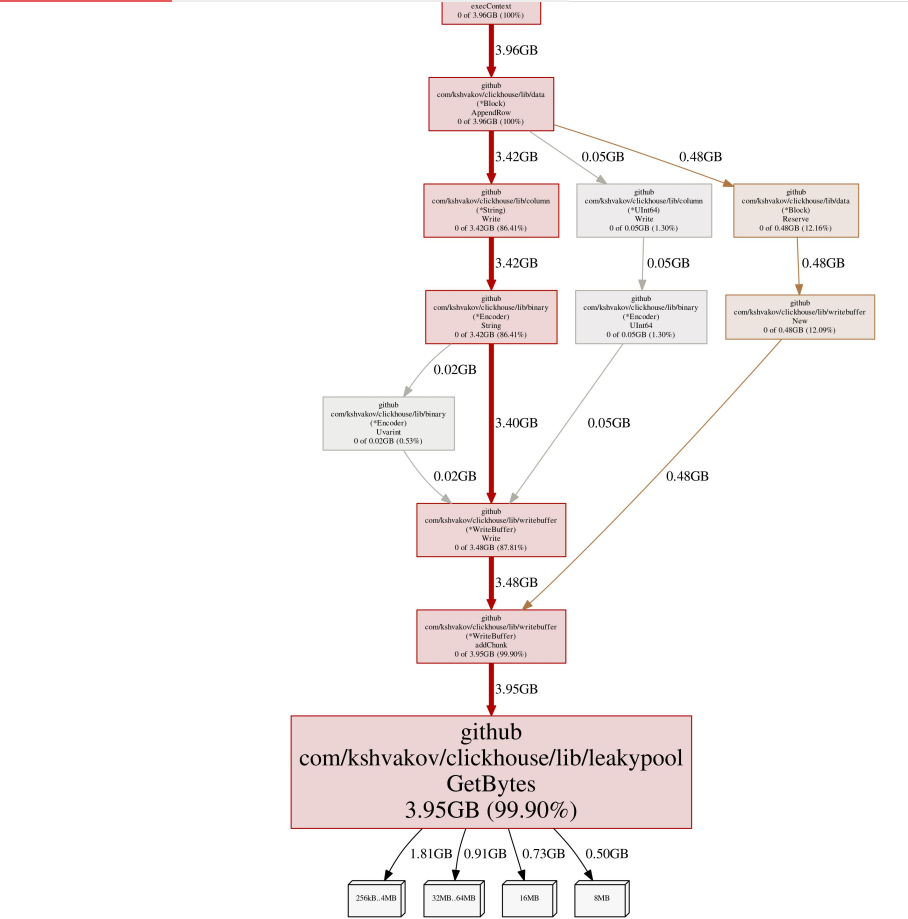
From the heap above, it is clear that the main memory usage in the code is driven by the clickhouse, and the part calling the Clickhouse is not freeing up memory (the memory gc logic of golang was carefully analyzed later because of the lag in gc speed, while the importer is creating faster and thus slower).
4) Find the source of the memory leak and start modifying the code
Source code before modification:
1 connect, err := sql.Open("clickhouse", connstring)

2 if err != nil {

3 return err

4 }

5 load_start := time.Now()

6 tx, err := connect.Begin()

7 if err != nil {

8 log.Println(full_filename, "begin err", err)

9 return err

10 }

11 stmt, err := tx.Prepare("insert ... values....")

12 if err != nil {

13 log.Println(full_filename, "preare err", err)

14 return err

15 }

16 _, er := stmt.Exec(...)

17 if er != nil {

18 log.Println("err", er)

19 }

20 er2 := tx.Commit()

21 if er2 != nil {

22 log.Println(db_view, "err", er2)

23 }

24 stmt.Close()

25 connect.Close()
//Summarize that there are two ways to improve memory leaks by analyzing your own code and the clickhouse driver code
Leakage:
a. Modify the driver code in the clickhouse and reset the memory immediately after executing the code instead of waiting for gc to process it:
1 func (stmt *stmt) Close() error {

2 stmt.ch.logf("[stmt] close")

3 //Add Recycle Memory Data Again

4 if stmt.ch.block != nil {

5 stmt.ch.block.Reset()

6 }

7 return nil

8 }
b. Release stmt objects directly, and use gc's automatic recycling (it would be more reasonable to consider this approach)
1 stmt.Close()

2 connect.Close()

3 //Add direct stmt, connect object to nil

4 //clear mem

5 stmt = nil

6 tx = nil

7 connect = nil
Complete code after modification:
1 connect, err := sql.Open("clickhouse", connstring)

2 if err != nil {

3 return err

4 }

5 load_start := time.Now()

6 tx, err := connect.Begin()

7 if err != nil {

8 log.Println(full_filename, "begin err", err)

9 return err

10 }

11 stmt, err := tx.Prepare("insert ... values....")

12 if err != nil {

13 log.Println(full_filename, "preare err", err)

14 return err

15 }

16 _, er := stmt.Exec(...)

17 if er != nil {

18 log.Println("err", er)

19 }

20 er2 := tx.Commit()

21 if er2 != nil {

22 log.Println(db_view, "err", er2)

23 }

24 stmt.Close()

25 connect.Close()

26

27 //***** clear mem for gc ******

28 stmt = nil

29 tx = nil

30 connect = nil

31 //////////////////////////////////////////////////////////////////////////////////
5) Publish the modified code, observe it, and find that the system memory can be recycled and released normally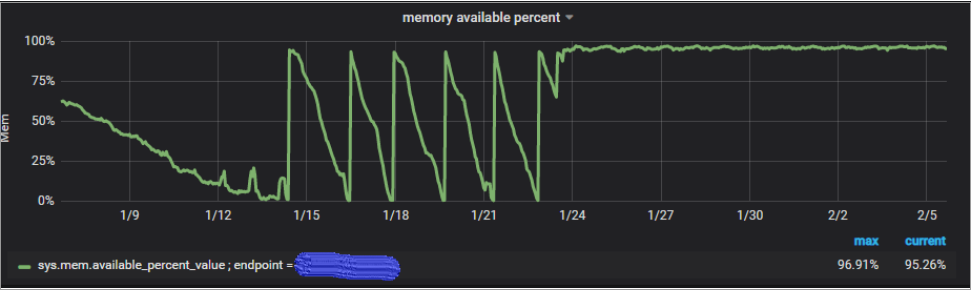
[Conclusion]
After this Go golang debugging, the real reason is that the gc memory is not released in time, and there is lag (observed by other servers, memory can be released normally when the pressure is low).
So the best practice is to inform GC that I really no longer use the memory block when it comes to golang using large objects or creating memory frequently by setting the object obj = nil so that GC can quickly recycle and reduce iteration gc.
In addition, this approach can be applied to languages such as java, c#, and they all have similar problems.