Reshaping DataFrame is an important and essential skill in data science. In this article, we will explore Pandas Melt() and how to use it for data processing.
The simplest melt
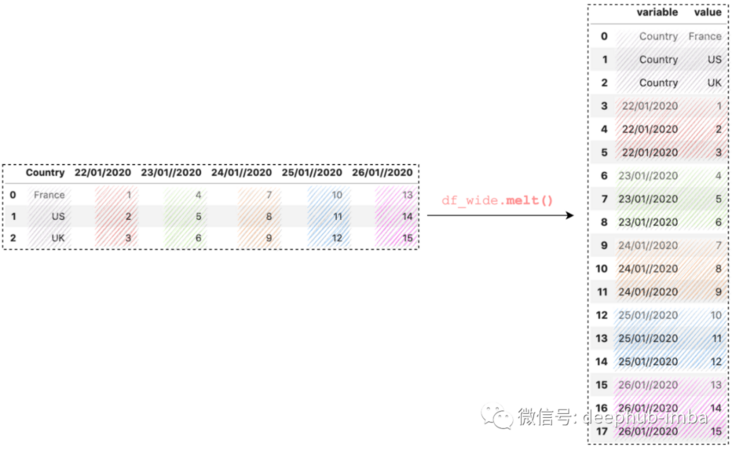
The simplest melt() does not require any parameters. It turns all columns into rows (displayed as column variables) and lists all associated values in the new column values.
df_wide.melt()
This output usually doesn't make much sense, so the general use case at least specifies the id_vars parameter. For example, id_vars = 'Country' tells pandas to keep Country as one column and convert all other columns to rows.
df_wide.melt(
    id_vars='Country',
)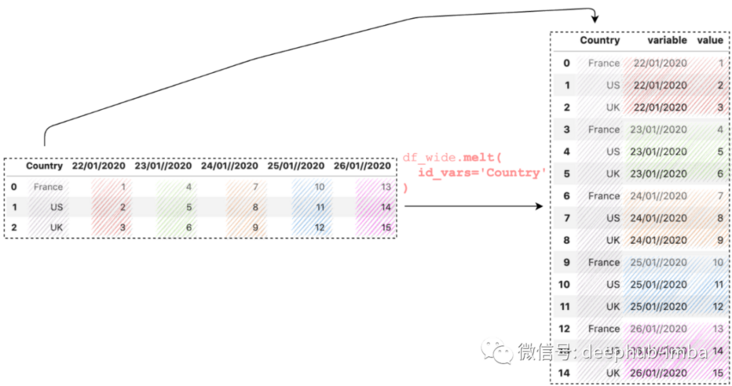
Now the number of rows is 15, because each value in the Country column has five values (3 X 5 = 15).
Display custom name
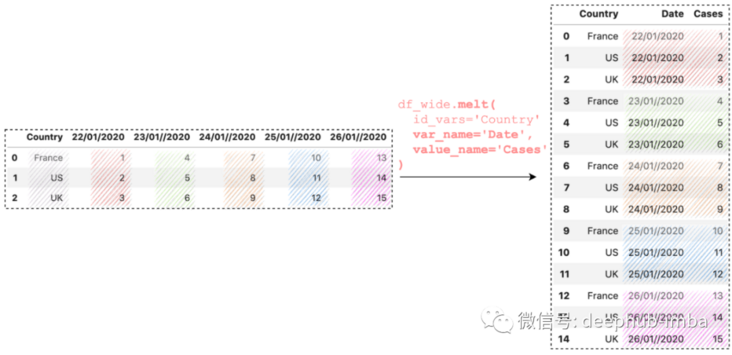
Variables and values are column names. We can use var_name and value_ The name parameter specifies a custom name:
df_wide.melt(
    id_vars='Country',
    var_name='Date',
    value_name='Cases'
)
Specify multiple ID S
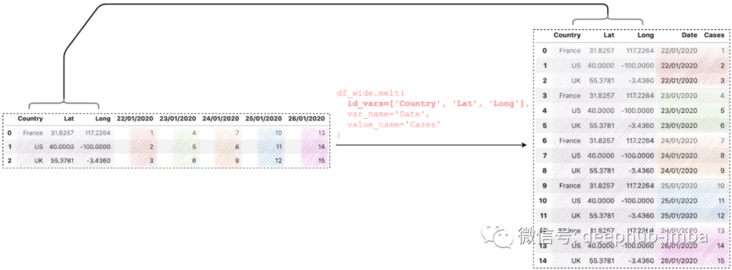
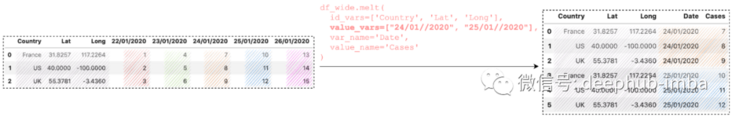
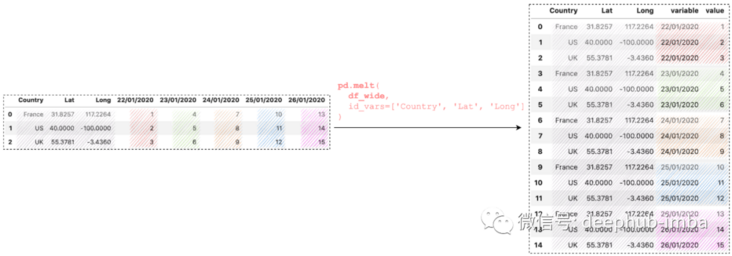
One of the most useful features of Melt() is that we can specify multiple IDs to keep them as columns. For example, if we want to keep Country, Lat, and Long as columns for better reference:
df_wide.melt(
    id_vars=['Country', 'Lat', 'Long'],
    var_name='Date',
    value_name='Cases'
)
Specifies the column for the melt
Pandas's melt() function converts all other columns (except those specified in id_vars) to rows by default. If we only want to view the actual values of "01 / 2020" and "25 / 2020", for example:
df_wide.melt(
    id_vars=['Country', 'Lat', 'Long'],
    value_vars=["24/01//2020", "25/01//2020"],
    var_name='Date',
    value_name='Cases'
)
Pandas melt
We can also call melt() directly from the Pandas module instead of from the DataFrame. But these are the same.
Reshaping COVID-19 time series data
With what we have learned so far, let's take a look at a real-world problem: COVID-19 time series data provided by CSSE Github of Johns Hopkins University.
There are two questions:
- Confirmation, death and recovery are saved in different CSV files. It's not easy to draw them in one picture.
- The dates are displayed as column names, which make it difficult to perform daily calculations, such as new cases, new deaths and new rehabilitation per day.
Let's reshape three datasets and merge them into one DataFrame.
Read dataset
confirmed_df = pd
    .read_csv('time_series_covid19_confirmed_global.csv')
deaths_df = pd
    .read_csv('time_series_covid19_deaths_global.csv')
recovered_df = pd
    .read_csv('time_series_covid19_recovered_global.csv')
Transform them from a wide format to a long format
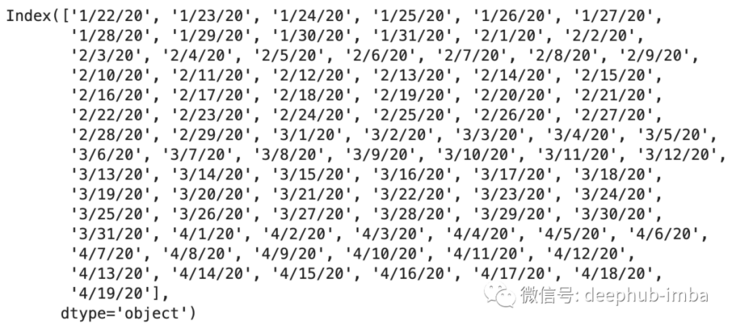
By running confirmed_df.columns,deaths_df.columns and recovered_df.columns, they should all output the same results as follows:
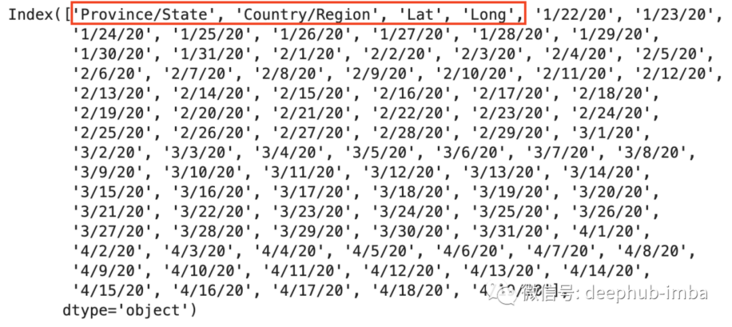
Note that columns are dates starting from column 4, and get a list of confirmed dates DF columns [4:]
Before merging, we need to use melt() to reverse perspective the DataFrames from the current wide format to the long format. In other words, we convert all date columns to values. Use province / state, country / region, latitude and longitude as identifier variables. We'll merge them later.
confirmed_df_long = confirmed_df.melt(
id_vars=['Province/State', 'Country/Region', 'Lat', 'Long'],
value_vars=dates,
var_name='Date',
value_name='Confirmed'
)
deaths_df_long = deaths_df.melt(
id_vars=['Province/State', 'Country/Region', 'Lat', 'Long'],
value_vars=dates,
var_name='Date',
value_name='Deaths'
)
recovered_df_long = recovered_df.melt(
id_vars=['Province/State', 'Country/Region', 'Lat', 'Long'],
value_vars=dates,
var_name='Date',
value_name='Recovered'
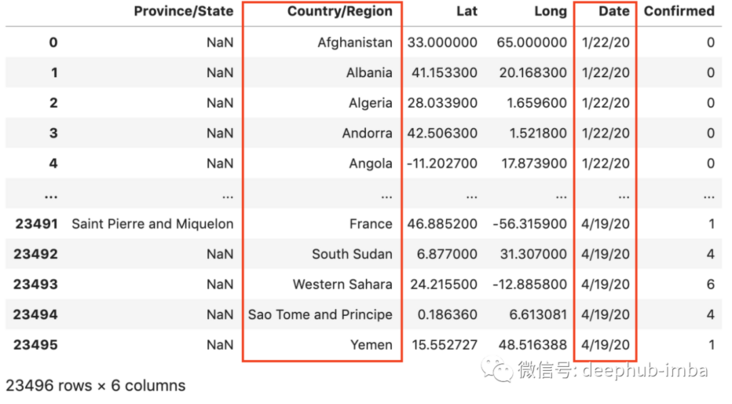
)All results are in the new long format. All of these are sorted by date and country because the original data is sorted by country and the date columns are sorted in ASC order.
This is confirmed_df_long example
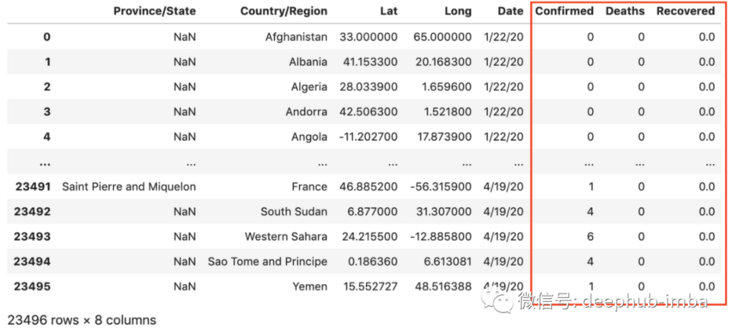
Finally, we use merge() to merge the three dataframes one by one:
full_table = confirmed_df_long.merge(
  right=deaths_df_long,
  how='left',
  on=['Province/State', 'Country/Region', 'Date', 'Lat', 'Long']
)

full_table = full_table.merge(
  right=recovered_df_long,
  how='left',
  on=['Province/State', 'Country/Region', 'Date', 'Lat', 'Long']
)
Now we have a complete table with Confirmed, Deaths, and Recovered columns:
summary
In this article, we introduced five use cases and a practical example that used Pandas's melt() method to reshape the DataFrame from a wide format to a long format. It is very convenient and is one of the most popular methods in data preprocessing and exploratory data analysis.
Reshaping data is an important and essential skill in data science. I hope you like this article and learn something new and useful.
Article code: https://github.com/BindiChen/...
Author: B. Chen