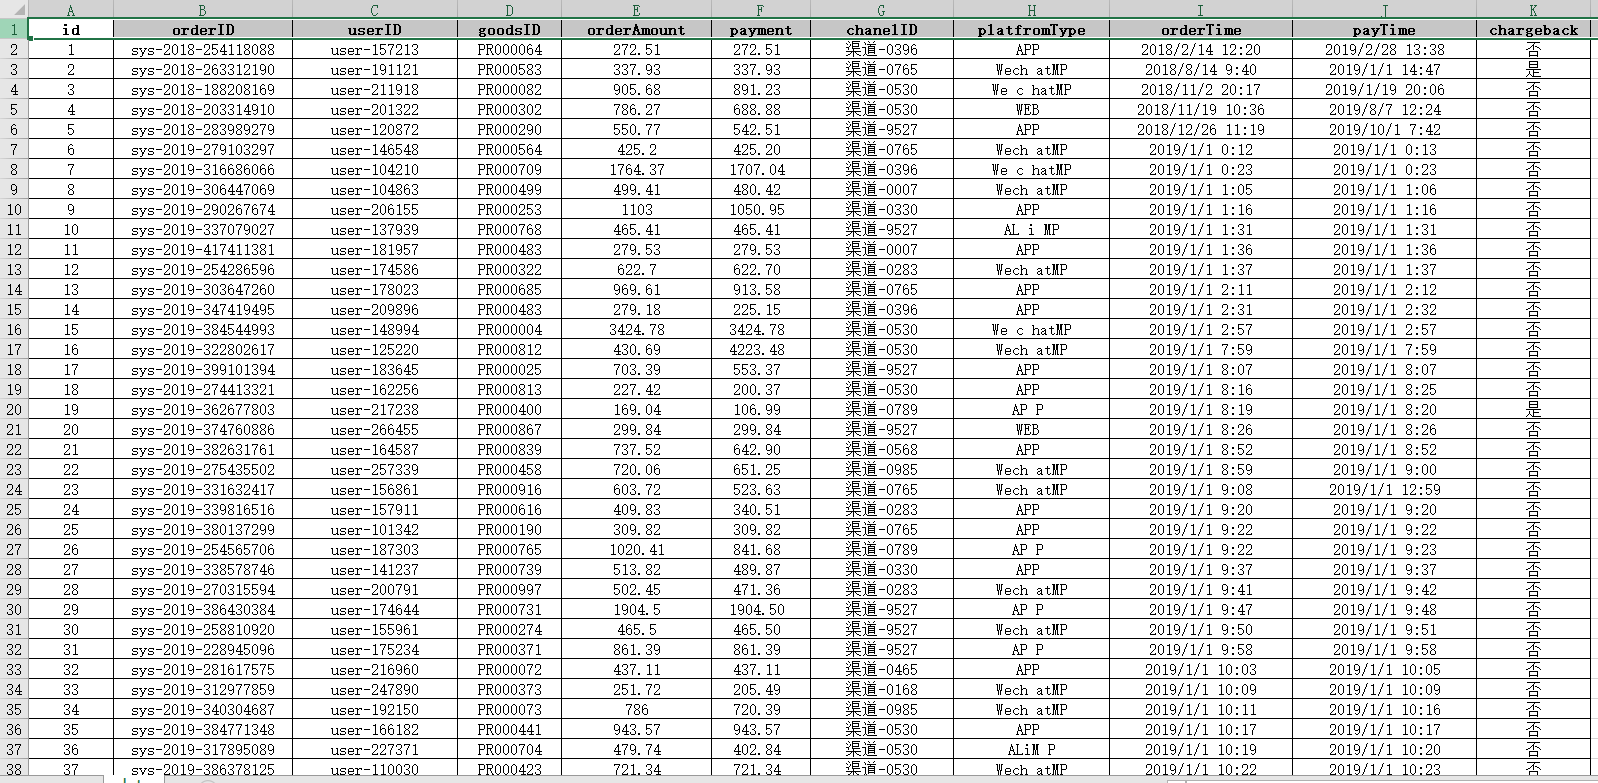
Raw data set
python code
Edit with Jupiter notebook
import pandas as pd
import matplotlib.pyplot as plt
plt.rcParams['font.sans-serif']=['SimHei']
data = pd.read_excel(r'E:\a business\Data center station\E-commerce cases\Download source data\order.xlsx')
data.info()
data.sample(10)
Operation results:
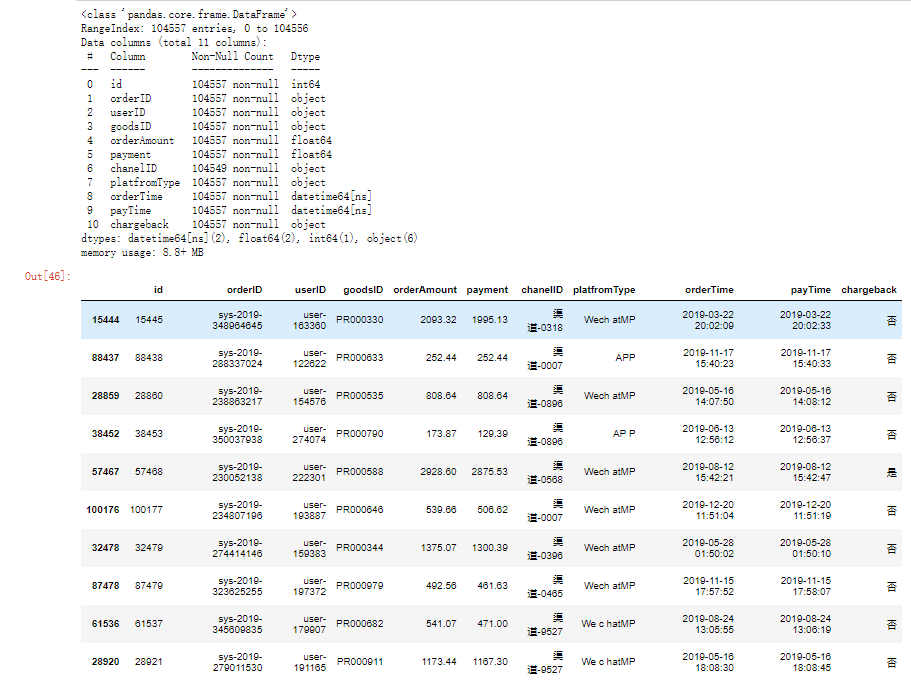
It can be seen from the observation that only the missing value in the changelid column indicates that someone directly enters the platform to place an order without channel recommendation. The missing value does not affect the analysis results, so it will not be handled temporarily. There are meaningless spaces in the purchase channel, which should be removed:
data['platfromType'] = [i.replace(' ','') for i in data['platfromType']]Extract the date from the order payment time to facilitate subsequent sales calculation:
data['payDate'] = data['payTime'].dt.date
data['payDate'] = pd.to_datetime(data['payDate'])

# At the same time, the "days" column is added for subsequent auxiliary calculation of "R" indicators
data['days'] = (pd.to_datetime('today') - data['payDate']).dt.days
1. Sales volume analysis
All transactions are calculated based on the final profit. Therefore, considering the refund, the actual payment amount of the buyer is summed for the existing orders according to the order payment time. Due to the large time span of data, statistics are carried out in monthly units
data_not_chargeback = data[data.chargeback=='no']
df = data_not_chargeback.groupby(pd.Grouper(key='payDate',freq='M'))['payment'].sum()
x =[f'{y}year{m}month' for y,m in zip(df.index.year, df.index.month)]
plt.figure(figsize=(16,9),dpi=160)
plt.plot(range(len(x)), df)
plt.text(0,df.max(),f'Total sales{round(df.sum(),2)}element',fontsize=20)
plt.xticks(range(len(x)), x, rotation=45)
for x,y in zip(range(len(x)),df.values):
     plt.text(x, y+7000,int(y),ha='center')   #Label data points
plt.ylabel('sales volume')
plt.xlabel('time')
plt.title('Monthly trend of sales',fontsize=25)
plt.show()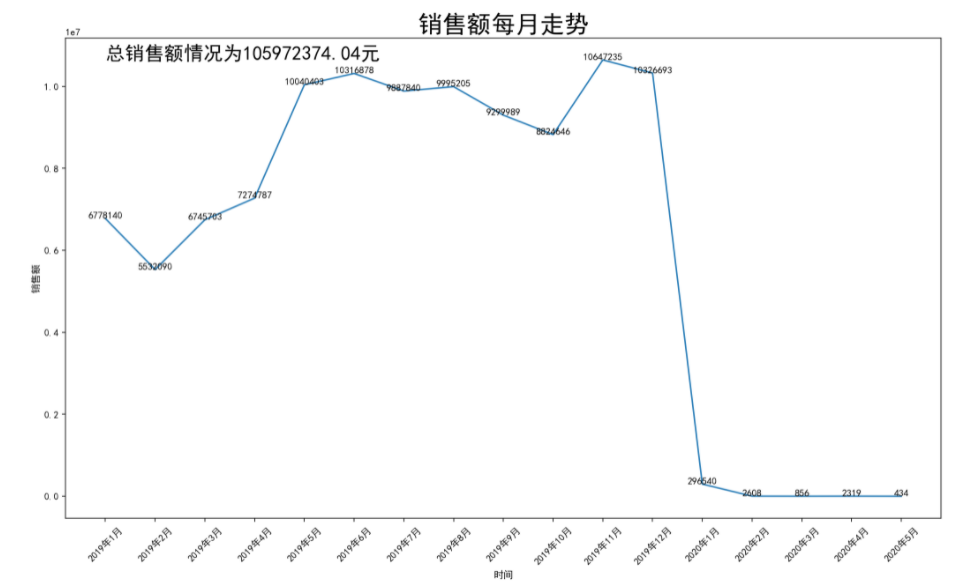
The following information can be obtained from the "monthly trend of sales":
- During the period from January 1, 2019 to May 28, 2020, the highest sales volume occurs in the month of "double 11" activity - November, with sales reaching 10.64 million, accounting for 10.08% of the total sales volume in 2019
- There was a significant decline from January to February, and it began to rise rapidly in March. It reached a small peak in May, and then it was in the peak period. It fell back to a certain extent in October. Then, the month of double 11 and double 12 ushered in the annual peak. After entering 2020, due to the impact of the epidemic, it quickly fell to the bottom and continued to be depressed. Until May, the sales volume was only 434 yuan
# Carry out sales statistics according to commodity categories and find out the top ten best commodities sold in actual transactions
hot_10 = pd.DataFrame({
    'sales volume':data['payment'].value_counts(),
    'Actual sales volume':data_not_chargeback['payment'].value_counts()
}).sort_values(by='sales volume', ascending=False)
hot_10['Proportion of total sales(%)'] = hot_10['sales volume'].apply(lambda x : round((x/hot_10['sales volume'].sum())*100,2))
hot_10['Actual sales'] = data_not_chargeback.groupby(by='orderAmount')['payment'].sum()
hot_10['Proportion of sales(%)']=hot_10['Actual sales'].apply(lambda x : round((x/hot_10['Actual sales'].sum())*100,2))
print(f'{"-"*20}Top 10{"-"*20}')
print(hot_10.head(10))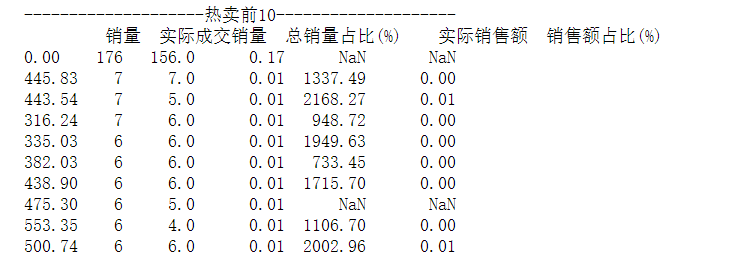
# Make sales statistics according to purchase channels
saleChannel = data_not_chargeback.groupby(pd.Grouper(key='platfromType'))['payment'].sum()
x_ = list(saleChannel.index)
plt.figure(figsize=(16,9),dpi=160)
plt.bar(range(len(x_)), height=saleChannel, width=0.5)
plt.xticks(range(len(x_)), x_, rotation=45)
for x,y in zip(range(len(x_)),saleChannel.values):
     plt.text(x, y+8000,int(y),ha='center')   #Label data points
plt.ylabel('sales volume')
plt.xlabel('Purchase channel')
plt.title('Sales by purchase channel',fontsize=25)
plt.show()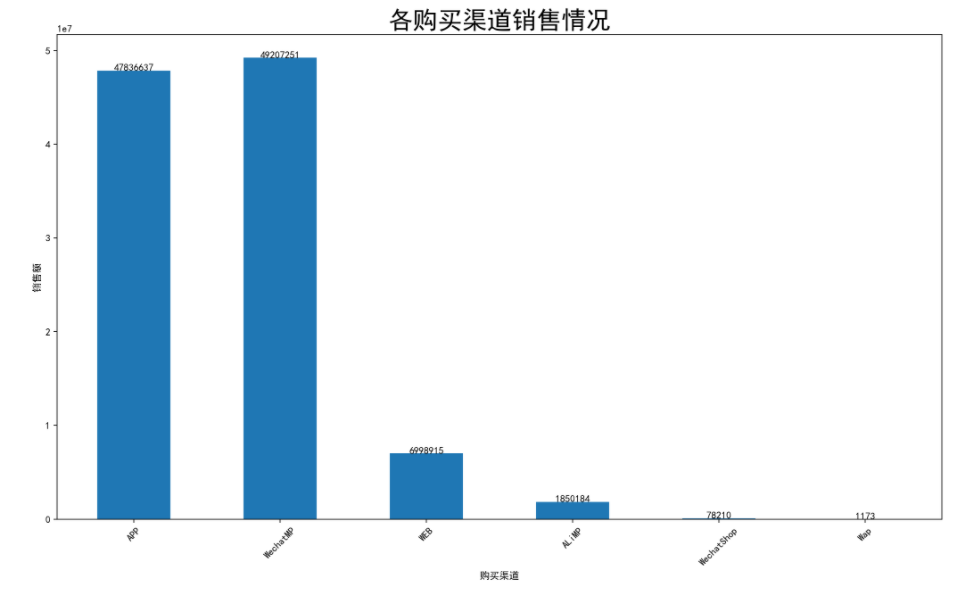
From the above, we can see that the users purchased mainly through the WechatMP WeChat official account platform and APP, followed by the web page version, and then the Ali platform, WeChat store and wap are the lowest number of chargeback field values.
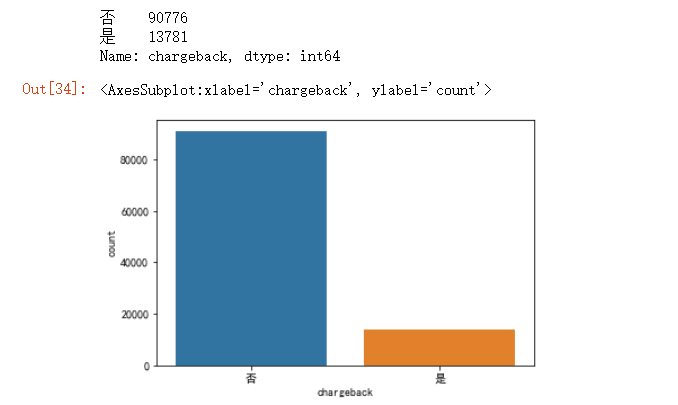
import seaborn as sns
print(data['chargeback'].value_counts())
sns.countplot(x='chargeback', data=data)
# Conversion rate
from pyecharts.charts import Funnel
from pyecharts import options as opts

# All customers in this dataset have payment and purchase behavior, but there is partial refund behavior after payment. Therefore, the actual transaction is indicated only when the value of chargeback field is "no"
rates = pd.Series({
    'establish':data['orderTime'].count(),
    'payment':data['payTime'].count(),
    'Actual transaction':data[data.chargeback=='no'].shape[0]
},name='Order quantity').to_frame()

# Absolute conversion rate = number of orders in each phase / number of orders created
rates['Overall conversion'] = rates['Order quantity'].apply(lambda x: round(x*100/rates.iloc[0,0],3))
print(rates)

c=(
    Funnel()
    .add(
        'Conversion rate',
        [list(z) for z in zip(rates.index,rates['Overall conversion'])],
        # Set label position and data display form
        label_opts=opts.LabelOpts(position='inside',formatter='{b}:{c}')
    )  # Filling funnel chart content
    .set_global_opts(title_opts=opts.TitleOpts(title='Overall conversion(%)'))
)
c.render_notebook() 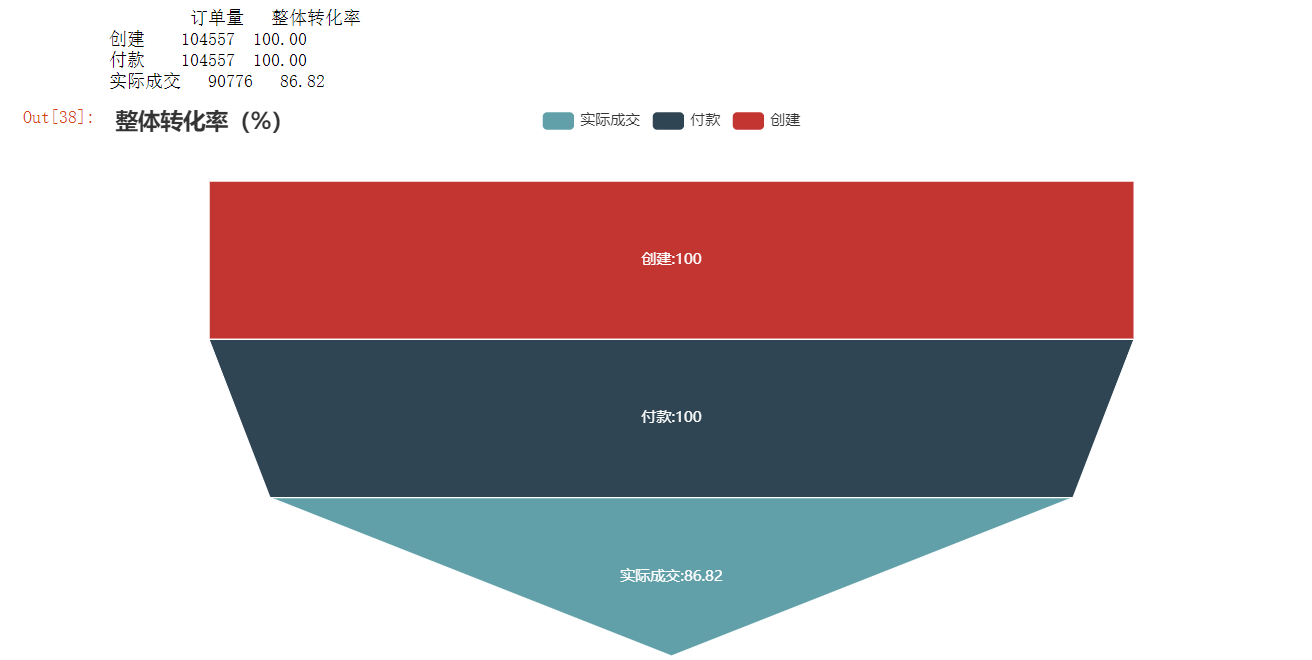
From the "overall conversion rate", it can be seen that the overall conversion rate of users is still high, and the actual transaction conversion rate reaches 86.82%. It is necessary to continue to keep a summary: the activities of double 11 and double 12 are very effective. In the future, we can use more holidays to copy the promotion activities of double 11 and double 12 to increase sales; And then targeted shop design and channel promotion for web pages and Ali platforms. Meanwhile, the two popular shopping channels from WechatMP WeChat official account platform and APP were welcomed by users. Targeted shopping channels and user behavior path analysis and page evaluation can be targeted.
2. Analysis of user purchase times
# Draw the distribution frequency diagram of user purchase times
user_buy_time = data[data.chargeback=='no'].groupby('userID').count()['goodsID']
plt.hist(x=user_buy_time, bins=10, range=[0,100])
plt.xlabel('buy_time')
plt.ylabel('user_num')
plt.title('user_buy_time')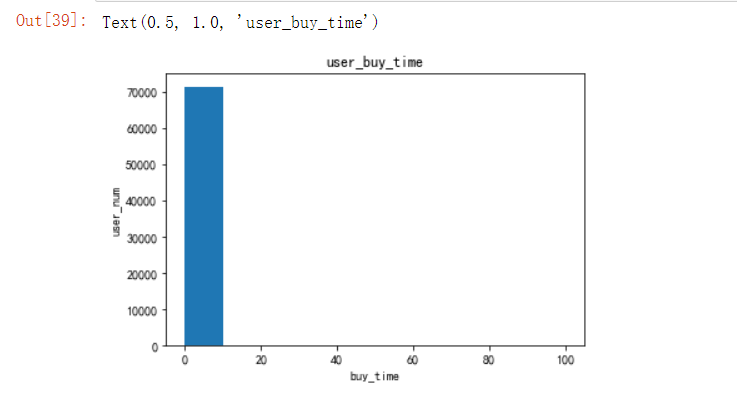
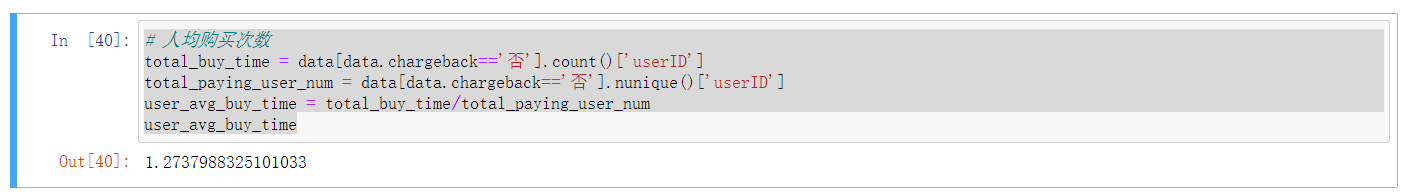
# Number of purchases per capita
total_buy_time = data[data.chargeback=='no'].count()['userID']
total_paying_user_num = data[data.chargeback=='no'].nunique()['userID']
user_avg_buy_time = total_buy_time/total_paying_user_num
user_avg_buy_time
# Repurchase rate = number of people who have purchased twice or more / number of people who have purchased
user_buy_time = data[data.chargeback=='no'].groupby('userID').count()
user_twice_time = user_buy_time[user_buy_time['goodsID']>2].count()['goodsID']
user_buy = data[data.chargeback=='no'].nunique()['userID']
rebuy_rate = user_twice_time/user_buy
rebuy_rate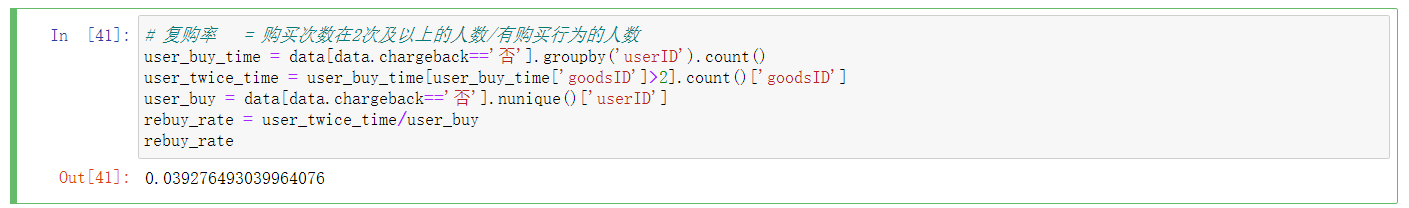
Observations:
It can be seen from the distribution frequency chart of user purchase times that all users who successfully complete this transaction (payment is successful and no refund) have a transaction frequency of less than 10 times; The number of purchases per user is 1, and the repurchase rate is only 3.93%
Summary:
Based on the above results, the e-commerce platform is basically a one-time transaction, and the repurchase rate of paying users is very low, so we need to find ways to cultivate a group of loyal users; Combined with the frequency chart of user purchase times, all paying users of the platform have only a transaction frequency of less than 10 times. It is necessary to vigorously tap the purchasing power of these customers and launch targeted marketing solutions
3. Use RFM model to classify user value
1) Calculate three indicators of RFM
# Establish a PivotTable and calculate the three indicators of RFM
df2 = data_not_chargeback.pivot_table(index="userID",
                    values=["orderID", "days", "payment"],
                    aggfunc={"orderID":"count", "days":"min", "payment":"sum"})
df2 = df2[['days', 'orderID', 'payment']]
df2.columns = ['R', 'F', 'M']
df2.reset_index()
df2.head(10)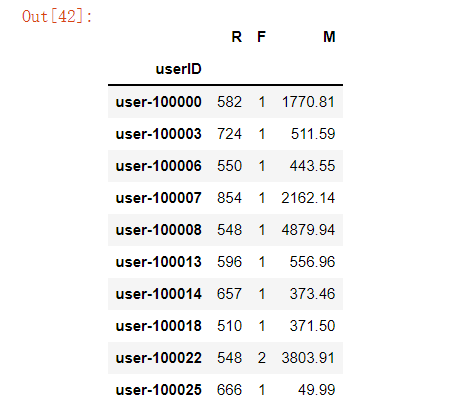
2) Label users
# Score the three indicators of RFM respectively
avg_r = df2['R'].mean()
avg_f = df2['F'].mean()
avg_m = df2['M'].mean()

df2['R_score'] = [0 if i>avg_r else 1 for i in df2['R']]
df2['F_score'] = [1 if i>avg_f else 0 for i in df2['F']]
df2['M_score'] = [1 if i>avg_m else 0 for i in df2['M']]

# Label users
def functions(x):
    if x.iloc[0]==1 and x.iloc[1]==1 and x.iloc[2]==1:
        return "Important value customers"
    elif x.iloc[0]==1 and x.iloc[1]==1 and x.iloc[2]==0:
        return "Potential customers"
    elif x.iloc[0]==1 and x.iloc[1]==0 and x.iloc[2]==1:
        return "Important deep ploughing customers"
    elif x.iloc[0]==1 and x.iloc[1]==0 and x.iloc[2]==0:
        return "New customers"
    elif x.iloc[0]==0 and x.iloc[1]==1 and x.iloc[2]==1:
        return "Important call back customers"
    elif x.iloc[0]==0 and x.iloc[1]==1 and x.iloc[2]==0:
        return "General customers"
    elif x.iloc[0]==0 and x.iloc[1]==0 and x.iloc[2]==1:
        return "Important customer recovery"
    elif x.iloc[0]==0 and x.iloc[1]==0 and x.iloc[2]==0:
        return "Lost customers"

df2['label'] = df2[['R_score', 'F_score', 'M_score']].apply(functions,axis=1)
df2.sample(10)
# df2.to_csv(r'E:\a business \ data center \ e-commerce case \ download source data \ user_rfm.csv ')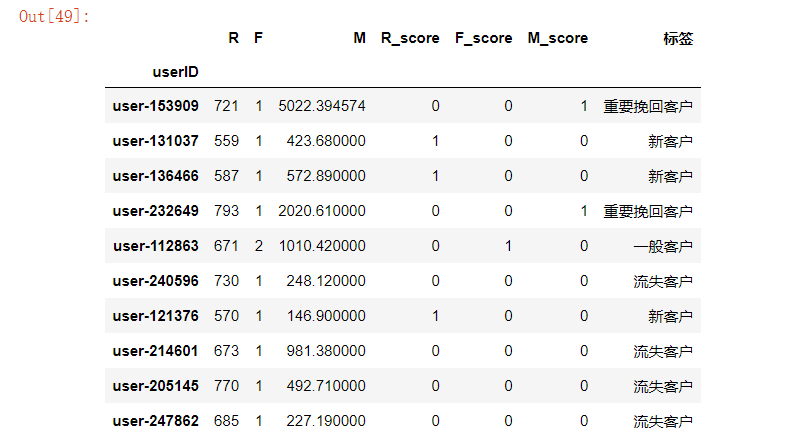
# Draw a comparison chart of the number of different types of customers
import numpy as np
df3 = df2.groupby("label").agg({"label":"count"})
df3['Proportion of different customers'] = df3["label"].apply(lambda x:x/np.sum(df3["label"]))
df3.index.name = 'Customer label'
df3 = df3.sort_values(by="label", ascending=True)
plt.figure(figsize=(6,4), dpi=100)
x = df3.index
y = df3['label']
plt.barh(x, height=0.5, width=y, align='center')
plt.title('Comparison of different types of customers')
for x,y in enumerate(y):
    plt.text(y+450, x, y, va='center', fontsize=14)
plt.xticks(np.arange(0,30001,2000), rotation=45)

plt.tight_layout()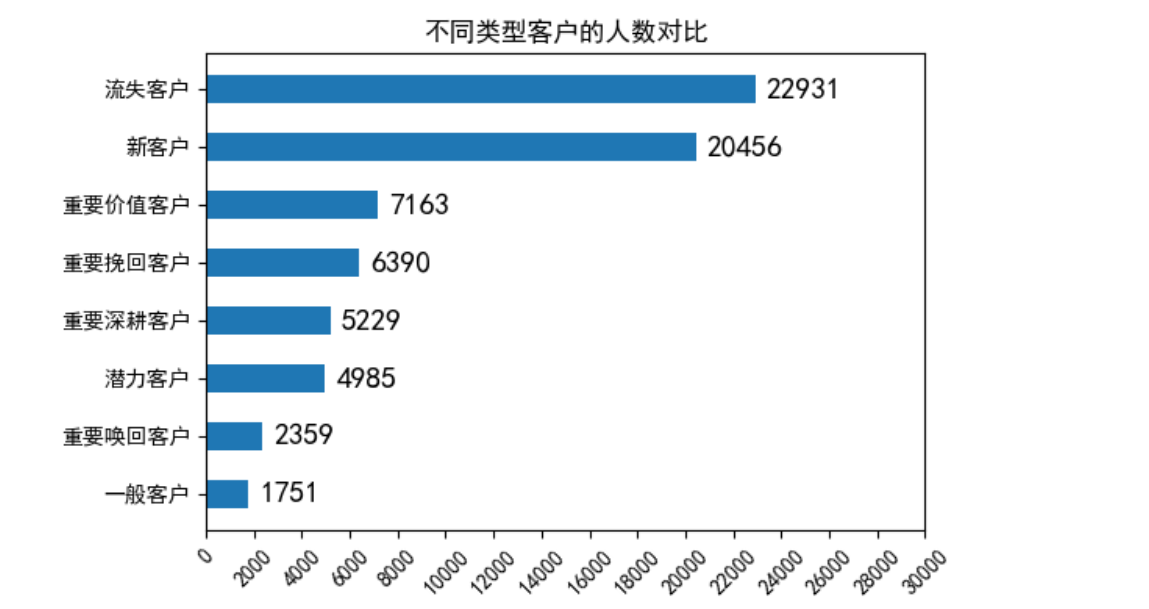
# Draw cumulative consumption amount of different types of customers
df3 = df2.groupby("label").agg({"M":"sum"})
df3["M"] = df3["M"].apply(lambda x:round(x))
df3["Proportion of different customers"] = df3["M"].apply(lambda x:x/np.sum(df3["M"]))
df3 = df3.sort_values(by="M",ascending=True)
plt.figure(figsize=(6,4),dpi=100)
x = df3.index
y = df3["M"]
plt.barh(x,height=0.5,width=y,align="center")
plt.title("Cumulative consumption amount of different types of customers")
for x,y in enumerate(y):
    plt.text(y+500,x,y,va="center",fontsize=14)

plt.tight_layout()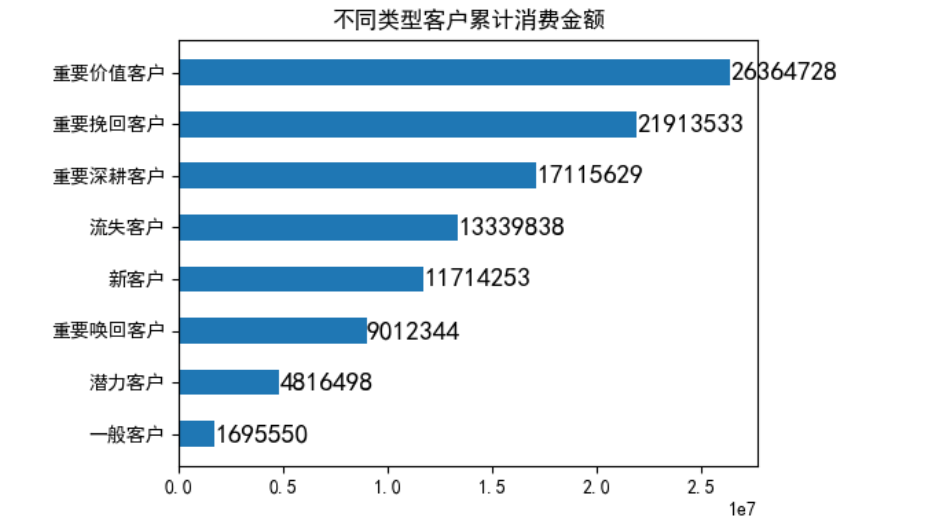
Key value users are the most important group, but the number accounts for only 7163 in the total customer group, while the platform accounts for a large proportion of lost customers. We should consider the positioning of our own products and properly send questionnaires to analyze the loss of lost customers. At the same time, new customers also account for a large proportion. We should do a good job in new customer guidance and service, and strive to convert new customers into more valuable and important customers. Put forward targeted operation suggestions for the above customer groups:
- Important value users: invest in farming resources, provide vip services and personalized services, and continue to guide their consumption while maintaining their stickiness
- Potential customers: these customers need to dig deep into them, sell some products with higher value, ask them for comments, find out their demands and pain points according to the comments, and attract them
- Important deep ploughing users: send promotion reminders and coupons to them from time to time
- New users: organize community activities, provide free trial or lucky draw of small samples in the group from time to time, and get large coupons when the number of new users reaches a certain number, so as to improve user interest and create brand awareness
- Important exchange for users: precision marketing provides users with goods they may be concerned about or interested in according to user portraits, and wins them back by continuing to close stores or producing more attractive products
- Ordinary users: they can punch in the store every day to get points, which can be exchanged for popular product samples or in store lucky draw to keep them paying attention to the store
- Important recovery of users: focus on return visits, ask targeted questions about the possible reasons why users will no longer buy, and re market to customers on this basis, such as answering service attitude and appeasing; If you answered that the product quality has been improved, please try again and send a sample, etc
- Lost customers: try to restore their interest, and contact customers for research to find out the main reasons for the loss of customers.
It is not original, and the content and code come from the brief book: E-commerce data analysis (RFM) - Jianshu (jianshu.com)
The original dataset can be downloaded in the and whale community: Dataset - heywhale com