Metrics is a Java class library that provides service performance testing tools. It provides a powerful performance indicator tool library to measure the performance of key components in the production environment.
Measurement type
Metrics provides the following basic measurement types:
- Gauge: used to provide custom metrics.
- Counter: counter, which is essentially a Java util. concurrent. atomic. LongAdder.
- Histogram: histogram data.
- Meter: statistics the response rate of an event in the system, such as TPS and QPS. This index value directly reflects the current processing capacity of the system
- Timer: timer is a combination of Meter and Histogram, which can count the interface request rate and response time.
Gauge
Gauge is an instantaneous measure of a value. We can customize metrics according to business scenarios by implementing the gauge interface.
For example, you want to measure the number of jobs waiting in the queue:
public class QueueManager {
    private final Queue queue;

    public QueueManager(MetricRegistry metrics, String name) {
        this.queue = new Queue();
        // Register Gauge metrics through the register method of MetricRegistry
        metrics.register(MetricRegistry.name(QueueManager.class, name, "size"),
                         new Gauge<Integer>() {
                             @Override
                             public Integer getValue() {
                                 return queue.size();
                             }
                         });
    }
}
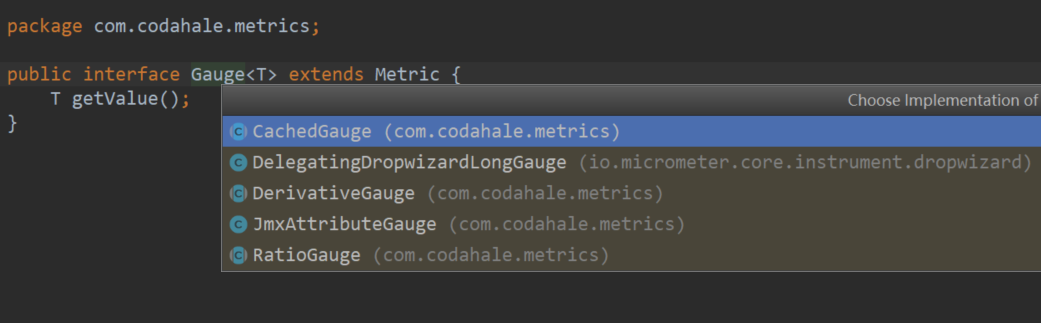
The official currently provides the following Gauge implementations:
Counter
Counter is a general counter used to accumulate or decrement an indicator value.
Counter is essentially a Java util. concurrent. atomic. LongAdder, in the scenario where multiple threads update counters at the same time, when the concurrency is large, LongAdder has higher throughput than AtomicLong, and of course, the consumption of space resources is also greater.
final Counter evictions = registry.counter(name(SessionStore.class, "cache-evictions"));
evictions.inc();
evictions.inc(3);
evictions.dec();
evictions.dec(2);
Histograms
Histogram reflects the distribution of values in the data stream. It includes the data distribution of minimum, maximum, average, median, p75, p90, p95, p98, p99 and p999.
private final Histogram responseSizes = metrics.histogram(name(RequestHandler.class, "response-sizes"));

public void handleRequest(Request request, Response response) {
    // etc
    responseSizes.update(response.getContent().length);
}
Histogram calculates the quantile by sorting the entire data set first, and then taking the value of a specific position in the sorted data set (for example, p99 takes the value of the reverse 1% position). This method is suitable for small data sets or batch processing systems, and is not suitable for services requiring high throughput and low delay.
For scenarios with large amount of data and high system throughput and delay requirements, we can obtain data by sampling. By dynamically extracting a small part of data that can represent the real operation of the system in the process of program operation, the approximate measurement of the operation index of the whole system is realized. This method is called reservoir sampling.
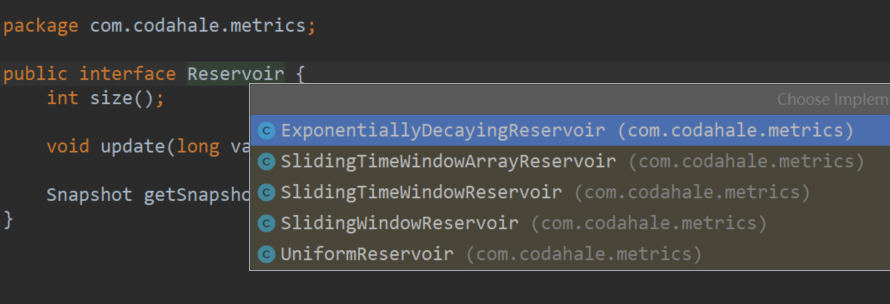
Various Reservoir implementations are available in Metrics:
Meter
Meter is used to measure the average rate of event response. It represents the total rate (total request response / total milliseconds of processing requests, i.e. requests per second) in the whole operation life cycle of the application.
In addition, Meter provides dynamic average response rates of 1 minute, 5 minutes and 15 minutes.
final Meter getRequests = registry.meter(name(WebProxy.class, "get-requests", "requests"));
getRequests.mark();
getRequests.mark(requests.size());
Timer
Timer will measure the response rate of the service and the distribution of service response time.
final Timer timer = registry.timer(name(WebProxy.class, "get-requests"));

final Timer.Context context = timer.time();
try {
    // handle request
} finally {
    context.stop();
}
Reporters
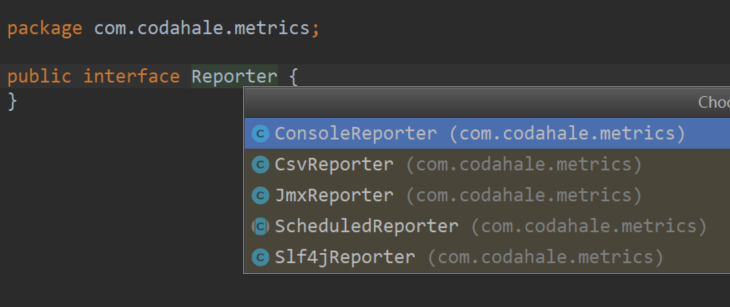
After monitoring the service indicators through the above measurements, we can export the measurement results through the Reporters Report. The metrics core module implements the following reports for exporting indicators:
Console Reporters
Regularly send the indicator data of the service to the console.
final ConsoleReporter reporter = ConsoleReporter.forRegistry(registry)
                                                .convertRatesTo(TimeUnit.SECONDS)
                                                .convertDurationsTo(TimeUnit.MILLISECONDS)
                                                .build();
reporter.start(1, TimeUnit.MINUTES);
CsvReporter
To the specified directory on a regular basis The csv file appends the service index data. For each indicator, one will be created under the specified directory csv file, and then regularly (1s in this example) append the latest index data to each file.
final CsvReporter reporter = CsvReporter.forRegistry(registry)
                                        .formatFor(Locale.US)
                                        .convertRatesTo(TimeUnit.SECONDS)
                                        .convertDurationsTo(TimeUnit.MILLISECONDS)
                                        .build(new File("~/projects/data/"));
reporter.start(1, TimeUnit.SECONDS);
JmxReporter
After exposing the service metrics through JMX MBeans, you can use VisualVM to view the metrics data. Not recommended for production environments.
final JmxReporter reporter = JmxReporter.forRegistry(registry).build();
reporter.start();
Slf4jReporter
Slf4jReporter allows us to log the indicator data of the service into the log file.
final Slf4jReporter reporter = Slf4jReporter.forRegistry(registry)
                                            .outputTo(LoggerFactory.getLogger("com.example.metrics"))
                                            .convertRatesTo(TimeUnit.SECONDS)
                                            .convertDurationsTo(TimeUnit.MILLISECONDS)
                                            .build();
reporter.start(1, TimeUnit.MINUTES);
How to use
Direct reference
Directly rely on the core library of Metrics to measure service indicator data through various API s provided by Metrics.
- Introduce Maven dependency
<dependency>
  <groupId>io.dropwizard.metrics</groupId>
  <artifactId>metrics-core</artifactId>
  <version>${metrics.version}</version>
</dependency>
- Create a MetricRegistry object, which is the core class of the Metrics class library. All application indicators need to be registered in MetricRegistry.
// Instantiate MetricsRegistry
final MetricRegistry metrics = new MetricRegistry();

// Open Console Reporter
startConsoleReporter();

Meter requests = metrics.meter(name(MetricsConfig.class, "requests", "size"));
requests.mark();

void startReport() {
    ConsoleReporter reporter = ConsoleReporter.forRegistry(metrics)
            .convertRatesTo(TimeUnit.SECONDS)
            .convertDurationsTo(TimeUnit.MILLISECONDS)
            .build();
    reporter.start(1, TimeUnit.SECONDS);
}
Integrate Spring
- Introduce Maven dependency
<dependency>
    <groupId>com.ryantenney.metrics</groupId>
    <artifactId>metrics-spring</artifactId>
    <version>3.1.3</version>
</dependency>
- Configure Metrics through Java annotations.
import java.util.concurrent.TimeUnit;
import org.springframework.context.annotation.Configuration;
import com.codahale.metrics.ConsoleReporter;
import com.codahale.metrics.MetricRegistry;
import com.codahale.metrics.SharedMetricRegistries;
import com.ryantenney.metrics.spring.config.annotation.EnableMetrics;
import com.ryantenney.metrics.spring.config.annotation.MetricsConfigurerAdapter;

@Configuration
@EnableMetrics
public class SpringConfiguringClass extends MetricsConfigurerAdapter {

    @Override
    public void configureReporters(MetricRegistry metricRegistry) {
        // registerReporter allows the MetricsConfigurerAdapter to
        // shut down the reporter when the Spring context is closed
        registerReporter(ConsoleReporter
            .forRegistry(metricRegistry)
            .build())
            .start(1, TimeUnit.MINUTES);
    }

}


@Target({ElementType.TYPE})
@Retention(RetentionPolicy.RUNTIME)
@Documented
@Import({DelegatingMetricsConfiguration.class})
public @interface EnableMetrics {
    // The default value of false indicates that JDK dynamic proxy is used. When set to true, CGLIB dynamic proxy is used (when class based service exposure is used)
    boolean exposeProxy() default false;
    // When set to true, the target object can pass aopcontext Currentproxy() accesses the proxy that encapsulates it
    boolean proxyTargetClass() default false;
}
Use restrictions
In Spring AOP, only methods declared as public can be proxied, so @ Timed, @Metered, @ExceptionMetered and @ Counted cannot take effect in non public.
Because the @ Gauge annotation does not involve proxies, it can be applied to non public properties and methods.
public class MetricsBeanPostProcessorFactory {
    private MetricsBeanPostProcessorFactory() {
    }

    public static AdvisingBeanPostProcessor exceptionMetered(MetricRegistry metricRegistry, ProxyConfig proxyConfig) {
        return new AdvisingBeanPostProcessor(ExceptionMeteredMethodInterceptor.POINTCUT, ExceptionMeteredMethodInterceptor.adviceFactory(metricRegistry), proxyConfig);
    }

    public static AdvisingBeanPostProcessor metered(MetricRegistry metricRegistry, ProxyConfig proxyConfig) {
        return new AdvisingBeanPostProcessor(MeteredMethodInterceptor.POINTCUT, MeteredMethodInterceptor.adviceFactory(metricRegistry), proxyConfig);
    }

    public static AdvisingBeanPostProcessor timed(MetricRegistry metricRegistry, ProxyConfig proxyConfig) {
        return new AdvisingBeanPostProcessor(TimedMethodInterceptor.POINTCUT, TimedMethodInterceptor.adviceFactory(metricRegistry), proxyConfig);
    }

    public static AdvisingBeanPostProcessor counted(MetricRegistry metricRegistry, ProxyConfig proxyConfig) {
        return new AdvisingBeanPostProcessor(CountedMethodInterceptor.POINTCUT, CountedMethodInterceptor.adviceFactory(metricRegistry), proxyConfig);
    }

    public static GaugeFieldAnnotationBeanPostProcessor gaugeField(MetricRegistry metricRegistry) {
        return new GaugeFieldAnnotationBeanPostProcessor(metricRegistry);
    }

    public static GaugeMethodAnnotationBeanPostProcessor gaugeMethod(MetricRegistry metricRegistry) {
        return new GaugeMethodAnnotationBeanPostProcessor(metricRegistry);
    }

    public static CachedGaugeAnnotationBeanPostProcessor cachedGauge(MetricRegistry metricRegistry) {
        return new CachedGaugeAnnotationBeanPostProcessor(metricRegistry);
    }

    public static MetricAnnotationBeanPostProcessor metric(MetricRegistry metricRegistry) {
        return new MetricAnnotationBeanPostProcessor(metricRegistry);
    }

    public static HealthCheckBeanPostProcessor healthCheck(HealthCheckRegistry healthRegistry) {
        return new HealthCheckBeanPostProcessor(healthRegistry);
    }
}
In addition, when another method with Metrics annotation is invoked in one method, the method execution process will not go through the proxy.