Since the author does not have a deep mathematical background or financial knowledge, he will not quote various advanced investment models or mathematical models in this paper. The reference books are mainly "Turtle Trading Rules" and "Make a living from trading".
trading system
Before trading, we should first have a trading system to guide our own trading, there may not be any specifications, but it can be used as a basis for trading. As to whether this basis is not feasible, it is wise to be unscientific.
Of course, the trading system here is not necessarily a program, but refers to your own trading principles or some techniques or methods that you follow. You can execute them manually or with the help of a programming language, which is not a set of tools to use.
This refers to the trading system contained in the Turtle Dealing Rules (this refers only to the general direction).
To establish a perfect trading system, we should think about at least six aspects.
- 1. Market - what to buy and sell
- 2. Position size - how much to buy or sell
- 3. Market Entry - When to Buy
- 4. Stop Loss - When to Exit Lost Position
- 5. Stop Earnings - When to Exit Profitable Position
- 6. Departure - When to Departure
Simple examples
- Buy and sell A shares
- Full warehouse
- Buy more than 3% higher that day.
- Close positions when losses exceed 3%
- Day fall greater than 3% or three consecutive negative lines
Analysis: This trading strategy can only profit if the market is in a wavy upward shape, but in the case of consolidation, it is feared that it will suffer a lot.The reason why this is so simple and rude is to test the code simplicity for later strategies.
Data Acquisition and Processing
Because what is said here is to use python stock speculation, so we should use a program to obtain data. If artificial stock speculation, downloading any stock quotation software is possible, but manual execution requires more effort.
python is best known for its library of stock quotation data.
Here's an example of Eurovision stocks.
python environment installation
Install Anaconda (python version 2)
Download address: https://www.anaconda.com/download/
Note: If you have no experience installing this environment, Baidu or Google will do it. If you do not install anaconda, it will be difficult to solve the dependencies on your own.
If you are still confused in the world of programming, you can join us in Python learning to deduct qun:784758214 and see how our forefathers learned.Exchange experience.From basic Python scripts to web development, crawlers, django, data mining, and so on, zero-based to project actual data are organized.For every Python buddy!Share some learning methods and small details that need attention, Click to join us python learner cluster
Install tushare
pip install tushare
Reference resources: http://tushare.org/
Get Quote Data
import pandas as pd
import tushare as ts

# Get stock data by stock code, no start and end dates are specified here
df = ts.get_k_data("300104")

# View Top 10 Data
df.head()

# View the last ten pieces of data
df.tail()

# Converts the index of the data to the date corresponding to the date field
df.index = pd.to_datetime(df.date)

# Remove redundant date fields
df.drop("date", inplace=True, axis=1)
Note: The relevant processing of stock data needs the knowledge of pandas,matplotlib. Reference: http://pandas.pydata.org/pandas-docs/version/0.20/10min.html
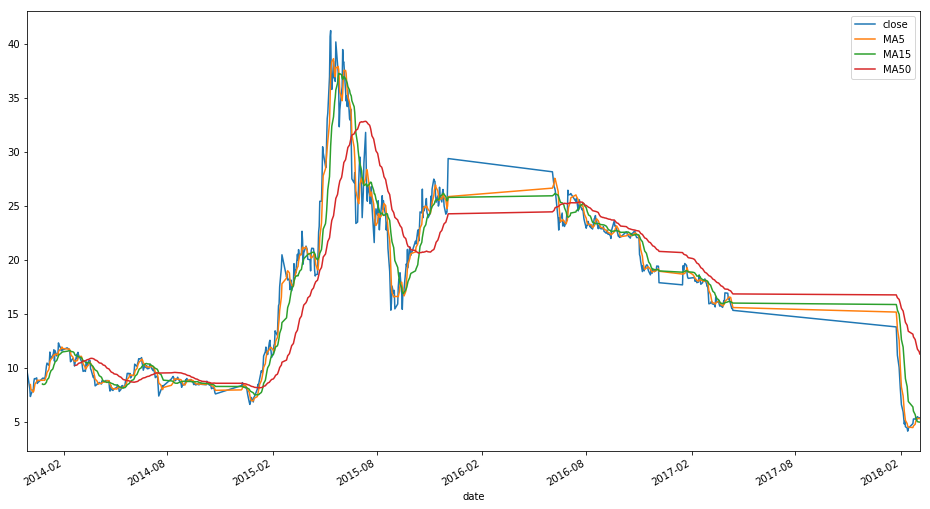
Calculate Common Indicators
# Calculate 5,15,50 day moving average, MA5, MA15, MA50
days = [5, 15, 50]
for ma in days:
    column_name = "MA{}".format(ma)
    df[column_name] = pd.rolling_mean(df.close, ma)

# Calculate floating ratio
df["pchange"] = df.close.pct_change()
# Calculate floating point numbers
df["change"] = df.close.diff()
The results after final processing are as follows:
df.head()
Out[13]:
             open  close   high    low    volume    code     MA5  MA15  MA50  \
date
2013-11-29  9.396  9.741  9.870  9.389  146587.0  300104     NaN   NaN   NaN
2013-12-02  9.298  8.768  9.344  8.768  177127.0  300104     NaN   NaN   NaN
2013-12-03  8.142  8.414  8.546  7.890  176305.0  300104     NaN   NaN   NaN
2013-12-04  8.391  8.072  8.607  8.053  120115.0  300104     NaN   NaN   NaN
2013-12-05  7.983  7.366  8.108  7.280  253764.0  300104  8.4722   NaN   NaN

             pchange  change
date
2013-11-29       NaN     NaN
2013-12-02 -0.099887  -0.973
2013-12-03 -0.040374  -0.354
2013-12-04 -0.040647  -0.342
visualization
Trend chart
By visualizing the data, you can intuitively feel the trend of the stock market.
Personally, if using the program to speculate in stocks or everything should be quantified, there should not be too many subjective opinions, if too dependent on intuition or mood at that time, then there is really no need to use the program to analyze.
df[["close", "MA5", "MA15", "MA50"]].plot(figsiz=(10,18))
The results are as follows:
k-line graph
import matplotplib.pyplot as plt
from matplotlib.daet import DateFormatter
from matplotlib.finance import date2num, candlestick_ohlc

def candlePlot(data, title=""):
    data["date"] = [date2num(pd.to_datetime(x)) for x in data.index]
    dataList = [tuple(x) for x in data[
        ["date", "open", "high", "low", "close"]].values]

    ax = plt.subplot()
    ax.set_title(title)
    ax.xaxis.set_major_formatter(DateFormatter("%y-%m-%d"))
    candlestick_ohlc(ax, dataList, width=0.7, colorup="r", colordown="g")
    plt.setp(plt.gca().get_xticklabels(), rotation=50,
             horizontalalignment="center")
    fig = plt.gcf()
    fig.set_size_inches(20, 15)
    plt.grid(True)

candlePlot(df)
The results are as follows:
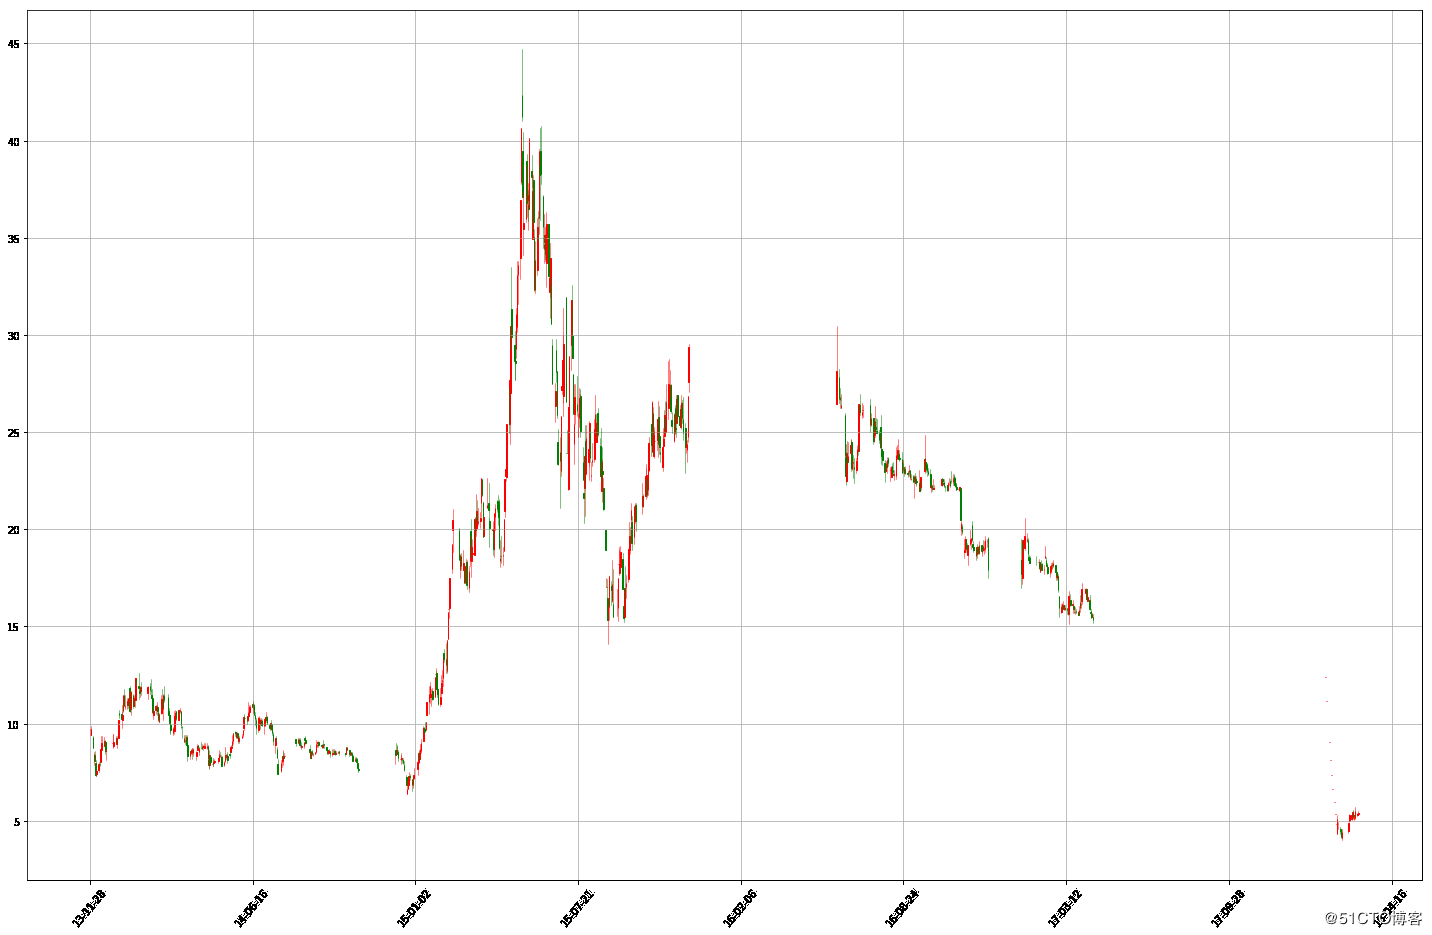
Note: This is just an example of the power and power of matplotlib. Check api or google if you encounter any strange problems.
Policy testing
Manual code
Use one of the recently purchased stocks here, Beijing East A(000725).
# Import related modules
import tushare as ts
import pandas as pd

# get data
df = ts.get_k_data("000725")

# Processing data
df.index = pd.to_datetime(df.date)
df.drop("date", axis=1, inplace=True)

# Calculate floating ratio
df["pchange"] = df.close.pct_change()
# Calculate floating point numbers
df["change"] = df.close.diff()

# View the first five rows of current data
             open  close   high    low      volume    code   pchange  change
date
2015-07-20  4.264  4.234  4.342  4.165  13036186.0  000725       NaN     NaN
2015-07-21  4.136  4.195  4.274  4.096   8776773.0  000725 -0.009211  -0.039
2015-07-22  4.175  4.146  4.214  4.067   9083703.0  000725 -0.011681  -0.049
2015-07-23  4.136  4.254  4.283  4.096  12792734.0  000725  0.026049   0.108
2015-07-24  4.224  4.136  4.254  4.106  13009620.0  000725 -0.027739  -0.118

# Set recall value
withdraw = 0.03
# Set breakthrough value
breakthrough = 0.03
# Set up account funds
account = 10000
# Number of hands holding positions
position = 0

def buy(bar):
    global account, position
    print("{}: buy {}".format(bar.date, bar.close))
    # Price at hand
    one = bar.close * 100
    position = account // one
    account = account - (position * one)

def sell(bar):
    global account, position
    # Price at hand
    print("{}: sell {}".format(bar.date, bar.close))
    one = bar.close * 100
    account += position * one
    position = 0

print("Start time investment time: ", df.iloc[0].date)
for date in df.index:
    bar = df.loc[date]
    if bar.pchange and bar.pchange > breakthrough and position == 0:
        buy(bar)
    elif bar.pchange and bar.pchange < withdraw and position > 0:
        sell(bar)

print("Cash eventually available: ", account)
print("Final market capitalization: ", position * df.iloc[-1].close * 100)
The output is as follows:
Start time investment time: 2015-07-20
2015-07-29: buy 3.83
2015-07-30: sell 3.653
2015-08-04: buy 3.752
......
2018-02-27: sell 5.71
2018-03-06: buy 5.79
 Final cash available: 333.3
 Final market value: 7527.0
CONCLUSION: More than 2,000 dollars have been lost through the above tests.
With Test Framework
With the help of the test frame, the correct withdrawal position is achieved, because the frame contains more functions.pyalgotrade is used here.
Simple use
from pyalgotrade import strategy
from pyalgotrade import technical
from pyalgotrade.barfeed import yahoofeed

# Custom Event Window Class
class DiffEventWindow(technical.EventWindow):
    def __init__(self, period):
        assert(period > 0)
        super(DiffEventWindow, self).__init__(period)
        self.__value = None

    def onNewValue(self, dateTime, value):
        super(DiffEventWindow, self).onNewValue(dateTime, value)
        if self.windowFull():
            lastValue = self.getValues()[0]
            nowValue = self.getValues()[1]
            self.__value = (nowValue - lastValue) / lastValue

    def getValue(self):
        return self.__value

# Custom Indicators
class Diff(technical.EventBasedFilter):
    def __init__(self, dataSeries, period, maxLen=None):
        super(Diff, self).__init__(dataSeries, DiffEventWindow(period), maxLen)

# Define your own strategy
class MyStrategy(strategy.BacktestingStrategy):
    def __init__(self, feed, instrument, diffPeriod=2):
        # Incoming feed and initial account funds
        super(MyStrategy, self).__init__(feed, 10000)
        self.__instrument = instrument
        self.__position = None
        self.setUseAdjustedValues(True)
        self.__prices = feed[instrument].getPriceDataSeries()
        self.__diff = Diff(self.__prices, diffPeriod)
        self.__break = 0.03
        self.__withdown = -0.03

    def getDiff(self):
        return self.__diff

    def onEnterCanceled(self, position):
        self.__position = None

    def onEnterOk(self, position):
        execInfo = position.getEntryOrder().getExecutionInfo()
        self.info("BUY at $%.2f" % (execInfo.getPrice()))

    def onExitOk(self, position):
        execInfo = position.getExitOrder().getExecutionInfo()
        self.info("SELL at $%.2f" % (execInfo.getPrice()))
        self.__position = None

    def onExitCanceled(self, position):
        # If the exit was canceled, re-submit it.
        self.__position.exitMarket()

    def onBars(self, bars):
        account = self.getBroker().getCash()
        bar = bars[self.__instrument]
        if self.__position is None:
            one = bar.getPrice() * 100
            oneUnit = account // one
            if oneUnit > 0 and self.__diff[-1] > self.__break:
                self.__position = self.enterLong(self.__instrument, oneUnit * 100, True)
        elif self.__diff[-1] < self.__withdown and not self.__position.exitActive():
            self.__position.exitMarket()

def runStrategy():
    # Download Data
    jdf = ts.get_k_data("000725")

    # New Adj Close Field
    jdf["Adj Close"] =jdf.close

    # Save fields of data under tushare in the data format required by pyalgotrade
    jdf.columns = ["Date", "Open", "Close", "High", "Low", "Volume", "code", "Adj Close"]

    # Save data to a cost-effective csv file
    jdf.to_csv("jdf.csv", index=False)

    feed = yahoofeed.Feed()
    feed.addBarsFromCSV("jdf", "jdf.csv")

    myStrategy = MyStrategy(feed, "jdf")

    myStrategy.run()
    print("Final portfolio value: $%.2f" % myStrategy.getResult())

runStrategy()
The output is as follows
2015-07-30 00:00:00 strategy [INFO] BUY at $3.78
2015-07-31 00:00:00 strategy [INFO] SELL at $3.57
2015-08-05 00:00:00 strategy [INFO] BUY at $3.73
2015-08-06 00:00:00 strategy [INFO] SELL at $3.56
...
2018-02-13 00:00:00 strategy [INFO] BUY at $5.45
Final portfolio value: $7877.30
At a glance, you'll see that you seem to have written more code with the framework, but it has more analysis tools built into it.
Here is a brief description.
Policy Visualization
from pyalgotrade import strategy
from pyalgotrade import technical
from pyalgotrade.barfeed import yahoofeed
from pyalgotrade import plotter
from pyalgotrade.stratanalyzer import returns

class DiffEventWindow(technical.EventWindow):
    def __init__(self, period):
        assert(period > 0)
        super(DiffEventWindow, self).__init__(period)
        self.__value = None

    def onNewValue(self, dateTime, value):
        super(DiffEventWindow, self).onNewValue(dateTime, value)
        if self.windowFull():
            lastValue = self.getValues()[0]
            nowValue = self.getValues()[1]
            self.__value = (nowValue - lastValue) / lastValue

    def getValue(self):
        return self.__value

class Diff(technical.EventBasedFilter):
    def __init__(self, dataSeries, period, maxLen=None):
        super(Diff, self).__init__(dataSeries, DiffEventWindow(period), maxLen)

class MyStrategy(strategy.BacktestingStrategy):
    def __init__(self, feed, instrument, diffPeriod=2):
        super(MyStrategy, self).__init__(feed, 10000)
        self.__instrument = instrument
        self.__position = None
        self.setUseAdjustedValues(True)
        self.__prices = feed[instrument].getPriceDataSeries()
        self.__diff = Diff(self.__prices, diffPeriod)
        self.__break = 0.03
        self.__withdown = -0.03

    def getDiff(self):
        return self.__diff

    def onEnterCanceled(self, position):
        self.__position = None

    def onEnterOk(self, position):
        execInfo = position.getEntryOrder().getExecutionInfo()
        self.info("BUY at $%.2f" % (execInfo.getPrice()))

    def onExitOk(self, position):
        execInfo = position.getExitOrder().getExecutionInfo()
        self.info("SELL at $%.2f" % (execInfo.getPrice()))
        self.__position = None

    def onExitCanceled(self, position):
        # If the exit was canceled, re-submit it.
        self.__position.exitMarket()

    def onBars(self, bars):
        account = self.getBroker().getCash()
        bar = bars[self.__instrument]
        if self.__position is None:
            one = bar.getPrice() * 100
            oneUnit = account // one
            if oneUnit > 0 and self.__diff[-1] > self.__break:
                self.__position = self.enterLong(self.__instrument, oneUnit * 100, True)
        elif self.__diff[-1] < self.__withdown and not self.__position.exitActive():
            self.__position.exitMarket()

def runStrategy():
    # Download Data
    jdf = ts.get_k_data("000725")

    # New Adj Close Field
    jdf["Adj Close"] =jdf.close

    # Save fields of data under tushare in the data format required by pyalgotrade
    jdf.columns = ["Date", "Open", "Close", "High", "Low", "Volume", "code", "Adj Close"]

    # Save data to a cost-effective csv file
    jdf.to_csv("jdf.csv", index=False)

    feed = yahoofeed.Feed()
    feed.addBarsFromCSV("jdf", "jdf.csv")

    myStrategy = MyStrategy(feed, "jdf")

    returnsAnalyzer = returns.Returns()
    myStrategy.attachAnalyzer(returnsAnalyzer)
    plt = plotter.StrategyPlotter(myStrategy)
    plt.getInstrumentSubplot("jdf")
    plt.getOrCreateSubplot("returns").addDataSeries("Simple returns", returnsAnalyzer.getReturns())

    myStrategy.run()
    print("Final portfolio value: $%.2f" % myStrategy.getResult())
    plt.plot()

runStrategy()
Python Resource Sharing qun 784758214 ,Installation packages are included. PDF,Learn video, here is Python The place where learners gather, zero base, advanced, all welcome
The picture output is as follows
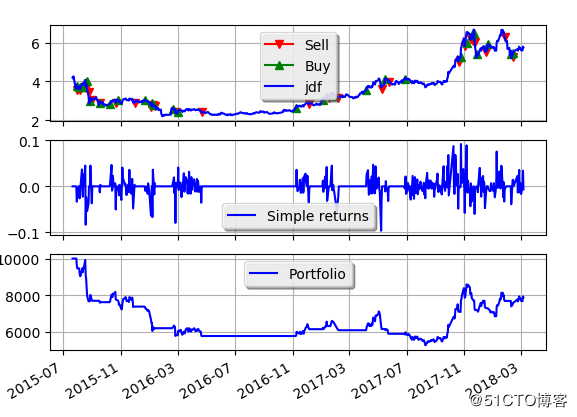
Note: The strategy test stock selection and time selection here are not rigorous, only for function demonstration, the test results may have great coincidence.
Stock price monitoring
According to this requirement, a semi-finished product for stock price monitoring is written, which is monitored by mailbox.
Tip: Enable QQ mailbox alert in WeChat's accessibility function, then stock price change notification will be timely, because WeChat is almost equivalent to text messages.
Here is a brief description of each configuration item and how to use it.
default paragraph
Breathrough represents the proportion of breakthroughs that need to be passed in two values. The breakthrough proportions within a project are 3% and 5%, respectively.
Withdraw represents a withdraw and also requires two values, 3% and 5% for example.
attention represents a list of stocks of interest, filled in stock codes of interest, separated by spaces
Note: There is no concern about stocks at this time, so a lot of attention to stocks may have performance problems.
mail Paragraph
Enter the username and password in turn and the recipient's mailbox
Positionon Paragraph
Stocks currently held and their holding costs.
If you hold Beijing East A(000725) at a stock price of 5.76.
000725 = 5.76
If there are multiple positions, there are corresponding key-value pairs as above.
Use method to refer to the readme of the script
https://github.com/youerning/UserPyScript/blob/master/monitor/README.md
==PS: Unfortunately the English level is not good, but also because of the comments, as well as the use of English vocabulary as variable names, if the words do not agree, please forgive me.==
Place an order
This part of me did not let the program execute automatically for the time being, because we have not developed a suitable and trusted system yet, so we rely on the notification of stock price monitoring to execute transactions manually according to the constantly revised system.
Postnote
Since it has been in the market for less than a year, you don't need to ask me about my trends or earnings. Current results are 5 games, 3 wins, slim profits.
Finally, end with the following figure.

Last but not least:
Watch and go again