Software environment:
1,vs2015,windows7,.net4.5
Presentation:
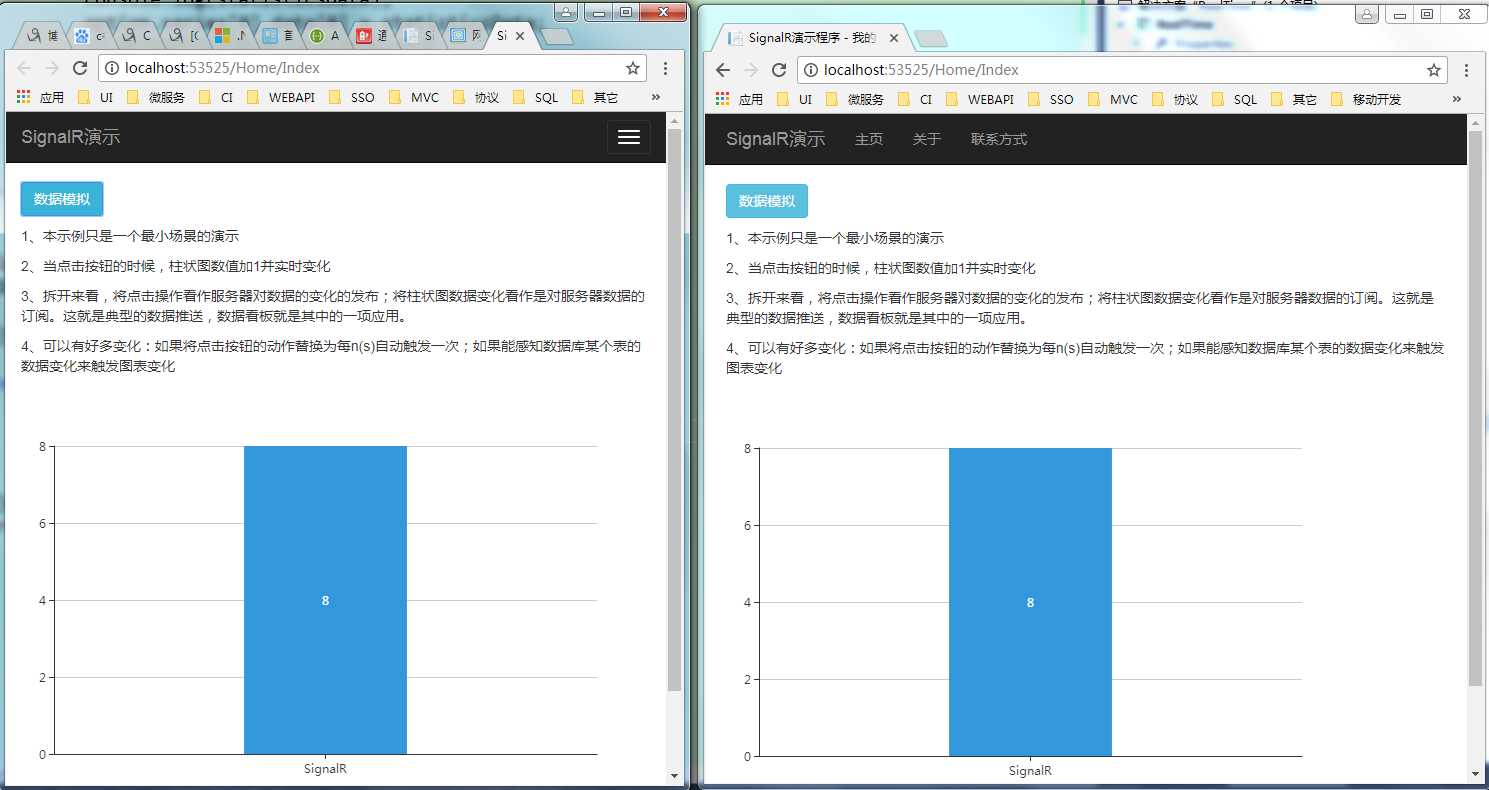
When the button is clicked, the histogram value is increased by 1 and changes in real time
1. First open vs2015 to create an mvc project and install SignalR2. For details, please refer to: http://net-yuan.com/Article/Detail/e407a472-338a-458d-9d7a-4a9e43fd2da5
2. Right click the project, create a new folder, named hub, and add the SignalR hub class named ChartHub
3. Right click the project, create a new folder, name it Services, and add a new class named ChartService
4. Create a method NotifyUpdates in the ChartService class. The code is as follows:
public async Task NotifyUpdates()
        {
            var hubContext = GlobalHost.ConnectionManager.GetHubContext<ChartHub>();
            if (hubContext != null)
            {
                var stats = await this.
GetCount();
                hubContext.Clients.All.updateChart(stats);
            }
        }
5. Create two more methods to simulate the process of obtaining and increasing the count respectively. In practice, you can query from the database and write the data to the database.
/// <summary>
    ///Analog data class
    /// </summary>
    public static class D
    {
        public static int Count { get; set; }
    }

    public async Task<int> GetCount()
        {
            return D.Count;
        }

        public async Task<int> IncreaceCount()
        {
            D.Count = D.Count + 1;
            return D.Count;
        }
6. Create ApiController and name it DataController. The code is as follows:
public class DataController : ApiController
    {
        private ChartService chartService;

        public DataController()
        {
            this.chartService = new ChartService();
        }

        // POST api/<controller>
        public async Task<HttpResponseMessage> Post()
        {
            var isCorrect = await this.chartService.IncreaceCount();

            await this.chartService.NotifyUpdates();

            return Request.CreateResponse(HttpStatusCode.Created, isCorrect);
        }
    }
7. View Home/Index. The code is as follows:
<br />
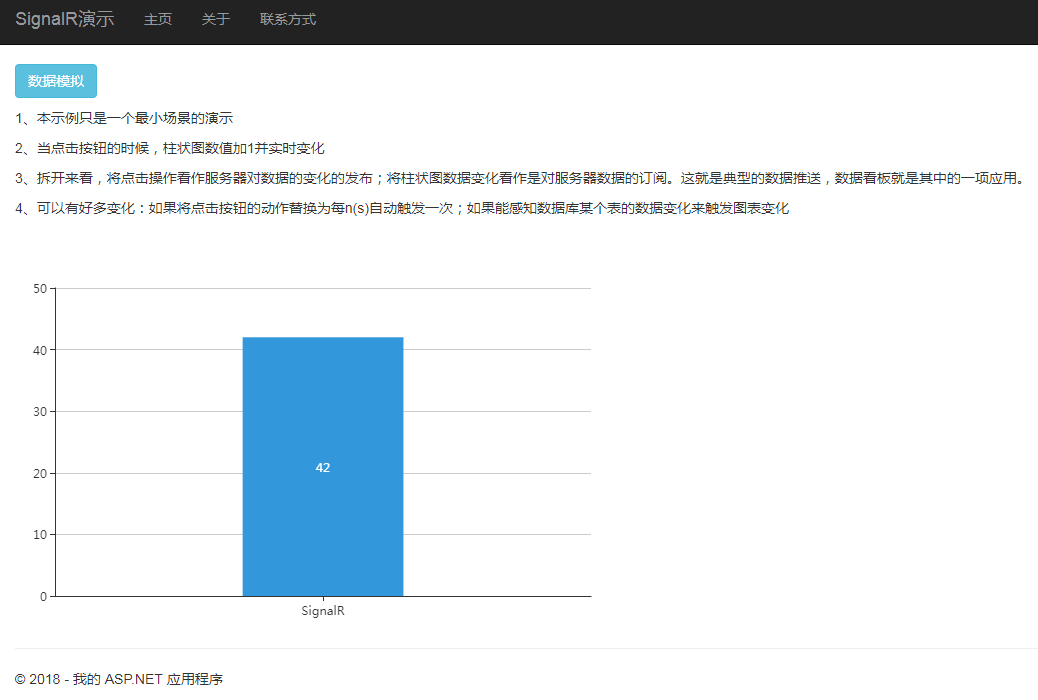
<p><button class="btn btn-info" onclick="clkTest();">Data simulation</button></p>
<p>1,This example is just a demonstration of a minimal scenario</p>
<p>2,When the button is clicked, the histogram value is increased by 1 and changes in real time</p>
<p>3,Take it apart to see that the click operation is regarded as the publication of the server's change to the data, and the histogram data change is regarded as the subscription to the server's data. This is a typical data push, and data Kanban is one of the applications.</p>
<p>4,There can be many changes: if you replace the action of clicking the button with every n(s)Automatically trigger once; if you can sense the data change of a table in the database to trigger the chart change</p>
<!-- by ECharts Prepare a DOM -->
<div id="main" style="width: 600px;height:400px;"></div>
<script src="~/Scripts/jquery-1.10.2.js"></script>
<script src="~/Scripts/echarts.simple.min.js"></script>
@section Scripts {
<script src="@Url.Content("~/Scripts/jquery.signalR-2.4.0.min.js")"></script>
<script src="@Url.Content("~/signalr/hubs")" type="text/javascript"></script>
<script>
// Initialize the echarts instance based on the prepared dom
var myChart = echarts.init(document.getElementById('main'));
// Specify configuration items and data for the chart
option = {
color: ['#3398DB'],
tooltip: {
trigger: 'axis',
axisPointer: { // Axis indicator, axis trigger valid
type: 'shadow' // The default is straight line, optional: 'line' | 'shadow'
}
},
grid: {
left: '3%',
right: '4%',
bottom: '3%',
containLabel: true
},
xAxis: [
{
type: 'category',
data: ['SignalR'],
axisTick: {
alignWithLabel: true
}
}
],
yAxis: [
{
type: 'value'
}
],
series: [
{
name: 'Direct access',
type: 'bar',
label: {
normal: {
show: true,
position: 'inside'
}
},
barWidth: '30%',
data: [0]
}
]
};
var connection = $.hubConnection();
var hub = connection.createHubProxy("ChartHub");
hub.on("updateChart", function (chart) {
statisticsData = chart;
console.log(statisticsData);
option.series[0].data[0] = statisticsData;
// Use the configuration items and data you just specified to display the chart.
myChart.setOption(option);
//$("#spCount").text(statisticsData);
});
connection.start();
</script>
}
<script>
$(function () {
myChart.setOption(option);
})
var clkTest = function () {
$.post("/api/Data", null, function (res) {
console.log(res);
//$("#spClicks").text(res);
}, "json")
}
</script>
8. The demonstration is as follows. Open two clients and you can see that when you click the button, the histogram of both clients will change