The next article will share the content of the toB end product manager. The content of data analysis will be sent on the weekend. As a person in a product post, it's a little outrageous to always send data analysis.
This chapter mainly talks about the data cleaning steps. The process is relatively simple. Interpolation method is not used. You can make do with it
1. Data preliminary missing value processing
a. The retrieval of the first row data source is shown in the figure
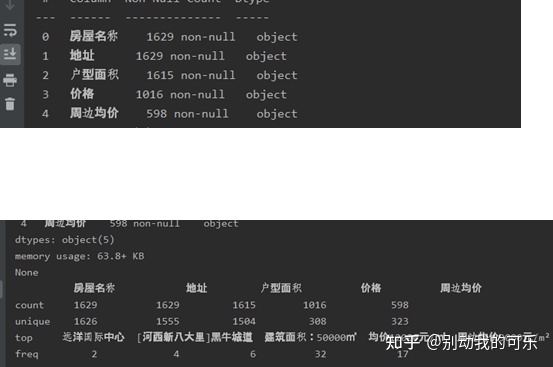
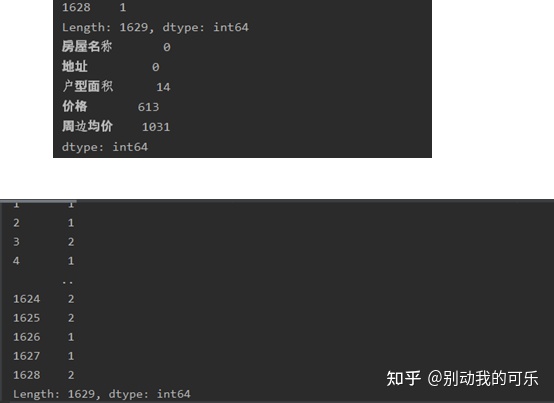
b. Count the missing values of columns and rows, as shown in the figure
c. Check and delete the row of the missing values in the three columns of house name, address and house type area, because the missing values in these three columns cannot be filled, and because the surrounding average price and average price have the same meaning, insert the surrounding average price column into the price column, and then delete the row of the missing value in the price column.
c=df.isnull().sum(axis=1) # view missing values
print(c)
d=df.isnull().sum(axis=0)
print(d)
df=df.dropna(subset = ['house name', 'address',' house type area ']) # delete the missing value row of this column
df=df.fillna(axis=1,method='backfill ') # inserts the surrounding average price into the price
df=df.dropna(subset = ['price']) # deletes the missing value of the price
2. Text de duplication
Retrieve the duplicate name of the first column for de duplication
data = df.drop_duplicates(subset = ['house name'], keep='first', inplace=False)
3. Delete the last column
Leave the necessary data. Now the data is not missing or duplicated, as shown in the figure

4. Data classification
Because of the different units of measurement of the house price of the residents, the average price and average price of the surrounding areas are classified into one category, the lowest into one category and the total price into one category. The classification analysis is shown in the figure below

5. Upper and lower limits of data transformation and extraction area
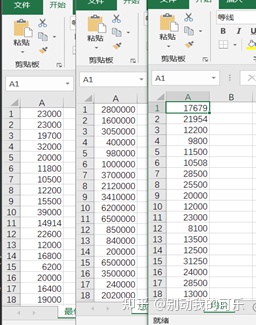
a. First delete the unimportant strings in the data and clear the data redundancy, such as the "average price around", "average price" and UOM of house price. Here, it is necessary to replace "10000" with "0000" as shown in the figure for future analysis. After clearing, the content shown in the figure is obtained and the final cleaned file is obtained. Because the area of the house is a range, it is necessary to separate the upper and lower limits of the area.

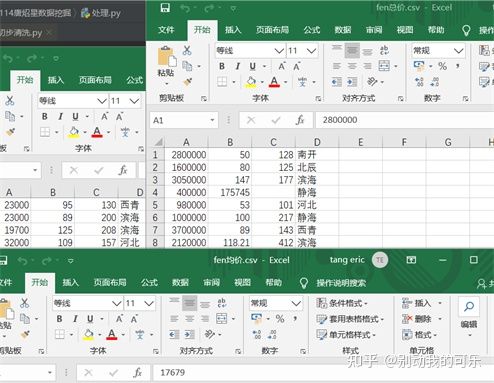
b. Write the house area corresponding to the house price into the document
for a in reader:
a=a ['unit area']
b = re.split(': |-|㎡|m²',a)
print(b[1:3], file=convert)
c. Extract the address keyword of the house type and write it into the document:
for c in reader1:
c = c ['address']
print(c[1:3],file=out3)
Finally, the data are shown in the figure to form the average price of fen csv, fen total price csv and fen are the lowest csv three files.
6. Further processing of missing values
Further delete the line where the missing value is located, and finally get the file as shown in the figure

0-1 standardization of data
Select 0-1 standardized processing for the data. The data to be processed include: "house price: yuan / m ²”, "'minimum area: M ²”, "'maximum area: M ²”, The three types of data of the three files shall be standardized, and the core code is as follows:
DF1 ['house price 0-1'] = ((df1 ['house price: yuan / m) ²']) - Df1['house price: yuan / m ²']. Min () / (df1['house price: yuan / m ²']. max() - df1['house price: yuan / m ²']. min())
df1 ['minimum area 0-1'] = ((df1 ['minimum area: m) ²']) - df1 ['minimum area: M ²']. min())/
(df1['minimum area: m) ²']. max() - df1['minimum area: M ²']. min())
DF1 ['maximum area 0-1'] = ((df1 ['maximum area: m) ²']) - DF1 ['maximum area: M ²']. Min () / (df1['maximum area: M ²']. max() - df1['maximum area: M ²']. min())
Source code on the old rule:
#clean
import numpy as np
import pandas as pd
import csv
file=open("C:\\Users\\admin\Desktop\\Tianjin housing data.csv",encoding="utf-8-sig")
out = open("C:\\Users\\admin\Desktop\\Post processing document of Tianjin housing data.csv",'w',encoding='utf-8-sig',newline="")
out1 = open("C:\\Users\\admin\Desktop\\Tianjin housing data processing file 1.csv",'w',encoding='utf-8-sig',newline="")
out2 = open("C:\\Users\\admin\Desktop\\Tianjin housing data processing document 2.csv",'w',encoding='utf-8-sig',newline="")
out3 = open("C:\\Users\\admin\Desktop\\Tianjin housing data processing document 3.csv",'w',encoding='utf-8-sig',newline="")

out4 =open("C:\\Users\\admin\Desktop\\Post processing data\\fen average price.csv",'w',encoding='utf-8-sig',newline="")
out5 =open("C:\\Users\\admin\Desktop\\Post processing data\\fen minimum.csv",'w',encoding='utf-8-sig',newline="")
out6 =open("C:\\Users\\admin\Desktop\\Post processing data\\fen Total price.csv",'w',encoding='utf-8-sig',newline="")

df=pd.read_csv(file)
b=df.info()
a=df.describe()#View detailed description
print(b)
print(a)
c=df.isnull().sum(axis=1)#View missing values
print(c)
d=df.isnull().sum(axis=0)
print(d)
df=df.dropna(subset=['House name','address','House type area'])#Delete the missing value row for this column
df=df.fillna(axis=1,method='backfill')#Insert the surrounding average price into the price
df=df.dropna(subset=['Price'])#Delete missing value for price
df=df.drop_duplicates(subset=['House name'], keep='first', inplace=False)#duplicate removal

df=df.drop(["Peripheral average price"],axis=1)

df1=df[df["Price"].str.contains('average price')]
df1.to_csv(out1)#Output to csv

df2=df[df["Price"].str.contains('minimum')]
df2.to_csv(out2)#Output to csv

df3=df[df["Price"].str.contains('Total price')]
df3.to_csv(out3)#Output to csv

df.to_csv(out)#Output to csv

#Standardization
import numpy as np
import csv
import pandas as pd
import matplotlib.pyplot as plt
import warnings
warnings.filterwarnings("ignore")
out1 =open("C:\\Users\\admin\Desktop\\Post processing data\\final\\Average price data.csv",'r',encoding='utf-8-sig',newline="")
out2 =open("C:\\Users\\admin\Desktop\\Post processing data\\final\\Low price data.csv",'r',encoding='utf-8-sig',newline="")
out3 =open("C:\\Users\\admin\Desktop\\Post processing data\\final\\Total price data.csv",'r',encoding='utf-8-sig',newline="")
#Average price 0-1
df1=pd.read_csv(out1,engine='python')
df1['House price 0-1'] = ((df1['House price: Yuan/m²']) -df1['House price: Yuan/m²'].min())/\
              (df1['House price: Yuan/m²'].max() - df1['House price: Yuan/m²'].min())
df1['Minimum area 0-1'] = ((df1['Minimum area: m²']) -df1['Minimum area: m²'].min())/\
                (df1['Minimum area: m²'].max() - df1['Minimum area: m²'].min())
df1['Maximum area 0-1'] = ((df1['Maximum area: m²']) -df1['Maximum area: m²'].min())/\
                (df1['Maximum area: m²'].max() - df1['Maximum area: m²'].min())
df1.to_csv(r'C:\\Users\\admin\Desktop\\Post processing data\\final\\Average price data 0-1.csv',mode='w',index =False,encoding='utf-8-sig')
#Low price 0-1
df2=pd.read_csv(out2,engine='python')
df2['House price 0-1'] = ((df2['House price: Yuan/m²']) -df2['House price: Yuan/m²'].min())/\
              (df2['House price: Yuan/m²'].max() - df2['House price: Yuan/m²'].min())
df2['Minimum area 0-1'] = ((df2['Minimum area: m²']) -df2['Minimum area: m²'].min())/\
                (df2['Minimum area: m²'].max() - df2['Minimum area: m²'].min())
df2['Maximum area 0-1'] = ((df2['Maximum area: m²']) -df2['Maximum area: m²'].min())/\
                (df2['Maximum area: m²'].max() - df2['Maximum area: m²'].min())
df2.to_csv(r'C:\\Users\\admin\Desktop\\Post processing data\\final\\Low price data 0-1.csv',mode='w',index =False,encoding='utf-8-sig')
#Total price 0-1
df3=pd.read_csv(out3,engine='python')
df3['House price 0-1'] = ((df3['House price: 10000 yuan/set']) -df3['House price: 10000 yuan/set'].min())/\
              (df3['House price: 10000 yuan/set'].max() - df3['House price: 10000 yuan/set'].min())
df3['Minimum area 0-1'] = ((df3['Minimum area: m²']) -df3['Minimum area: m²'].min())/\
                (df3['Minimum area: m²'].max() - df3['Minimum area: m²'].min())
df3['Maximum area 0-1'] = ((df3['Maximum area: m²']) -df3['Maximum area: m²'].min())/\
                (df3['Maximum area: m²'].max() - df3['Maximum area: m²'].min())
df3.to_csv(r'C:\\Users\\admin\Desktop\\Post processing data\\final\\Total price data 0-1.csv',mode='w',index =False,encoding='utf-8-sig')


#Visual legend
#average price

plt.figure(1)
plt.rcParams['font.sans-serif'] = 'Microsoft YaHei'
plt.rcParams['axes.unicode_minus'] = False
plt.figure(num='Title', facecolor='lightgray', figsize=(6, 3))
# Before average price processing
plt.subplot(3, 2, 1)
plt.title('average price-housing price', fontsize=10)
plt.bar(df1['address'], df1['House price: Yuan/m²'], 0.5, color='dodgerblue', label='housing price')
plt.legend()
# Average price 01 after standardization
plt.subplot(3, 2, 2)
plt.title('0-1 Standardization', fontsize=10)
plt.bar(df1['address'], df1['House price 0-1'], 0.2, color='orangered', label='House price 0-1')
plt.legend()
plt.tight_layout()
# Before low price treatment
plt.subplot(3, 2, 3)
plt.title('average price-housing price', fontsize=10)
plt.bar(df2['address'], df2['House price: Yuan/m²'], 0.5, color='dodgerblue', label='housing price')
plt.legend()
# After standardization
plt.subplot(3, 2, 4)
plt.title('0-1 Standardization', fontsize=10)
plt.bar(df2['address'], df2['House price 0-1'], 0.2, color='orangered', label='House price 0-1')
plt.legend()
plt.tight_layout()
# Before total price processing
plt.subplot(3, 2, 5)
plt.title('House price: 10000 yuan/set', fontsize=10)
plt.bar(df3['address'], df3['House price: 10000 yuan/set'], 0.5, color='dodgerblue', label='housing price')
plt.legend()
# Total price 01 after standardization
plt.subplot(3, 2, 6)
plt.title('0-1 Standardization', fontsize=10)
plt.bar(df3['address'], df3['House price: 10000 yuan/set'], 0.2, color='orangered', label='House price 0-1')
plt.legend()
plt.tight_layout()
plt.show()