Simple regression prediction of random forest
Random forest is a concrete implementation of bagging method. It will train multiple decision trees, and then integrate these results to be the final result. Random forest can be used for splitting or regression. It mainly depends on the selection of decision tree types, and selects specific types of decision trees according to specific tasks.
For the classification problem, a test sample will be sent to each decision tree for prediction, and then vote. The category with the most votes is the final classification result;
For the regression problem, the prediction result of random forest is the mean of all decision tree outputs.
This paper introduces the simple regression prediction of time series using random forest, which can meet most scientific research needs.
introduce
Advantages of random forest:
It performs well in the data set. The introduction of two randomness makes it difficult for the random forest to fall into over fitting, but it is still possible to over fit for small data sets, so we should pay attention to it;
The introduction of two randomness makes the random forest have good anti noise ability;
It can process high-dimensional data without feature selection, and has strong adaptability to data sets. It can process both discrete data and continuous data, and the data set does not need to be standardized;
When creating random forest, unbiased estimation is used for generalization error;
The training speed is fast, and the importance ranking of variables can be obtained;
In the training process, the interaction between feature s can be detected;
It is easy to make parallelization method;
The implementation is relatively simple
Disadvantages of random forest:
For small data sets and low dimensional data, the effect may not be very good.
The whole model is a black box without strong explanation.
Due to the two randomness of random forest, the operation result is unstable.
Data preparation
Install the required py libraries
pip install sklearn
Import required packages
import numpy as np
import matplotlib.pyplot as plt
from sklearn.ensemble import RandomForestRegressor
from sklearn.model_selection import train_test_split
from sklearn.multioutput import MultiOutputRegressor
Single output regression
Predicts a single digital output for a given input.
Randomly construct training set and test set
rng = np.random.RandomState(1)
X = np.sort(200 * rng.rand(600, 1) - 100, axis=0)
y = np.array([np.pi * np.sin(X).ravel()]).T
y += (0.5 - rng.rand(*y.shape))
#The shape of x and y is (600, 1) (600, 1)
X_train, X_test, y_train, y_test = train_test_split(
X, y, train_size=400, test_size=200, random_state=4)
#X_train, X_test, y_train, y_test's shape
#Is (400, 1) (200, 1) (400, 1) (200, 1)Build models and make predictions
#Define model
regr_rf = RandomForestRegressor(n_estimators=100, max_depth=30,
                                random_state=2)
# Set model
regr_rf.fit(X_train, y_train)
# Utilization prediction
y_rf = regr_rf.predict(X_test)
#evaluate
print(regr_rf.score(X_test, y_test))
Mapping
plt.figure()
s = 50
a = 0.4
plt.scatter(X_test, y_test, edgecolor='k',
c="navy", s=s, marker="s", alpha=a, label="Data")
plt.scatter(X_test, y_rf, edgecolor='k',
c="c", s=s, marker="^", alpha=a,
label="RF score=%.2f" % regr_rf.score(X_test, y_test))
plt.xlim([-6, 6])
plt.xlabel("X_test")
plt.ylabel("target")
plt.title("Comparing random forests and the test")
plt.legend()
plt.show()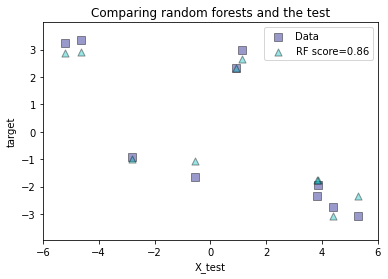
Multiple output regression
Two or more digital outputs are predicted based on the input.
The training set and test set are randomly constructed. Here, one x corresponds to two y
rng = np.random.RandomState(1)
X = np.sort(200 * rng.rand(600, 1) - 100, axis=0)
y = np.array([np.pi * np.sin(X).ravel(), np.pi * np.cos(X).ravel()]).T
y += (0.5 - rng.rand(*y.shape))
#The shape of x and y is (600, 1) (600, 2)
X_train, X_test, y_train, y_test = train_test_split(
X, y, train_size=400, test_size=200, random_state=4)
#X_train, X_test, y_train, y_test's shape
#Is (400, 1) (200, 2) (400, 1) (200, 2)Build models and make predictions
Here we try to use random forest and wrapper class
#Define model
max_depth = 30
regr_multirf = MultiOutputRegressor(RandomForestRegressor(n_estimators=100, max_depth=max_depth, random_state=0))
# Fitting model
regr_multirf.fit(X_train, y_train)
#Define model
regr_rf = RandomForestRegressor(n_estimators=100, max_depth=max_depth,
random_state=2)
# fitting
regr_rf.fit(X_train, y_train)
#forecast
y_multirf = regr_multirf.predict(X_test)
y_rf = regr_rf.predict(X_test)Mapping
plt.figure()
s = 50
a = 0.4
plt.scatter(y_test[:, 0], y_test[:, 1], edgecolor='k',
            c="navy", s=s, marker="s", alpha=a, label="Data")
plt.scatter(y_multirf[:, 0], y_multirf[:, 1], edgecolor='k',
            c="cornflowerblue", s=s, alpha=a,
            label="Multi RF score=%.2f" % regr_multirf.score(X_test, y_test))
plt.scatter(y_rf[:, 0], y_rf[:, 1], edgecolor='k',
            c="c", s=s, marker="^", alpha=a,
            label="RF score=%.2f" % regr_rf.score(X_test, y_test))
plt.xlim([-6, 6])
plt.ylim([-6, 6])
plt.xlabel("target 1")
plt.ylabel("target 2")
plt.title("Comparing random forests and the multi-output meta estimator")
plt.legend()
plt.show()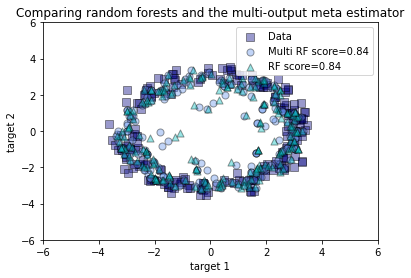
Welcome to vx official account remote sensing fans. More are waiting for release.