Write in front
skywalking is an observability analysis platform and application performance management system. It is an integrated solution for service tracking, measurement and recording, and supports multiple languages. Similar to zipkin, but much more powerful than it. I encountered many problems when using it, so I recorded the whole process in detail for reference.
edition
skywalking: v8.6.0 for H2/MySQL/TiDB/InfluxDB/ElasticSearch 7
mysql: 8
springboot: 2.1.13.RELEASE
install
Official website Download the latest version:

Upload to the server and unzip
tar -zxvf apache-skywalking-apm-es7-8.6.0.tar.gz
Modify / Apache skywalking APM bin ES7 / config / application YML file, which specifies the cluster status, storage, configuration and other configurations of your skywalking. Make the following modifications:
112 that 's ok: selector: ${SW_STORAGE:h2}
Replace with: selector: ${SW_STORAGE:mysql}

The above changes indicate the use of mysql Store, and then modify 172 lines mysql Connection feature configuration for:
take ip,The user and password are changed to their own machine mysql And create a file named swtest Empty library, skywalking The table will be created at startup

  mysql:
    properties:
      jdbcUrl: ${SW_JDBC_URL:"jdbc:mysql://10.65.54.230:3306/swtest"}
      dataSource.user: ${SW_DATA_SOURCE_USER:root}
      dataSource.password: ${SW_DATA_SOURCE_PASSWORD:root}
Above, we change the storage of skywalking to mysql. You need to:
/Add mysql driver package in apache-skywalking-apm-bin-es7 / OAP LIBS Directory: Download according to version.
After all the above are completed, you can start up: / apache-skywalking-apm-bin-es7/bin sh.
If the startup is successful, access http://ip:8080 The following page appears:
If the page does not come out, go to / apache-skywalking-apm-bin-es7/logs / to view the log. If port 8080 is occupied, go to / apache-skywalking-apm-bin-es7 / webapp / webapp YML modification
use
Skywalking is to realize local or remote service detection, data capture and so on through Java agent. When I understand the agent, I understand it as a client. Only when my service carries this client can my data be obtained by skywalking service. Next, see the specific operation:
Copy a copy of the agent folder under / apache-skywalking-apm-bin-es7 / and put it under / home. Start the service you want to listen to: Java - javaagent: / home / agent / skywalking agent jar -Dskywalking. agent. service_ name=demo -jar /home/project/demo. jar --server. port=20211 --spring. profiles. active=dev
The above command: - javaagent specifies the probe position, - dskywalking agent. service_ Name specifies the service name
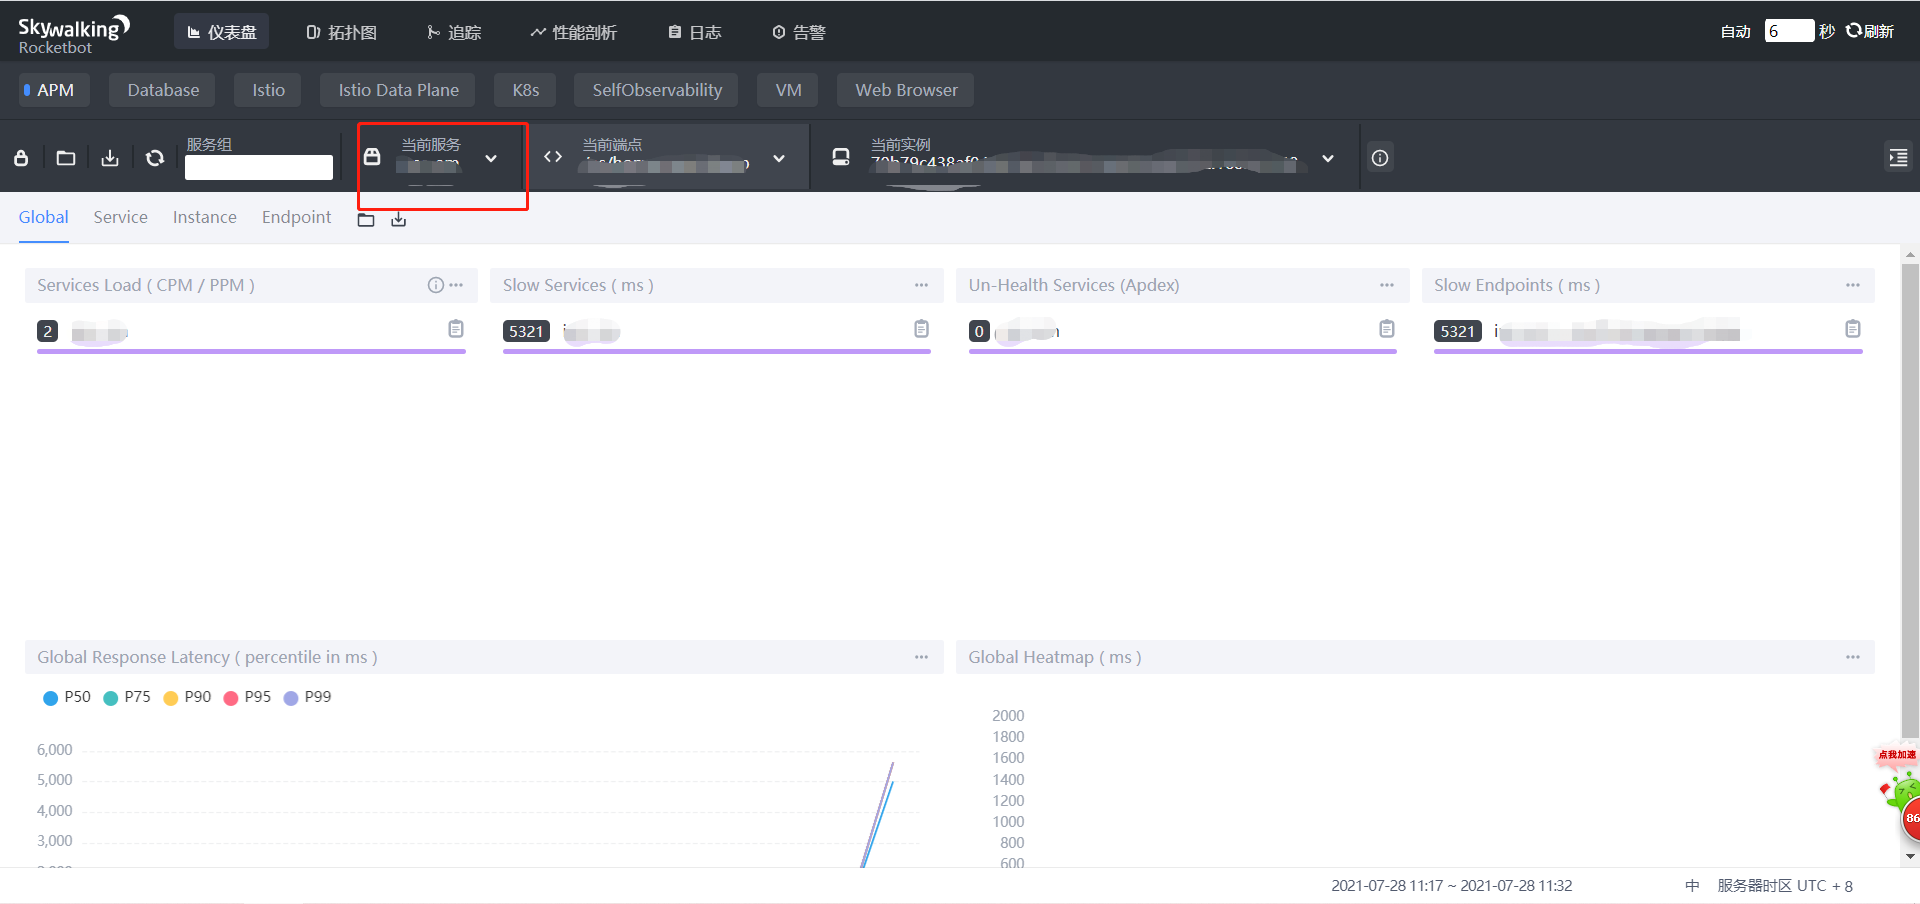
If the startup is successful, we can see the current service on the home page:
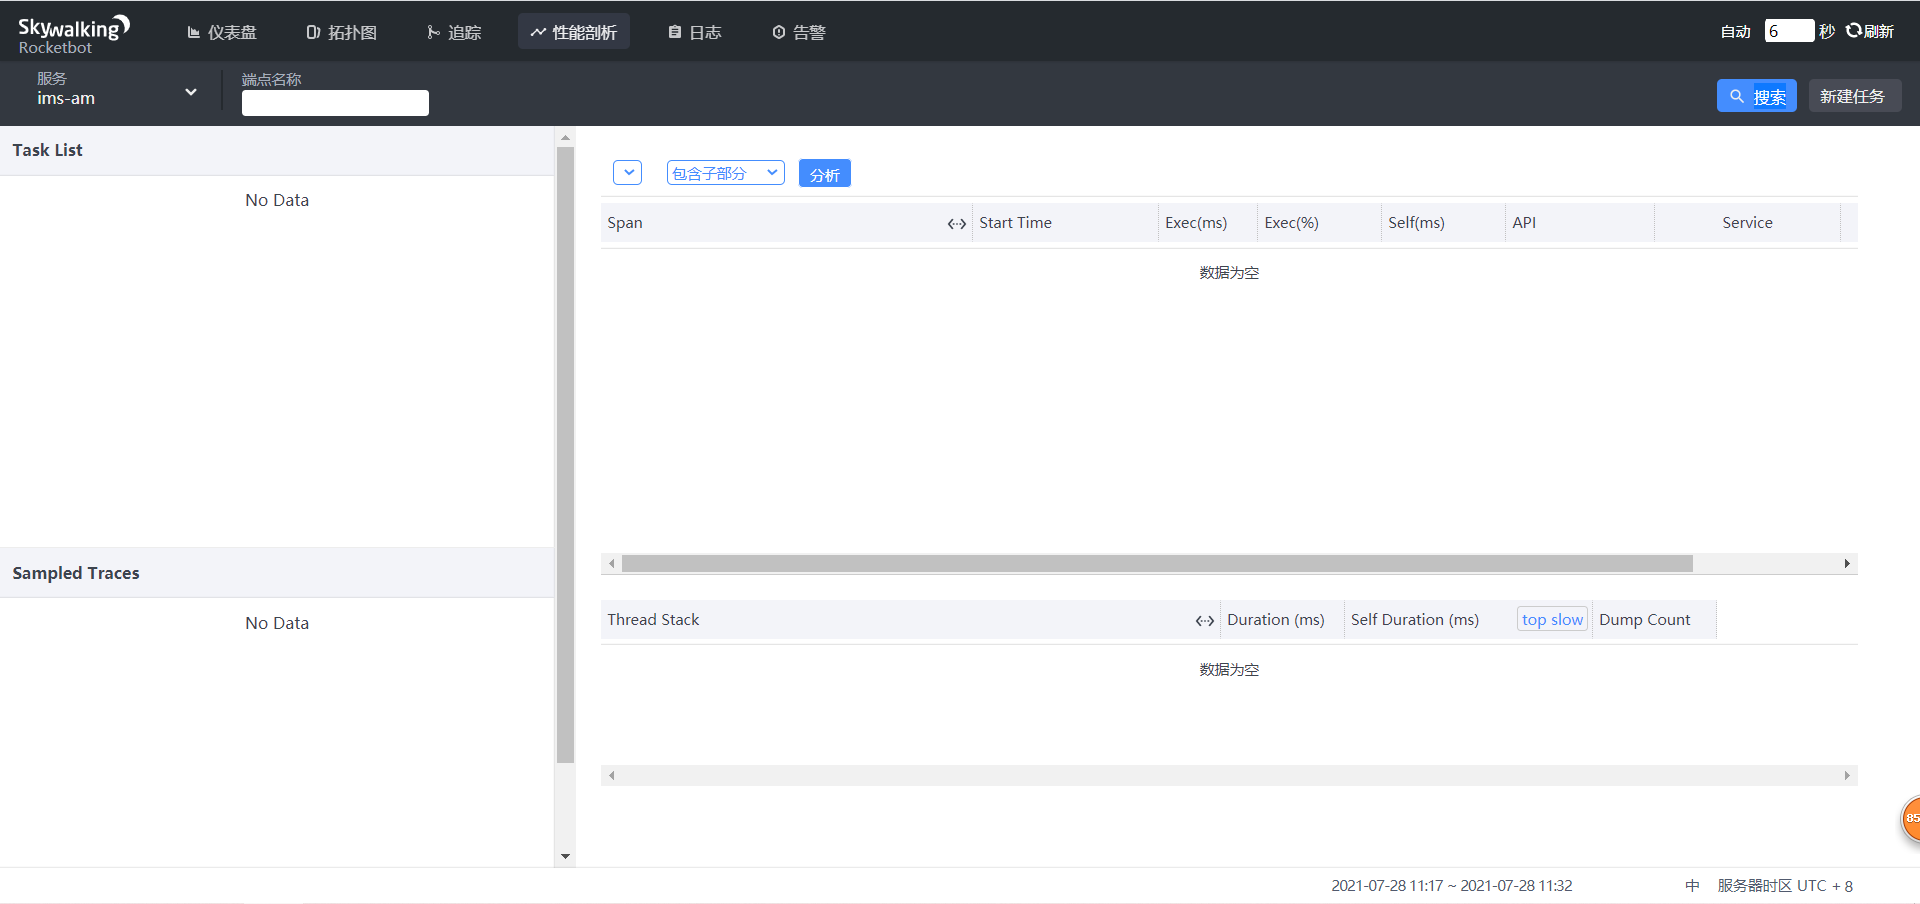
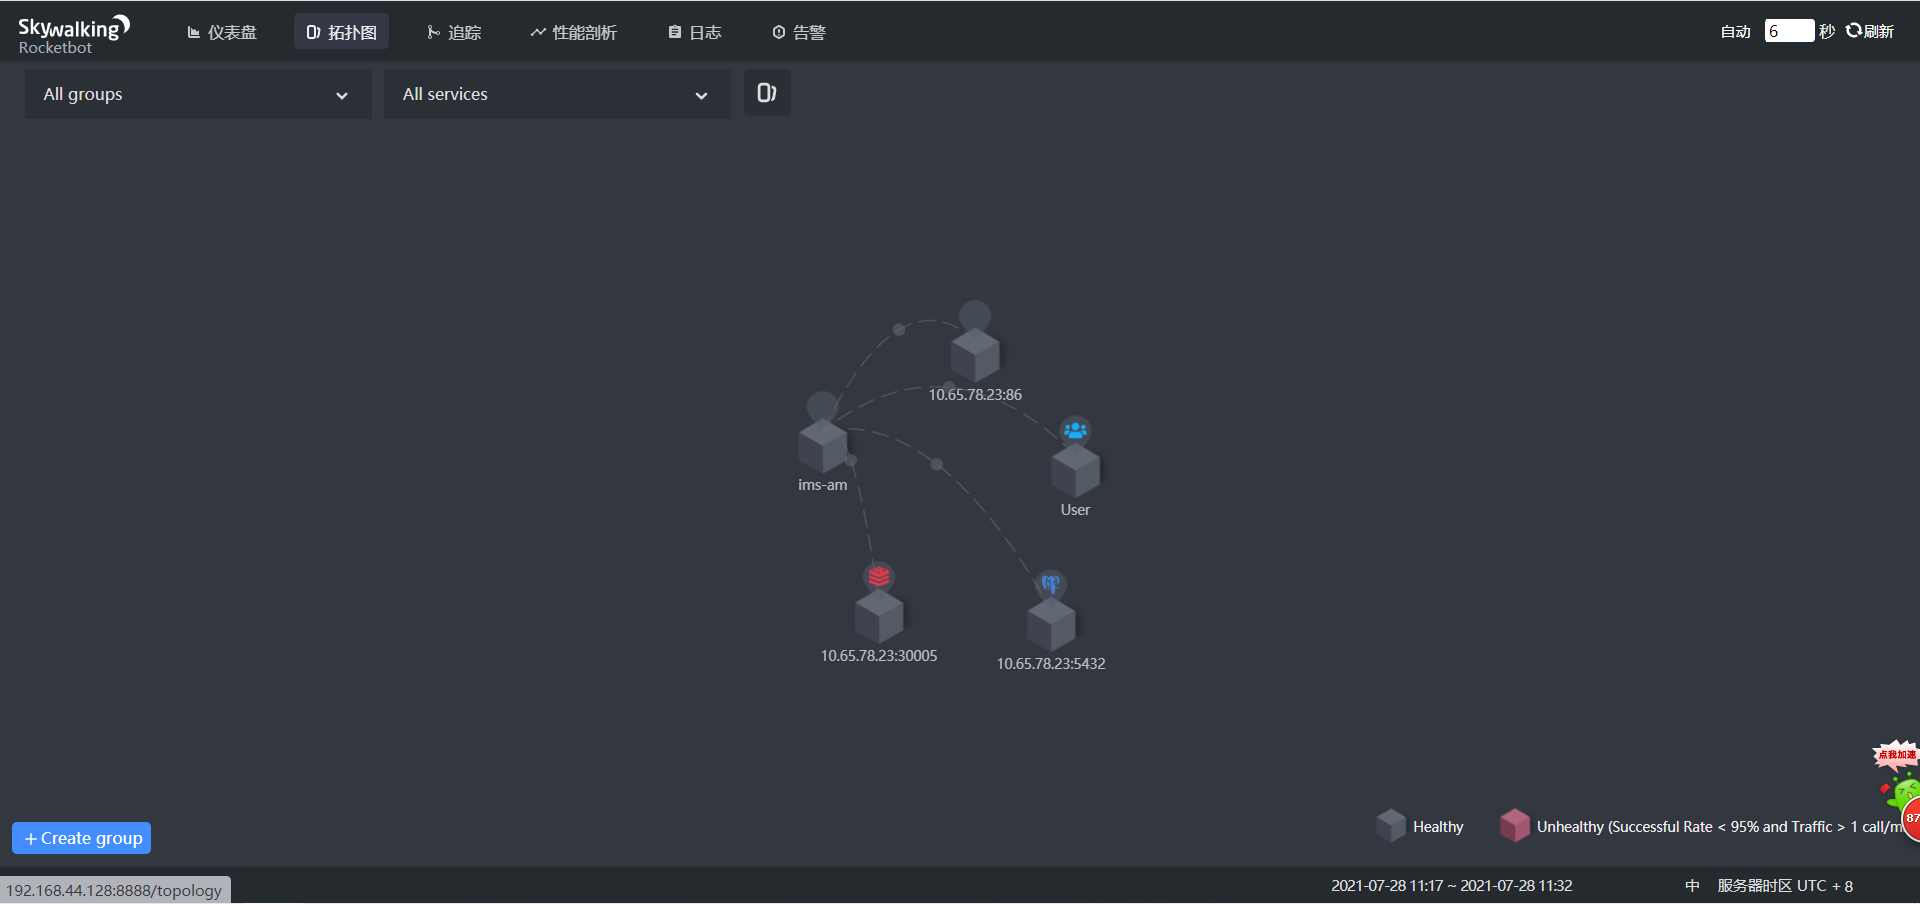
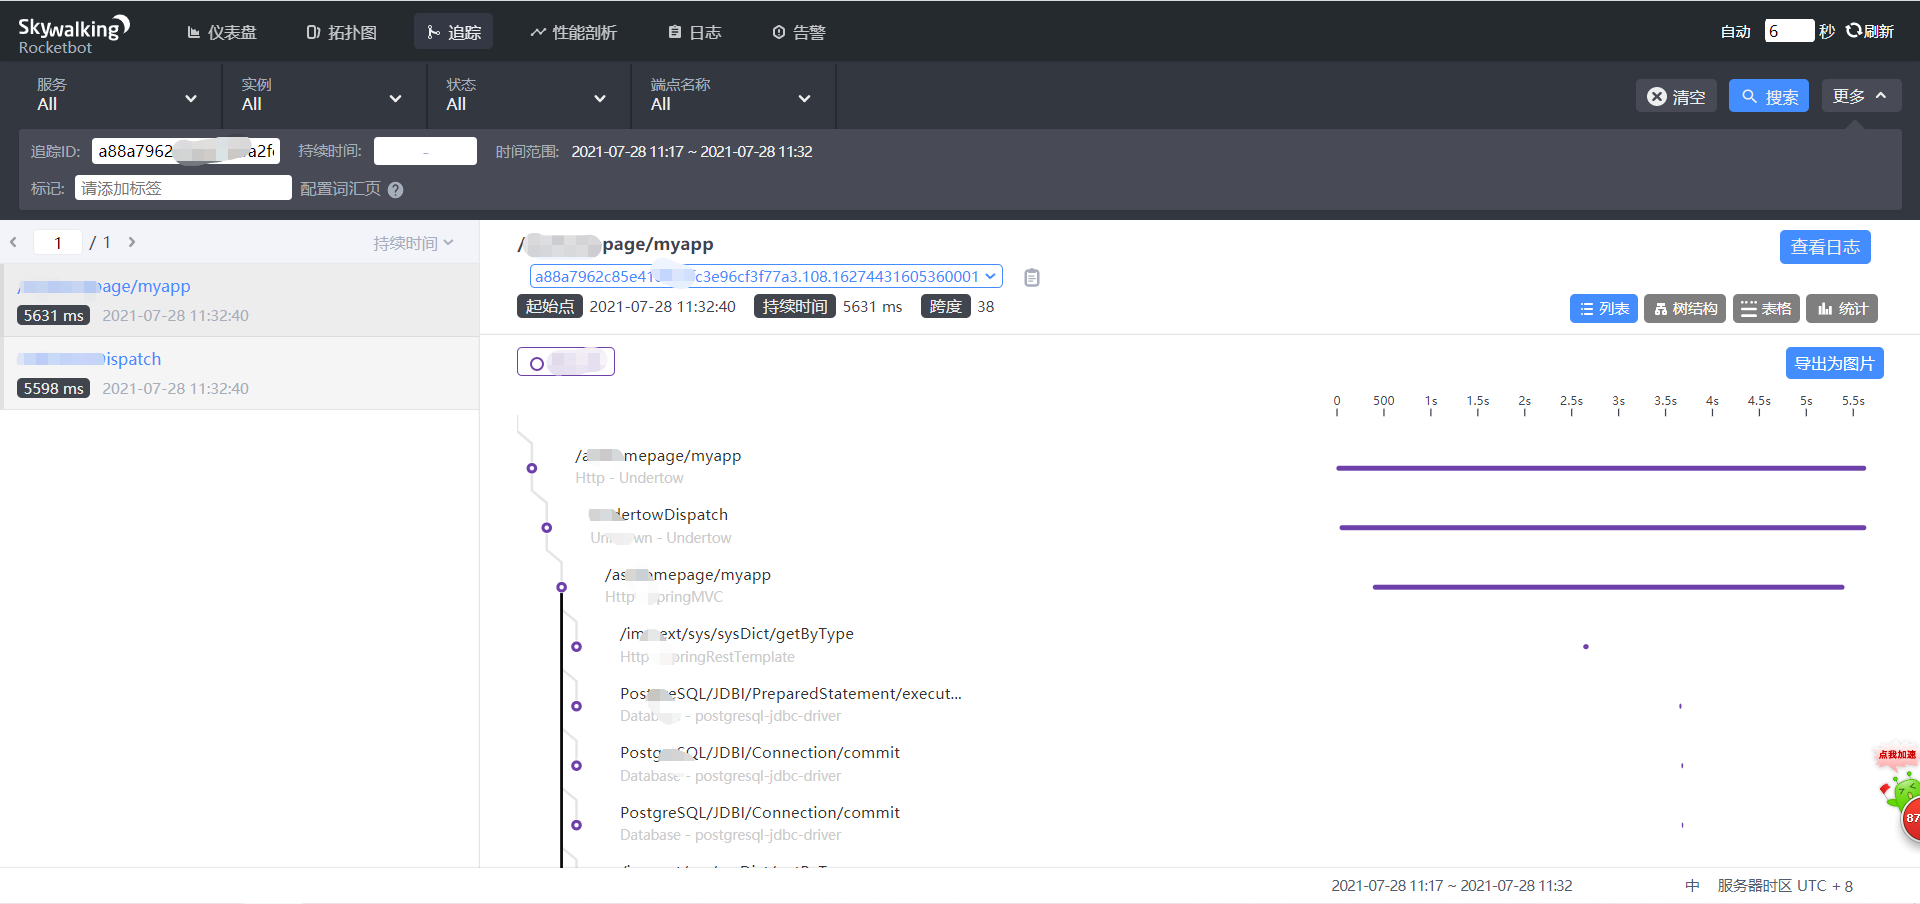
In addition, when our service makes an interface request, we can see the trend details of the request on the topology map and tracking page:
Log monitoring
logback is used for logging. See the configuration directly:
- Introducing skywalking Toolkit:
<dependency>
    <groupId>org.apache.skywalking</groupId>
    <artifactId>apm-toolkit-trace</artifactId>
    <version>8.5.0</version>
</dependency>
<dependency>
    <groupId>org.apache.skywalking</groupId>
    <artifactId>apm-toolkit-logback-1.x</artifactId>
    <version>8.5.0</version>
</dependency>
- logback-spring. Introducing GRPCLogClientAppender into XML
<appender name="grpc-log" class="org.apache.skywalking.apm.toolkit.log.logback.v1.x.log.GRPCLogClientAppender">
    <encoder class="ch.qos.logback.core.encoder.LayoutWrappingEncoder">
        <layout class="org.apache.skywalking.apm.toolkit.log.logback.v1.x.mdc.TraceIdMDCPatternLogbackLayout">
            <pattern>%date [%X{tid}] [%thread] %-5level [%logger{50}] %file:%line - %msg%n</pattern>
        </layout>
    </encoder>
    <filter class="ch.qos.logback.classic.filter.ThresholdFilter">
        <level>INFO</level>
    </filter>
</appender>

<root level="INFO">
    <appender-ref ref="grpc-log" />
</root>
- springboot project configuration import
logging:
  config: classpath:logback-spring.xml
- Agent configuration: / Apache skywalking APM bin ES7 / agent / config / agent config
plugin.toolkit.log.grpc.reporter.server_host=${SW_GRPC_LOG_SERVER_HOST:127.0.0.1}
plugin.toolkit.log.grpc.reporter.server_port=${SW_GRPC_LOG_SERVER_PORT:11800}
plugin.toolkit.log.grpc.reporter.max_message_size=${SW_GRPC_LOG_MAX_MESSAGE_SIZE:10485760}
plugin.toolkit.log.grpc.reporter.upstream_timeout=${SW_GRPC_LOG_GRPC_UPSTREAM_TIMEOUT:30}
When you start the access, you can see:
