1. Introduction to link tracking
In the microservicing construction of large-scale systems, a system is divided into many modules. These modules are responsible for different functions, combined into a system, and finally can provide rich functions. In this architecture, a request often involves multiple services. Internet applications are built on different sets of software modules. These software modules may be developed by different teams, implemented in different programming languages, distributed on thousands of servers and across multiple data centers, which means that there will be some problems in this architecture form:
- How to find problems quickly?
- How to judge the fault influence range?
- How to sort out service dependence and the rationality of dependence?
- How to analyze link performance problems and real-time capacity planning?
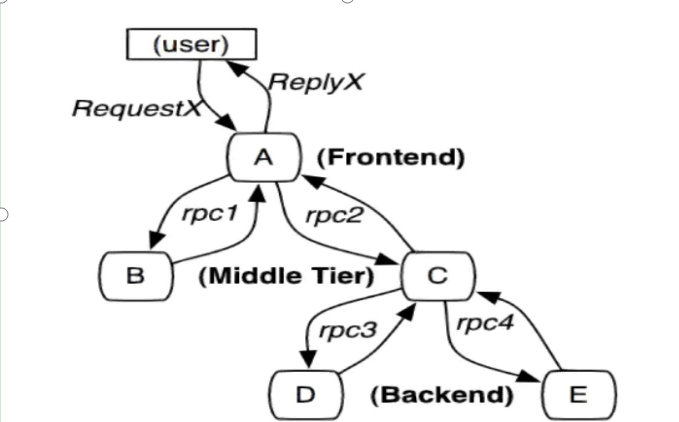
Distributed tracking is to restore a distributed request to a call link, log, monitor performance, and display the call of a distributed request. For example, the time spent on each service node, the specific IP on which machine the request arrives, the request status of each service node 200 ¢ 500, and so on.
Common link tracking technologies include the following:
cat is an open-source application monitoring platform developed based on Java, including real-time application monitoring and business monitoring. integrate
The scheme is to realize monitoring through code embedding points, such as interceptors, filters, etc. The code is very intrusive and the integration cost is high. High risk.
zipkin is an open-source, open-source distributed tracking system developed by Twitter to collect timing data of services to solve micro problems
Delay in service architecture, including data collection, storage, search and presentation. The product is simple to use in combination with spring cloud sleuth # and easy to integrate, but it has simple functions.
pinpoint Pinpoint is an open source call chain analysis and application monitoring analysis tool based on bytecode injection in Korea. It is characterized by supporting a variety of plug-ins, powerful UI and no code intrusion at the access end.
skywalking
SkyWalking is a native open source call chain analysis and application monitoring analysis tool based on bytecode injection. Features support multiple
A plug-in with strong UI function and no code intrusion at the access end. At present, it has joined the Apache incubator.
Sleuth (log all nodes on each link, as well as the machines where these nodes are located, and time consumption.) log4j
Link tracking solution in distributed system provided by spring cloud.
Note: the spring cloud Alibaba technology stack does not provide its own link tracking technology. We can use Sleuth+
Zipkin to do link tracking solution
Spring cloud is not its own technology -- it integrates all frameworks to solve the problems of microservices.
2. Sleuth introduction
The main function of SpringCloud Sleuth is to provide tracking solutions in distributed systems. It borrows a lot from the design of Google Dapper. Let's first understand the terms and related concepts in Sleuth.
Trace (a complete link containing many spans (microservice interfaces))
A group of spans with the same Trace Id (throughout the whole link) are connected in series to form a tree structure. In order to realize request tracking, when the request reaches the entry endpoint of the distributed system, the service tracking framework only needs to create a unique identifier (i.e. TraceId) for the request. At the same time, when it flows within the distributed system, the framework always keeps passing the unique value until the return of the whole request. Then we can use the unique ID to connect all requests in series to form a complete request link.
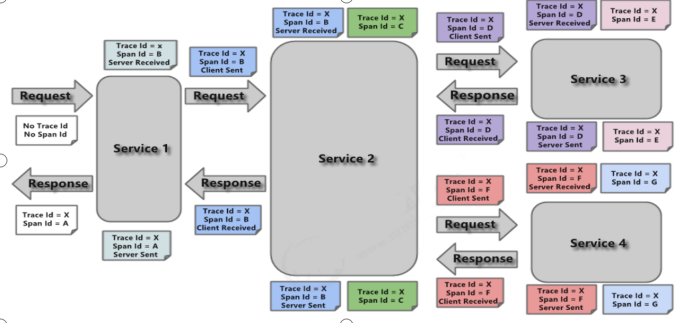
Span
Represents a basic set of work units. In order to count the delay of each processing unit, when the request reaches each service component, it also marks its start, specific process and end through a unique ID (SpanId). Through the start and end timestamps of SpanId, we can count the call time of the span. In addition, we can also obtain the name of the event. Metadata such as request information.
Annotation
Use it to record events over a period of time. Important notes for internal use:
- cs (Client Send) the client sends a request to start the life of a request
- sr (Server Received) the server receives the request and starts processing, sr - cs = network delay (time of service call)
- ss (Server Send) the server has finished processing and is ready to send it to the client. ss - sr = request processing time on the server
- cr (client received) the client receives the response from the server and the request ends. cr - sr = total time requested
Introduction
Next, Sleuth is integrated through previous project cases to complete the preparation of entry cases.
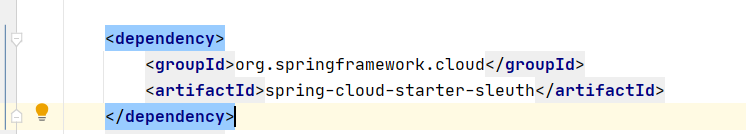
Modify parent project and introduce Sleuth dependency
After the microservice is started and invoked, we can observe sleuth's log output on the console

Viewing log files is not a good method. When there are more and more microservices, there will be more and more log files. Zipkin can aggregate logs and carry out visual display and full-text retrieval.
Zipkin integration
1. ZipKin introduction
Zipkin is an open source project of} Twitter. It is implemented based on Google Dapper. It is committed to collecting service timing data to solve the delay problem in the micro service architecture, including data collection, storage, display, search and tracking data of request links on various servers, The REST API interface provided by it helps us query the tracking data to realize the monitoring program of the distributed system, so as to timely find the problem of increasing delay in the system and find out the root cause of the system performance bottleneck
In addition to the development oriented API interface, it also provides convenient UI components to help us intuitively search tracking information and analyze request link details. For example, you can query the processing time of each user's request within a certain period of time.
Zipkin provides pluggable data storage methods: in memory, MySql, Cassandra and {Elasticsearch.
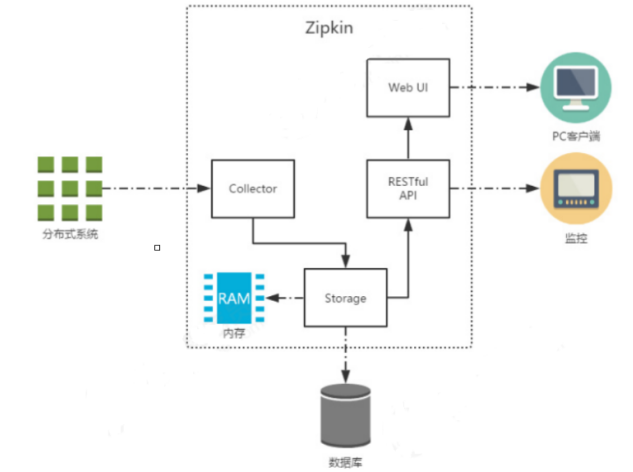
The figure above shows the infrastructure of # Zipkin, which is mainly composed of # 4 core components:
- Collector: collector component, which is mainly used to process tracking information sent from external systems and convert these information into Span format processed by Zipkin internally to support subsequent storage, analysis, display and other functions.
- Storage: storage component, which mainly processes the tracking information received by the collector. By default, these information will be stored in memory. We can also modify this storage strategy to store the tracking information in the database by using other storage components.
- RESTful API: API component, which is mainly used to provide external access interfaces. For example, show the tracking information to the client, or access the external system to realize monitoring, etc.
- Web UI: UI component, the upper application based on API component. Through UI components, users can easily and intuitively query and analyze tracking information.
Zipkin is divided into two ends. One is Zipkin server and the other is Zipkin client. The client is the application of microservices. The client will configure the URL address of the server. Once a call between services occurs, it will be monitored by Sleuth's listener configured in the micro service, generate corresponding Trace and Span information and send it to the server.
2. ZipKin server installation
Step 1: Download ZipKin's jar package

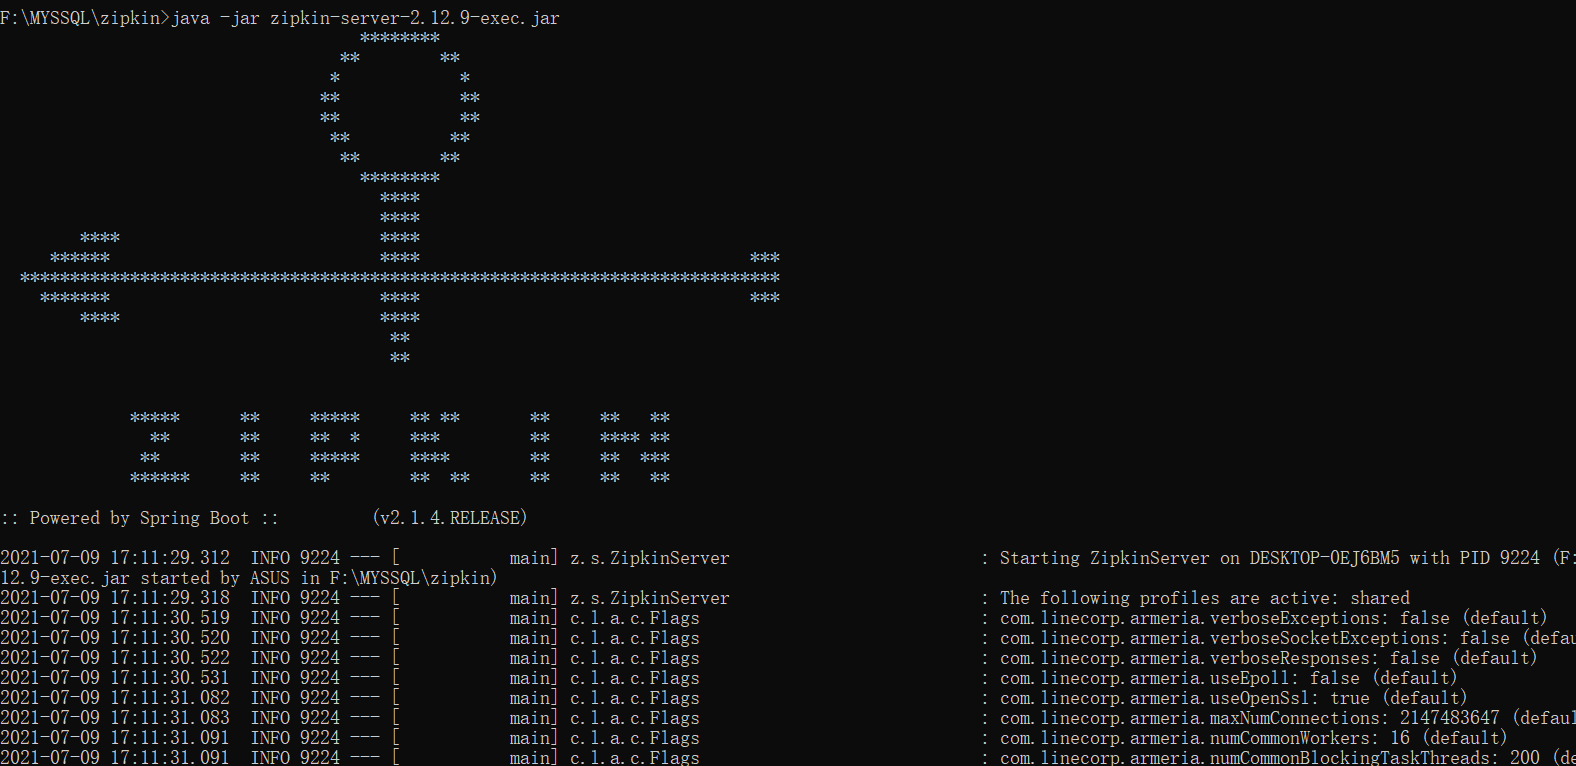
Step 2: from the command line, enter the following command to start ZipKin Server
java -jar zipkin-server-2.12.9-exec.jar
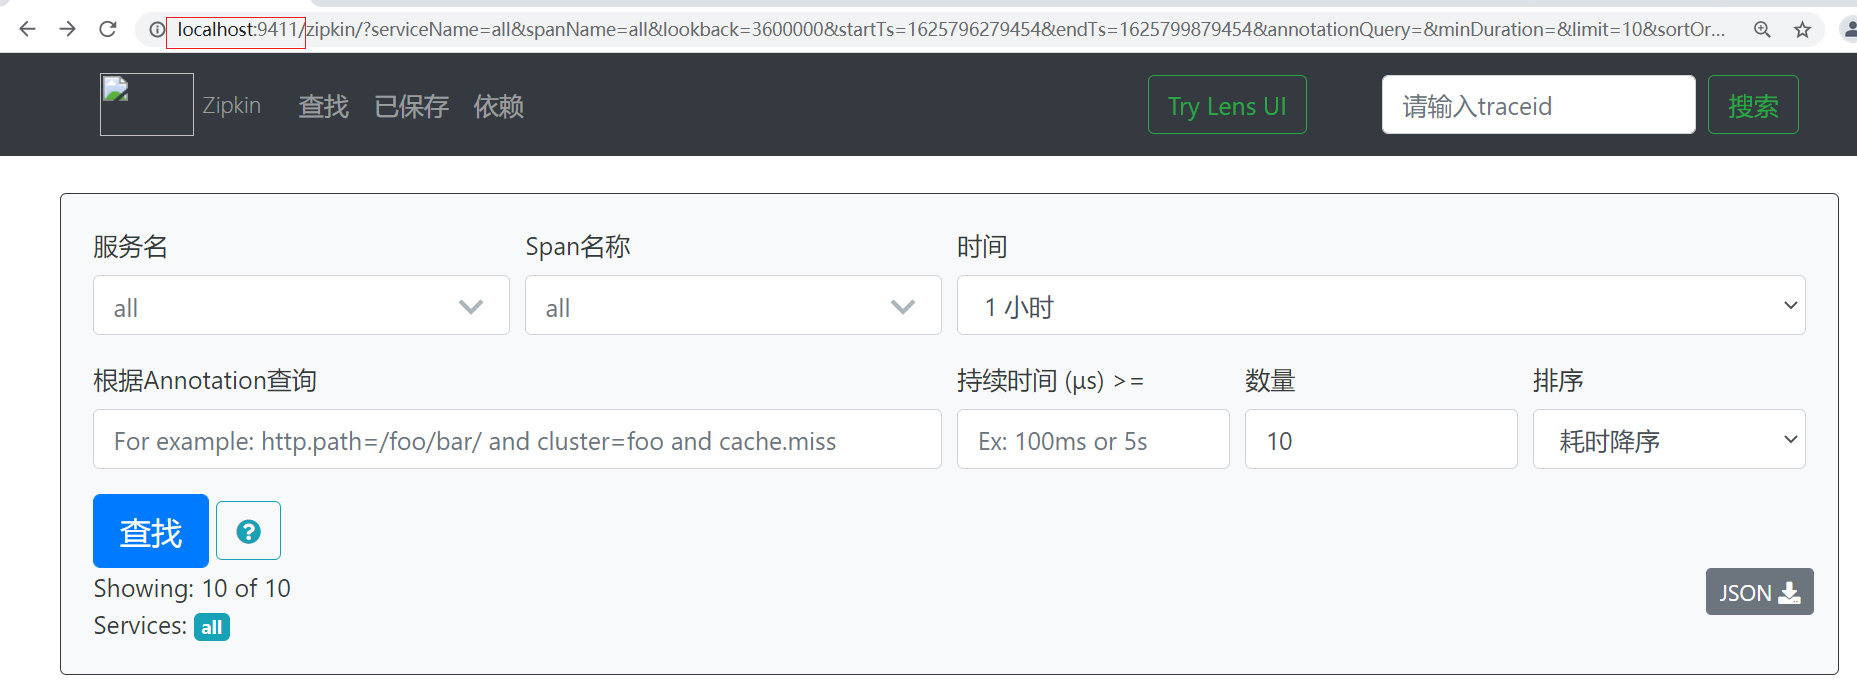
Step 3: access via browser http://localhost:9411 visit
3. Zipkin client integration
The integration of ZipKin client and Sleuth is very simple. You only need to add its dependency and configuration in the micro service
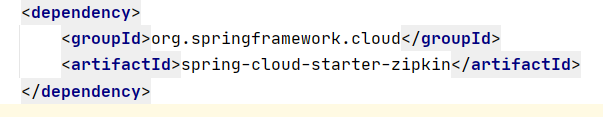
Step 1: add dependencies on each micro service
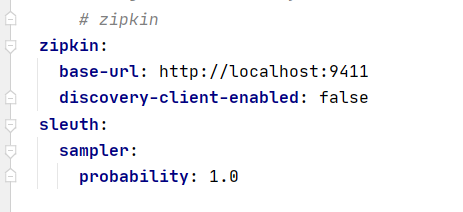
Step 2: add configuration
Step 3: access microservices
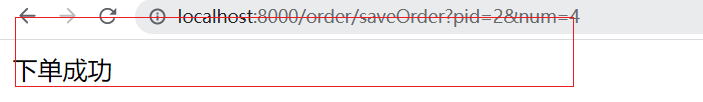 Step 4: visit the UI interface of zipkin and observe the effect
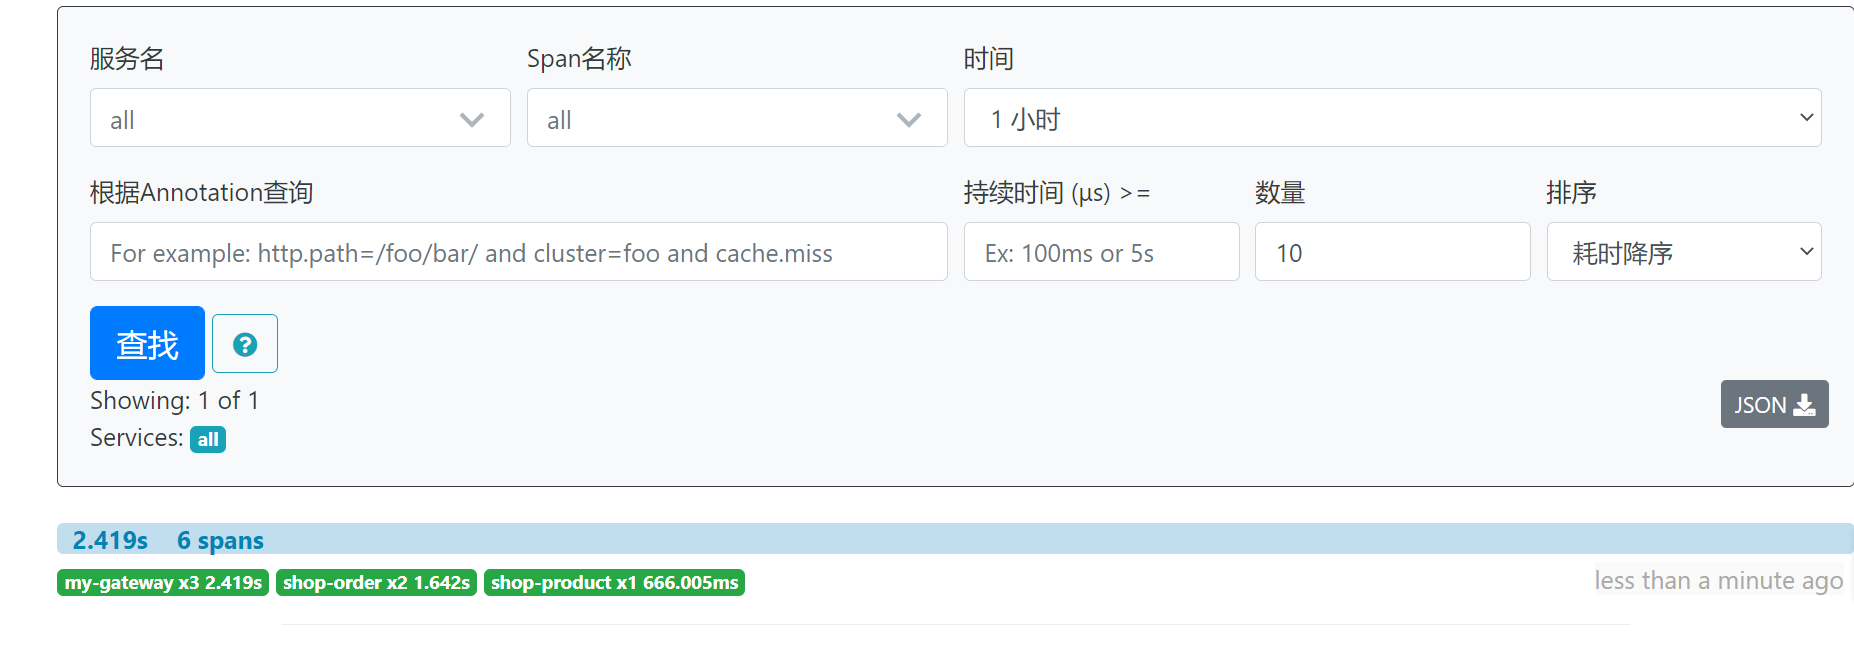
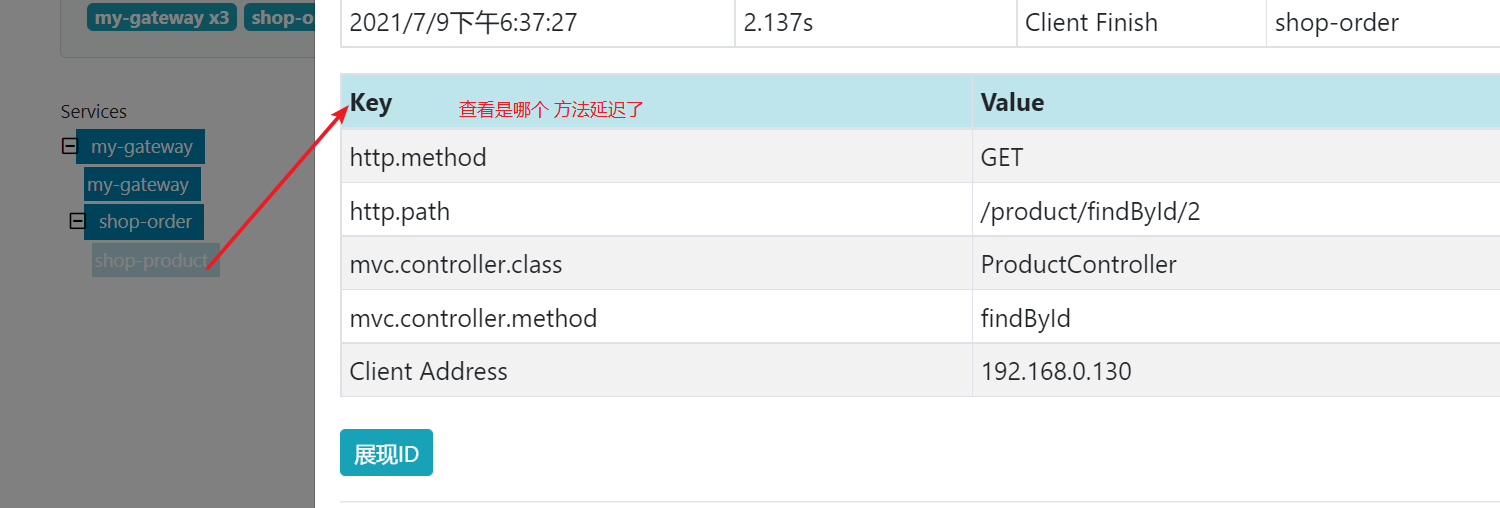
Step 5: click one of the records to observe the detailed line of one visit
4. ZipKin data persistence
Zipkin Server saves tracking data information to memory by default, but this method is not suitable for production environment. Zipkin supports persistence of tracking data into mysql database or elastic search.
Data persistence using mysql
Step 1: create a mysql data environment
CREATE TABLE IF NOT EXISTS zipkin_spans (
 `trace_id_high` BIGINT NOT NULL DEFAULT 0 COMMENT 'If non zero, this means the trace uses 128 bit traceIds instead of 64 bit',
`trace_id` BIGINT NOT NULL,
`id` BIGINT NOT NULL,
`name` VARCHAR(255) NOT NULL,
`parent_id` BIGINT,
`debug` BIT(1),
`start_ts` BIGINT COMMENT 'Span.timestamp(): epoch micros used for endTs query and to implement TTL',
`duration` BIGINT COMMENT 'Span.duration(): micros used for minDuration and maxDuration query' )
 ENGINE=InnoDB ROW_FORMAT=COMPRESSED CHARACTER SET=utf8 COLLATE utf8_general_ci;

ALTER TABLE zipkin_spans ADD UNIQUE KEY(`trace_id_high`, `trace_id`, `id`) COMMENT 'ignore insert on duplicate';
ALTER TABLE zipkin_spans ADD INDEX(`trace_id_high`, `trace_id`, `id`) COMMENT 'for joining with zipkin_annotations';
ALTER TABLE zipkin_spans ADD INDEX(`trace_id_high`, `trace_id`) COMMENT 'for getTracesByIds';
 ALTER TABLE zipkin_spans ADD INDEX(`name`) COMMENT 'for getTraces and getSpanNames';
 ALTER TABLE zipkin_spans ADD INDEX(`start_ts`) COMMENT 'for getTraces ordering and range';
CREATE TABLE IF NOT EXISTS zipkin_annotations (
 `trace_id_high` BIGINT NOT NULL DEFAULT 0 COMMENT 'If non zero, this means the trace uses 128 bit traceIds instead of 64 bit',
`trace_id` BIGINT NOT NULL COMMENT 'coincides with zipkin_spans.trace_id',
`span_id` BIGINT NOT NULL COMMENT 'coincides with zipkin_spans.id',
 `a_key` VARCHAR(255) NOT NULL COMMENT 'BinaryAnnotation.key or Annotation.value if type == -1',
`a_value` BLOB COMMENT 'BinaryAnnotation.value(), which must be smaller than 64KB',
`a_type` INT NOT NULL COMMENT 'BinaryAnnotation.type() or -1 if Annotation',
`a_timestamp` BIGINT COMMENT 'Used to implement TTL; Annotation.timestamp or zipkin_spans.timestamp',
 `endpoint_ipv4` INT COMMENT 'Null when Binary/Annotation.endpoint is null',
`endpoint_ipv6` BINARY(16) COMMENT 'Null when Binary/Annotation.endpoint is null, or no IPv6 address',
`endpoint_port` SMALLINT COMMENT 'Null when Binary/Annotation.endpoint is null',
`endpoint_service_name` VARCHAR(255) COMMENT 'Null when Binary/Annotation.endpoint is null' )
 ENGINE=InnoDB ROW_FORMAT=COMPRESSED CHARACTER SET=utf8 COLLATE utf8_general_ci;
ALTER TABLE zipkin_annotations ADD UNIQUE KEY(`trace_id_high`, `trace_id`, `span_id`, `a_key`, `a_timestamp`) COMMENT 'Ignore insert on duplicate';
ALTER TABLE zipkin_annotations ADD INDEX(`trace_id_high`, `trace_id`, `span_id`) COMMENT 'for joining with zipkin_spans';
ALTER TABLE zipkin_annotations ADD INDEX(`trace_id_high`, `trace_id`) COMMENT 'for getTraces/ByIds';
ALTER TABLE zipkin_annotations ADD INDEX(`endpoint_service_name`) COMMENT 'for getTraces and getServiceNames';

ALTER TABLE zipkin_annotations ADD INDEX(`a_type`) COMMENT 'for getTraces';
 ALTER TABLE zipkin_annotations ADD INDEX(`a_key`) COMMENT 'for getTraces';
ALTER TABLE zipkin_annotations ADD INDEX(`trace_id`, `span_id`, `a_key`) COMMENT 'for dependencies job';
CREATE TABLE IF NOT EXISTS zipkin_dependencies (
`day` DATE NOT NULL,
`parent` VARCHAR(255) NOT NULL,
`child` VARCHAR(255) NOT NULL,
 `call_count` BIGINT )
ENGINE=InnoDB ROW_FORMAT=COMPRESSED CHARACTER SET=utf8 COLLATE utf8_general_ci;
ALTER TABLE zipkin_dependencies ADD UNIQUE KEY(`day`, `parent`, `child`);
Step 2: when starting ZipKin Server, specify the mysql information to save the data
java -jar zipkin-server-2.12.9-exec.jar --STORAGE_TYPE=mysql --MYSQL_HOST=localhost --MYSQL_TCP_PORT=3306 --MYSQL_DB=zipkin --MYSQL_USER=root --MYSQL_PASS=root
Getting started with Nacos Config
Using nacos as the configuration center is actually to treat nacos as a server and each micro service as a client. We store the configuration files of each micro service on nacos, and then pull the configuration of each micro service from nacos.
Next, we take the commodity micro service as an example to learn the use of nacos config.
1. Build a nacos environment [just use the existing nacos environment]
2. Introduce nacos dependency into microservices
<dependency>
<groupId>com.alibaba.cloud</groupId>
<artifactId>spring-cloud-starter-alibaba-nacos-config</artifactId>
</dependency>
3 add the configuration of Nacos config in the micro service
Note: you cannot use the original application Instead of using YML as a configuration file, create a bootstrap YML as configuration file
Profile priority (from high to low):
bootstrap.properties -> bootstrap.yml -> application.properties -> application.yml
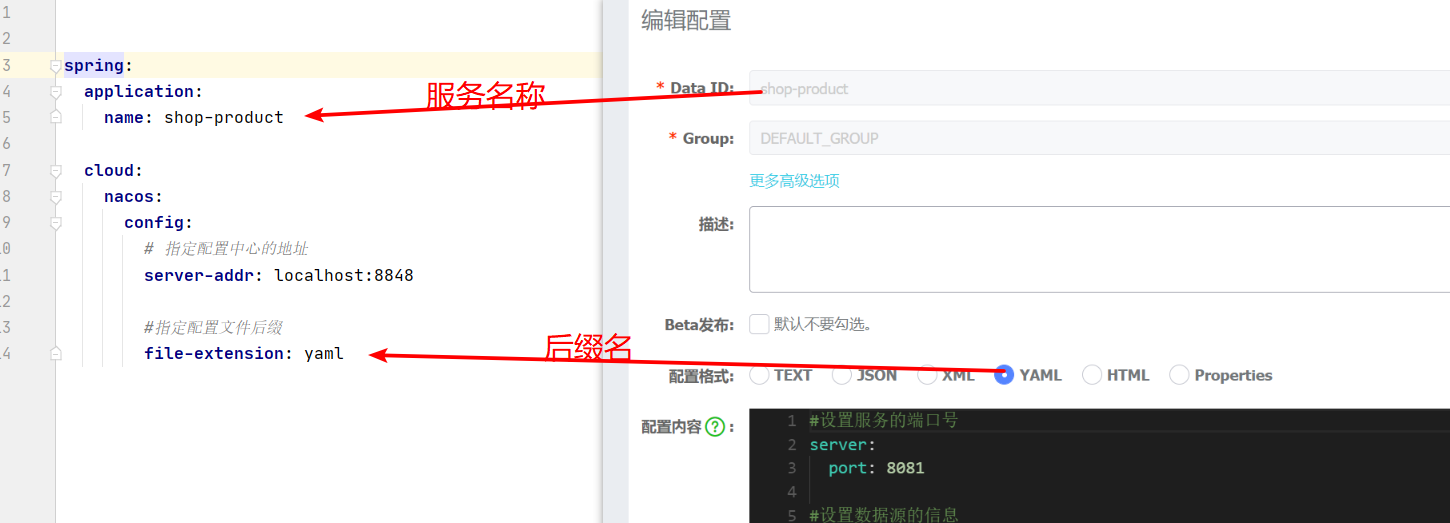
spring:
  application:
    name: shop-product

  cloud:
    nacos:
      config:
        # Specify the address of the configuration center
        server-addr: localhost:8848

        #Specify profile suffix
        file-extension: yaml
4 add configuration in nacos
Click the configuration list, click the + sign on the right to create a new configuration. In the process of creating a new configuration, pay attention to the following details:
1) The Data ID cannot be written casually. It should correspond to the data in the configuration file, as shown in the figure
2) The configuration file format should correspond to the configuration file format, and currently only YAML and Properties are supported
3) The configuration content is written in the format selected above
5 note the local application Yam, start the program for testing
If the program can still be accessed successfully, it indicates that the configuration center function of nacos has been realized