brief introduction
In the last article, we talked about using Hystrix to implement fault tolerance. In addition, Hystrix provides near real-time monitoring. This article describes how to monitor services and how to use Hystrix Dashboard to graphicalize monitoring data.
Project introduction
- sc-parent, parent module (see Spring Cloud Learning Notes (1): Eureka Registry)
- sc-eureka, Registry (see Spring Cloud Learning Notes (1): Eureka Registry)
- sc-consumer-hystrix-ribbon, consumer using Hystrix+Ribbon (see Spring Cloud Learning Notes (4): Hystrix Fault Tolerance Mechanism)
- sc-consumer-hystrix-feign, consumers using Hystrix+Feign (see Spring Cloud Learning Notes (4): Hystrix Fault Tolerance Mechanism)
- sc-hystrix-dashboard for visualizing monitoring data
- sc-turbine for aggregating monitoring data
Open Consumer Service Monitoring
1. Modify the pom.xml of consumers sc-consumer-hystrix-ribbon and sc-consumer-hystrix-feign, and add the following dependencies:
    <dependency>
        <groupId>org.springframework.boot</groupId>
        <artifactId>spring-boot-starter-actuator</artifactId>
    </dependency>
2. Modify the application.yml of consumer sc-consumer-hystrix-ribbon and sc-consumer-hystrix-feign, and add the following configuration:
management:
  endpoints:
    web:
      exposure:
        include: 'hystrix.stream'  #Exposure of hystrix.stream endpoints
3. Test access to consumer sc-consumer-hystrix-feign monitoring data
Start the registry sc-eureka and consumer sc-consumer-hystrix-feign in turn and visit http://localhost:8084/actuator/hystrix.stream. The results are as follows:
Because the consumer service is not accessed, the following consumer service is invoked here: http://localhost:8084/feign/getBookList, and then http://localhost:8084/actuator/hystrix.stream:

You can see that the monitoring data is displayed in the form of text, which is not intuitive. Here we will introduce the use of Hystrix Dashboard to visualize the monitoring data.
Visualization of monitoring data using Hystrix Dashboard
1. Create the sub-module project sc-hystrix-dashboard, pom.xml under the parent module:
<project xmlns="http://maven.apache.org/POM/4.0.0" xmlns:xsi="http://www.w3.org/2001/XMLSchema-instance" xsi:schemaLocation="http://maven.apache.org/POM/4.0.0 http://maven.apache.org/xsd/maven-4.0.0.xsd">
  <modelVersion>4.0.0</modelVersion>
  <parent>
    <groupId>com.cf</groupId>
    <artifactId>sc-parent</artifactId>
    <version>0.0.1-SNAPSHOT</version>
  </parent>
  <artifactId>sc-hystrix-dashboard</artifactId>

  <dependencies>
    <dependency>
        <groupId>org.springframework.cloud</groupId>
        <artifactId>spring-cloud-starter-netflix-hystrix-dashboard</artifactId>
    </dependency>
  </dependencies>
</project>
2. Create the startup class dashboard.DashBoardApplication:
package dashboard;
import org.springframework.boot.SpringApplication;
import org.springframework.boot.autoconfigure.SpringBootApplication;
import org.springframework.cloud.netflix.hystrix.dashboard.EnableHystrixDashboard;

@SpringBootApplication
@EnableHystrixDashboard
public class DashBoardApplication {
    public static void main(String[] args) {
        SpringApplication.run(DashBoardApplication.class, args);
    }
}
3. Create application.yml:
server:
  port: 8086

spring:
  application:
    name: sc-hystrix-dashboard
4. test
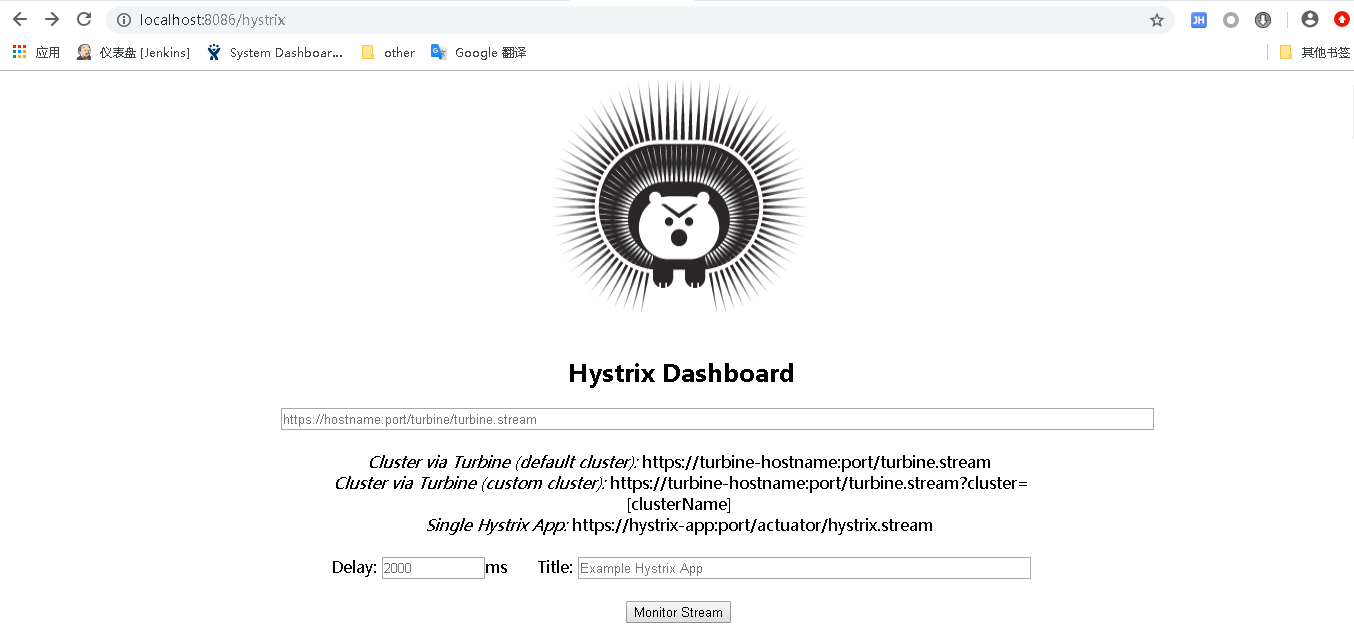
After starting sc-hystrix-dashboard, visiting http://localhost:8086/hystrix will display the main interface of Hystrix Dashboard:
Then you need to add consumer sc-consumer-hystrix-feign monitoring data to Hystrix Dashboard. Start the registry sc-eureka and consumer sc-consumer-hystrix-feign in turn, enter the address of the monitoring data into the text box of the main interface of Hystrix Dashboard, click Monitor Stream, and then repeatedly visit the consumer service http://localhost:8084/feign/getBookList. Hystrix Dashboard shows as follows:

Reference is made to the following figure for the presentation of indicators on the interface: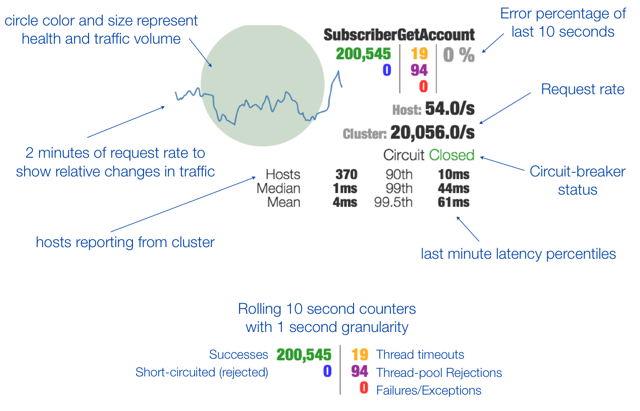
Aggregate monitoring data using Turbine
/ The hystrix.stream endpoint can only monitor a single service instance. If you need to view other service instance monitoring information, you need to switch the address you want to monitor in Hystrix Dashboard. The data of all / hystrix.stream endpoints can be aggregated into a combined / turbine.stream through Turbine, and then the monitoring information of all services can be viewed in Hystrix Dashboard.
1. Modify the application.yml of consumer sc-consumer-hystrix-ribbon and sc-consumer-hystrix-feign, and set registerWithEureka to true or remove the configuration directly (default is true). Because Turbine needs to get the address information of the service from Eureka before it can get the monitoring data of the service, the consumer service needs to register with the Eureka registry.
eureka:
  client:
    #registerWithEureka: false
    serviceUrl:
      defaultZone: http://localhost:8080/eureka/
2. Create the sub-module project sc-turbine, pom.xml under the parent module:
<project xmlns="http://maven.apache.org/POM/4.0.0" xmlns:xsi="http://www.w3.org/2001/XMLSchema-instance" xsi:schemaLocation="http://maven.apache.org/POM/4.0.0 http://maven.apache.org/xsd/maven-4.0.0.xsd">
  <modelVersion>4.0.0</modelVersion>
  <parent>
    <groupId>com.cf</groupId>
    <artifactId>sc-parent</artifactId>
    <version>0.0.1-SNAPSHOT</version>
  </parent>
  <artifactId>sc-turbine</artifactId>

  <dependencies>
    <dependency>
        <groupId>org.springframework.cloud</groupId>
        <artifactId>spring-cloud-starter-netflix-turbine</artifactId>
    </dependency>
  </dependencies>
</project>
3. Create the boot class turbine.TurbineApplication:
package turbine;
import org.springframework.boot.SpringApplication;
import org.springframework.boot.autoconfigure.SpringBootApplication;
import org.springframework.cloud.netflix.turbine.EnableTurbine;

@SpringBootApplication
@EnableTurbine
public class TurbineApplication {
    public static void main(String[] args) {
        SpringApplication.run(TurbineApplication.class, args);
    }
}
4. Create application.yml:
server:
  port: 8087

spring:
  application:
    name: sc-turbine

eureka:
  client:
    registerWithEureka: false
    serviceUrl:
      defaultZone: http://localhost:8080/eureka/

turbine:
  appConfig: sc-consumer-hystrix-ribbon,sc-consumer-hystrix-feign #Specify the service name to monitor
  clusterNameExpression: "'default'"
5. test
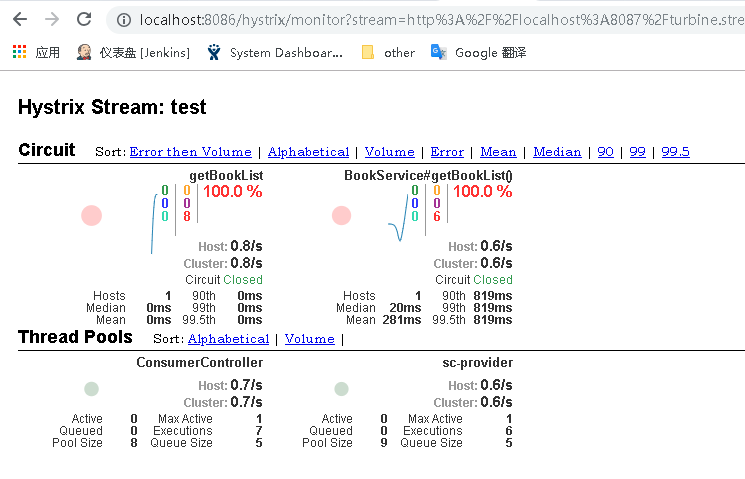
Start the registry sc-eureka, consumer sc-consumer-hystrix-feign, consumer sc-consumer-hystrix-ribbon, sc-turbine, sc-hystrix-dashboard in turn. Visit http://localhost:8086/hystrix to enter the main interface of Hystrix Dashboard, and then enter http://localhost:808 in the text box of the main interface of Hystrix Dashboard. 7/turbine.stream, click Monitor Stream to enter the monitoring interface and visit two consumer services repeatedly. The monitoring interface will display two consumer monitoring information: