Write in front
Spring MVC is an old project... It hurts
Our project uses spring mvc4 x. prometheus is used for time series database and grafana is used for dashboard.
There are a lot of materials about prometheus for spring boot on the Internet, and there are also many templates for grafana dashboard for spring boot. Unfortunately, no one cares about spring MVC... If you want to use the existing micrometer registry Prometheus to expose service indicators and directly apply the springboot mode in the template dashboard of grafana, you have to look at the source code of micrometer registry Prometheus.
Therefore, this tutorial will first explain the next part of the source code, and then tell you the configuration of Prometheus for spring MVC.
Environment of this case
micrometer-registry-prometheus:1.1.0
jdk 1.8
springmvc 4.x
tomcat 8.x
Interpretation of core package functions
Official source code GitHub: https://github.com/micrometer-metrics/micrometer
Enter the micrometer core to view it, focusing on several core classes
- Registrar MeterRegistry
MeterRegistry is the base class (abstract class) of all registries, and all registrars should inherit from it
public abstract class MeterRegistry {
    protected final Clock clock;
    private final Object meterMapLock = new Object();
    private volatile MeterFilter[] filters = new MeterFilter[0];
    private final List<Consumer<Meter>> meterAddedListeners = new CopyOnWriteArrayList<>();
    private final List<Consumer<Meter>> meterRemovedListeners = new CopyOnWriteArrayList<>();
    private final Config config = new Config();
    private final More more = new More();
    //...
}
For example, the registration class of prometheus is
package io.micrometer.prometheus;
public class PrometheusMeterRegistry extends MeterRegistry {
    private final CollectorRegistry registry;
    private final ConcurrentMap<String, MicrometerCollector> collectorMap;
    private final PrometheusConfig prometheusConfig;
    //...
}
- Binding interface MeterBinder for internal measurement of container
public interface MeterBinder {
    void bindTo(@NonNull MeterRegistry registry);
}
MeterBinder can bind internal measurement data to a registry, such as jvm's gc indicator JvmGcMetrics
public class JvmGcMetrics implements MeterBinder {
    public void bindTo(MeterRegistry registry) {
        AtomicLong maxDataSize = new AtomicLong(0L);
        Gauge.builder("jvm.gc.max.data.size", maxDataSize, AtomicLong::get).tags(this.tags).description("Max size of old generation memory pool").baseUnit("bytes").register(registry);
        // ...
    }
}
- Bind the monitoring indicator MeterBinder to the registry
public void initRegistry() {
    PrometheusMeterRegistry registry = new PrometheusMeterRegistry();

    JvmGcMetrics jvmGcMetrics = new JvmGcMetrics();
    jvmGcMetrics.bindTo(registry);
}
-
Class inheritance diagram
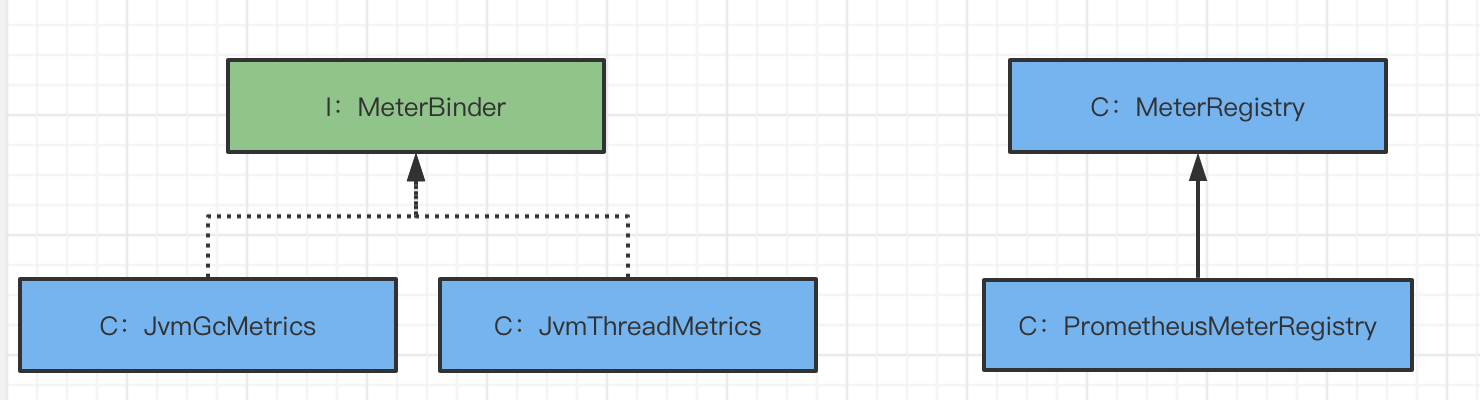
-
MeterRegistry common implementation classes
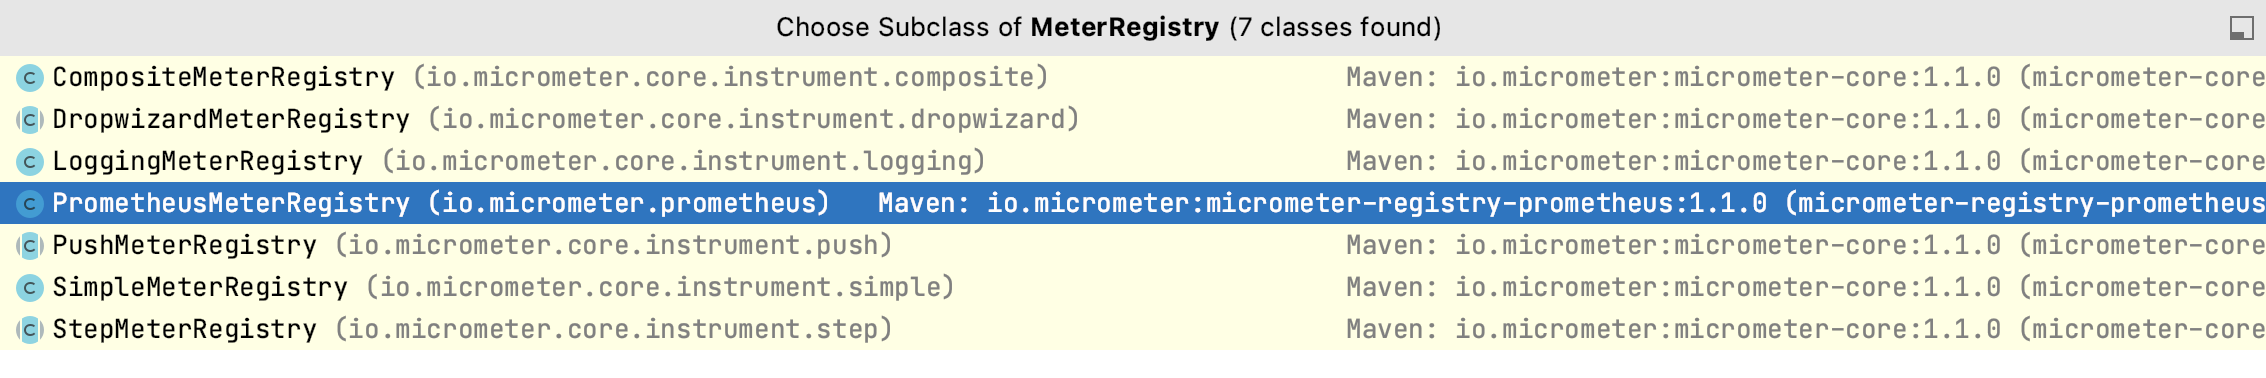
-
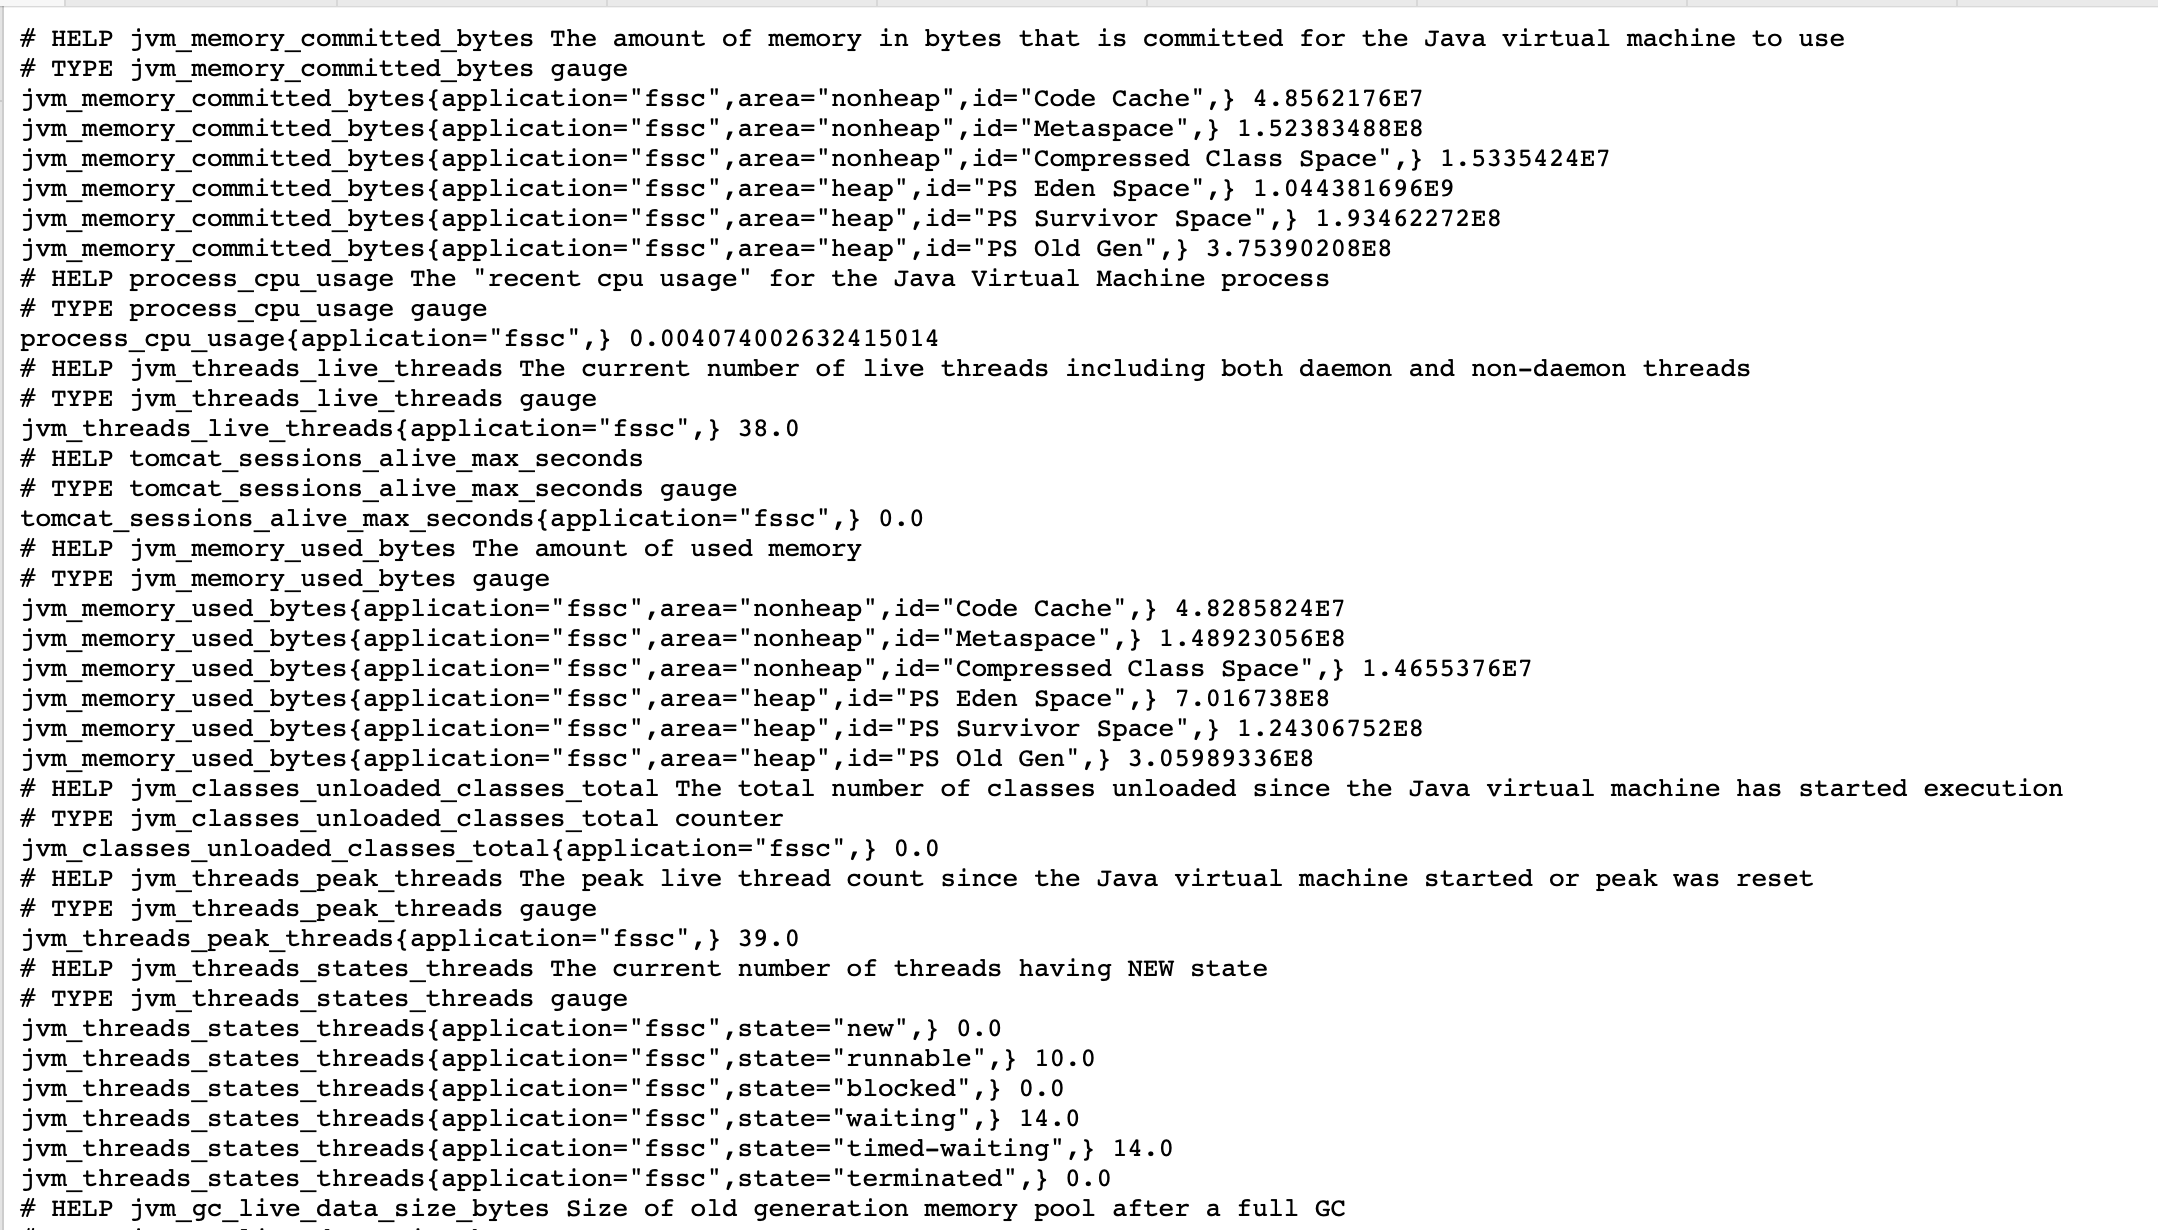
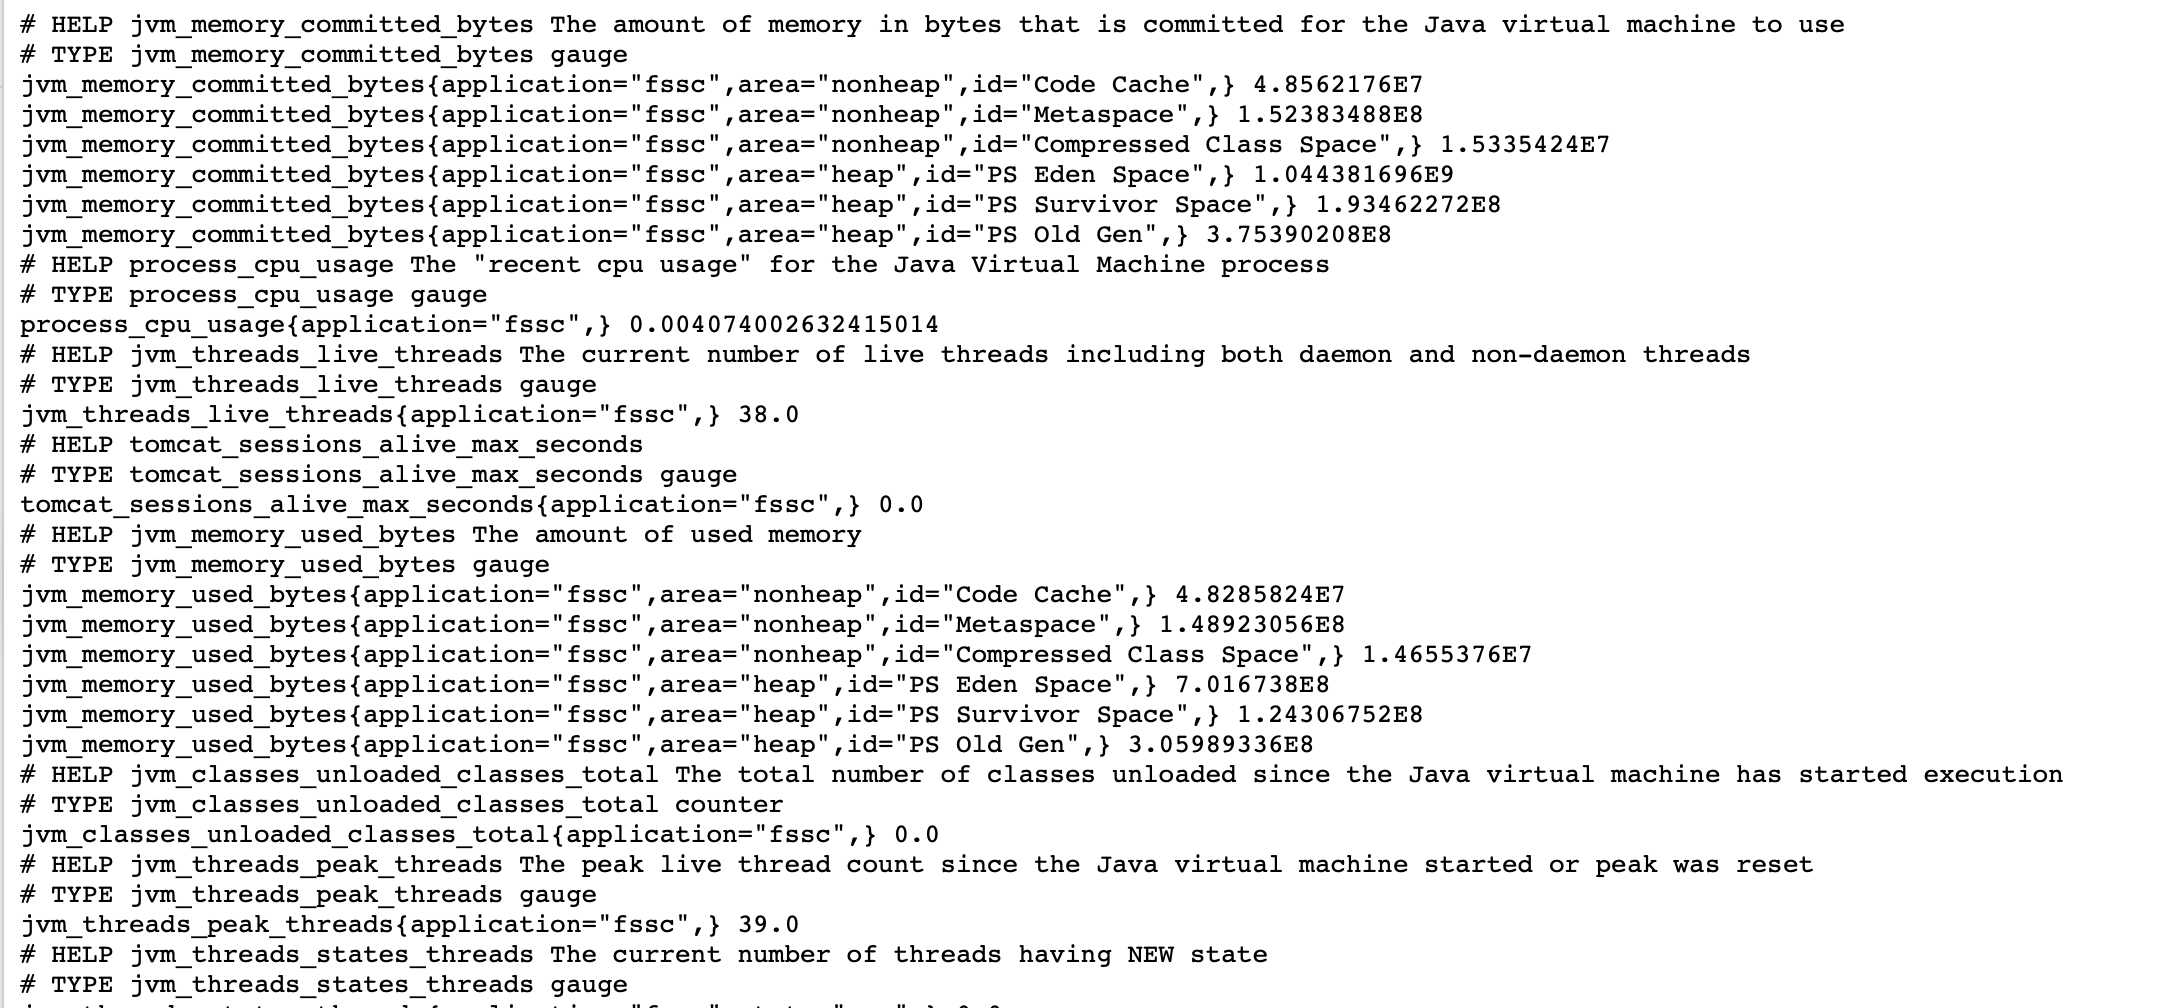
Output index data
String response = MeterRegistry.scrape();
Return the response to the front end, as shown below
Spring MVC integrates prometheus and uses the metrics provided by default
Such a large dashboard template can be implemented under springboot. It is introduced in both official tutorials and major forums.
However, the introduction to spring MVC is so poor that you can't even find it in the dashboard template of grafana. Therefore, this chapter will tell you how spring MVC exposes data indicators.
The principle of meterregistry has been introduced above. Please read the following code carefully
pom.xml management dependency
<dependency>
    <groupId>io.micrometer</groupId>
    <artifactId>micrometer-registry-prometheus</artifactId>
    <version>1.1.0</version>
</dependency>
web.xml configuration indicator exposure servlet
<!-- Exposure service monitoring indicators -->
<servlet>
    <servlet-name>prometheus</servlet-name>
    <servlet-class>com.epoch.wan37.servlet.PrometheusMetricsServlet</servlet-class>
</servlet>
<servlet-mapping>
    <servlet-name>prometheus</servlet-name>
    <url-pattern>/prometheus</url-pattern>
</servlet-mapping>
Configure servlet
package com.epoch.wan37.servlet;

import com.netflix.hystrix.HystrixMetrics;
import io.micrometer.core.instrument.Clock;
import io.micrometer.core.instrument.Counter;
import io.micrometer.core.instrument.MockClock;
import io.micrometer.core.instrument.binder.MeterBinder;
import io.micrometer.core.instrument.binder.cache.*;
import io.micrometer.core.instrument.binder.db.DatabaseTableMetrics;
import io.micrometer.core.instrument.binder.db.PostgreSQLDatabaseMetrics;
import io.micrometer.core.instrument.binder.jetty.JettyServerThreadPoolMetrics;
import io.micrometer.core.instrument.binder.jetty.JettyStatisticsMetrics;
import io.micrometer.core.instrument.binder.jpa.HibernateMetrics;
import io.micrometer.core.instrument.binder.jvm.*;
import io.micrometer.core.instrument.binder.kafka.KafkaConsumerMetrics;
import io.micrometer.core.instrument.binder.logging.Log4j2Metrics;
import io.micrometer.core.instrument.binder.logging.LogbackMetrics;
import io.micrometer.core.instrument.binder.system.FileDescriptorMetrics;
import io.micrometer.core.instrument.binder.system.ProcessorMetrics;
import io.micrometer.core.instrument.binder.system.UptimeMetrics;
import io.micrometer.core.instrument.binder.tomcat.TomcatMetrics;
import io.micrometer.prometheus.PrometheusConfig;
import io.micrometer.prometheus.PrometheusMeterRegistry;
import io.micrometer.prometheus.PrometheusRenameFilter;
import io.prometheus.client.CollectorRegistry;
import io.prometheus.client.exporter.common.TextFormat;
import org.apache.catalina.Manager;
import org.apache.catalina.session.StandardManager;
import org.springframework.beans.factory.annotation.Value;
import org.springframework.context.annotation.Configuration;

import javax.annotation.PostConstruct;
import javax.servlet.ServletException;
import javax.servlet.http.HttpServlet;
import javax.servlet.http.HttpServletRequest;
import javax.servlet.http.HttpServletResponse;
import java.io.IOException;
import java.io.PrintWriter;
import java.util.Collections;
import java.util.HashSet;
import java.util.Set;

/**
 * @desc describe
 * @auther winnie
 * @date 2021/8/20
 */
@Configuration
public class PrometheusMetricsServlet extends HttpServlet {
    @Value("${spring.application.name}")
    private String appName;

    private PrometheusMeterRegistry registry;
    private Set<MeterBinder> meterBinderSet = new HashSet<>();
    /**
     * Initialize indicator registrar
     */
    @PostConstruct
    public void initRegistry() {
        PrometheusConfig prometheusConfig = PrometheusConfig.DEFAULT;
        CollectorRegistry defaultRegistry = CollectorRegistry.defaultRegistry;
        Clock clock = new MockClock();
        registry = new PrometheusMeterRegistry(prometheusConfig,defaultRegistry,clock);
        // Configure app name
        registry.config().commonTags("application",appName);

        // Initialize monitoring indicators
        initMetrics();

        // Indicator binding registrar
        meterBinderSet.forEach(meterBinder -> meterBinder.bindTo(registry));
    }

    /**
     * Initialize indicators and configure them according to project needs. The following configurations are io Prometheus is provided by default
     */
    private void initMetrics() {
        // jvm metrics
        JvmGcMetrics jvmGcMetrics = new JvmGcMetrics();
        meterBinderSet.add(jvmGcMetrics);
        JvmThreadMetrics jvmThreadMetrics = new JvmThreadMetrics();
        meterBinderSet.add(jvmThreadMetrics);
        JvmMemoryMetrics jvmMemoryMetrics = new JvmMemoryMetrics();
        meterBinderSet.add(jvmMemoryMetrics);
        ClassLoaderMetrics classLoaderMetrics = new ClassLoaderMetrics();
        meterBinderSet.add(classLoaderMetrics);
//        DiskSpaceMetrics diskSpaceMetrics = new DiskSpaceMetrics();
//        ExecutorServiceMetrics executorServiceMetrics = new ExecutorServiceMetrics();
        // Cache index
//        CacheMeterBinder cacheMeterBinder = new CacheMeterBinder();
//        CaffeineCacheMetrics caffeineCacheMetrics = new CaffeineCacheMetrics();
//        GuavaCacheMetrics guavaCacheMetrics = new GuavaCacheMetrics();
//        HazelcastCacheMetrics hazelcastCacheMetrics = new HazelcastCacheMetrics();
//        JCacheMetrics jCacheMetrics = new JCacheMetrics();
        // DB index
//        DatabaseTableMetrics databaseTableMetrics = new DatabaseTableMetrics();
//        PostgreSQLDatabaseMetrics postgreSQLDatabaseMetrics = new PostgreSQLDatabaseMetrics();
        // System index
        FileDescriptorMetrics fileDescriptorMetrics = new FileDescriptorMetrics();
        meterBinderSet.add(fileDescriptorMetrics);
        ProcessorMetrics processorMetrics = new ProcessorMetrics();
        meterBinderSet.add(processorMetrics);
        UptimeMetrics uptimeMetrics = new UptimeMetrics();
        meterBinderSet.add(uptimeMetrics);
        // logging indicator
        Log4j2Metrics log4j2Metrics = new Log4j2Metrics();
        meterBinderSet.add(log4j2Metrics);
//        LogbackMetrics logbackMetrics = new LogbackMetrics();
        // jetty index
//        JettyServerThreadPoolMetrics jettyServerThreadPoolMetrics = new JettyServerThreadPoolMetrics();
//        JettyStatisticsMetrics jettyStatisticsMetrics = new JettyStatisticsMetrics();
        // tomcat index
        Manager standardManager = new StandardManager();
        TomcatMetrics tomcatMetrics = new TomcatMetrics(standardManager, Collections.EMPTY_LIST);
        meterBinderSet.add(tomcatMetrics);
        // kafka index
//        KafkaConsumerMetrics kafkaConsumerMetrics = new KafkaConsumerMetrics();
        // jpa index
//        HibernateMetrics hibernateMetrics = new HibernateMetrics();
        // hystrix index
//        HystrixMetrics hystrixMetrics = new HystrixMetrics();
    }

    @Override
    protected void doGet(HttpServletRequest req, HttpServletResponse resp) throws ServletException, IOException {
        PrintWriter writer = resp.getWriter();
        try {
            String response = registry.scrape();
            writer.write(response);
            writer.flush();
        } catch (Exception e) {
            e.printStackTrace();
        } finally {
            writer.close();
        }
    }

    @Override
    protected void doPost(HttpServletRequest req, HttpServletResponse resp) throws ServletException, IOException {
        this.doGet(req, resp);
    }
}
Where, ${spring.application.name}: is the name of your app
Start the tomcat container and test it
${TOMCAT_HOME}/bin/startup.sh
Access in browser
http://${yourHostname}:${port}/${ContextPath}/prometheus
If the following information appears, our service indicators have been exposed
The next operation is very simple, that is, we expose the index api to prometheus to listen
prometheus.yml
scrape_configs:
  - job_name: fssc
  metrics_path: '/fssc/prometheus'
  static_configs:
    - targets: ['10.16.16.202:8081']
job_name: prometheus task name
Replace the ip and port with your own services, and prometheus will visit 10.16 16.202:8081 / FSSC / prometheus obtain the index data, persist it, and present the data to you through grafana.
Restart prometheus.
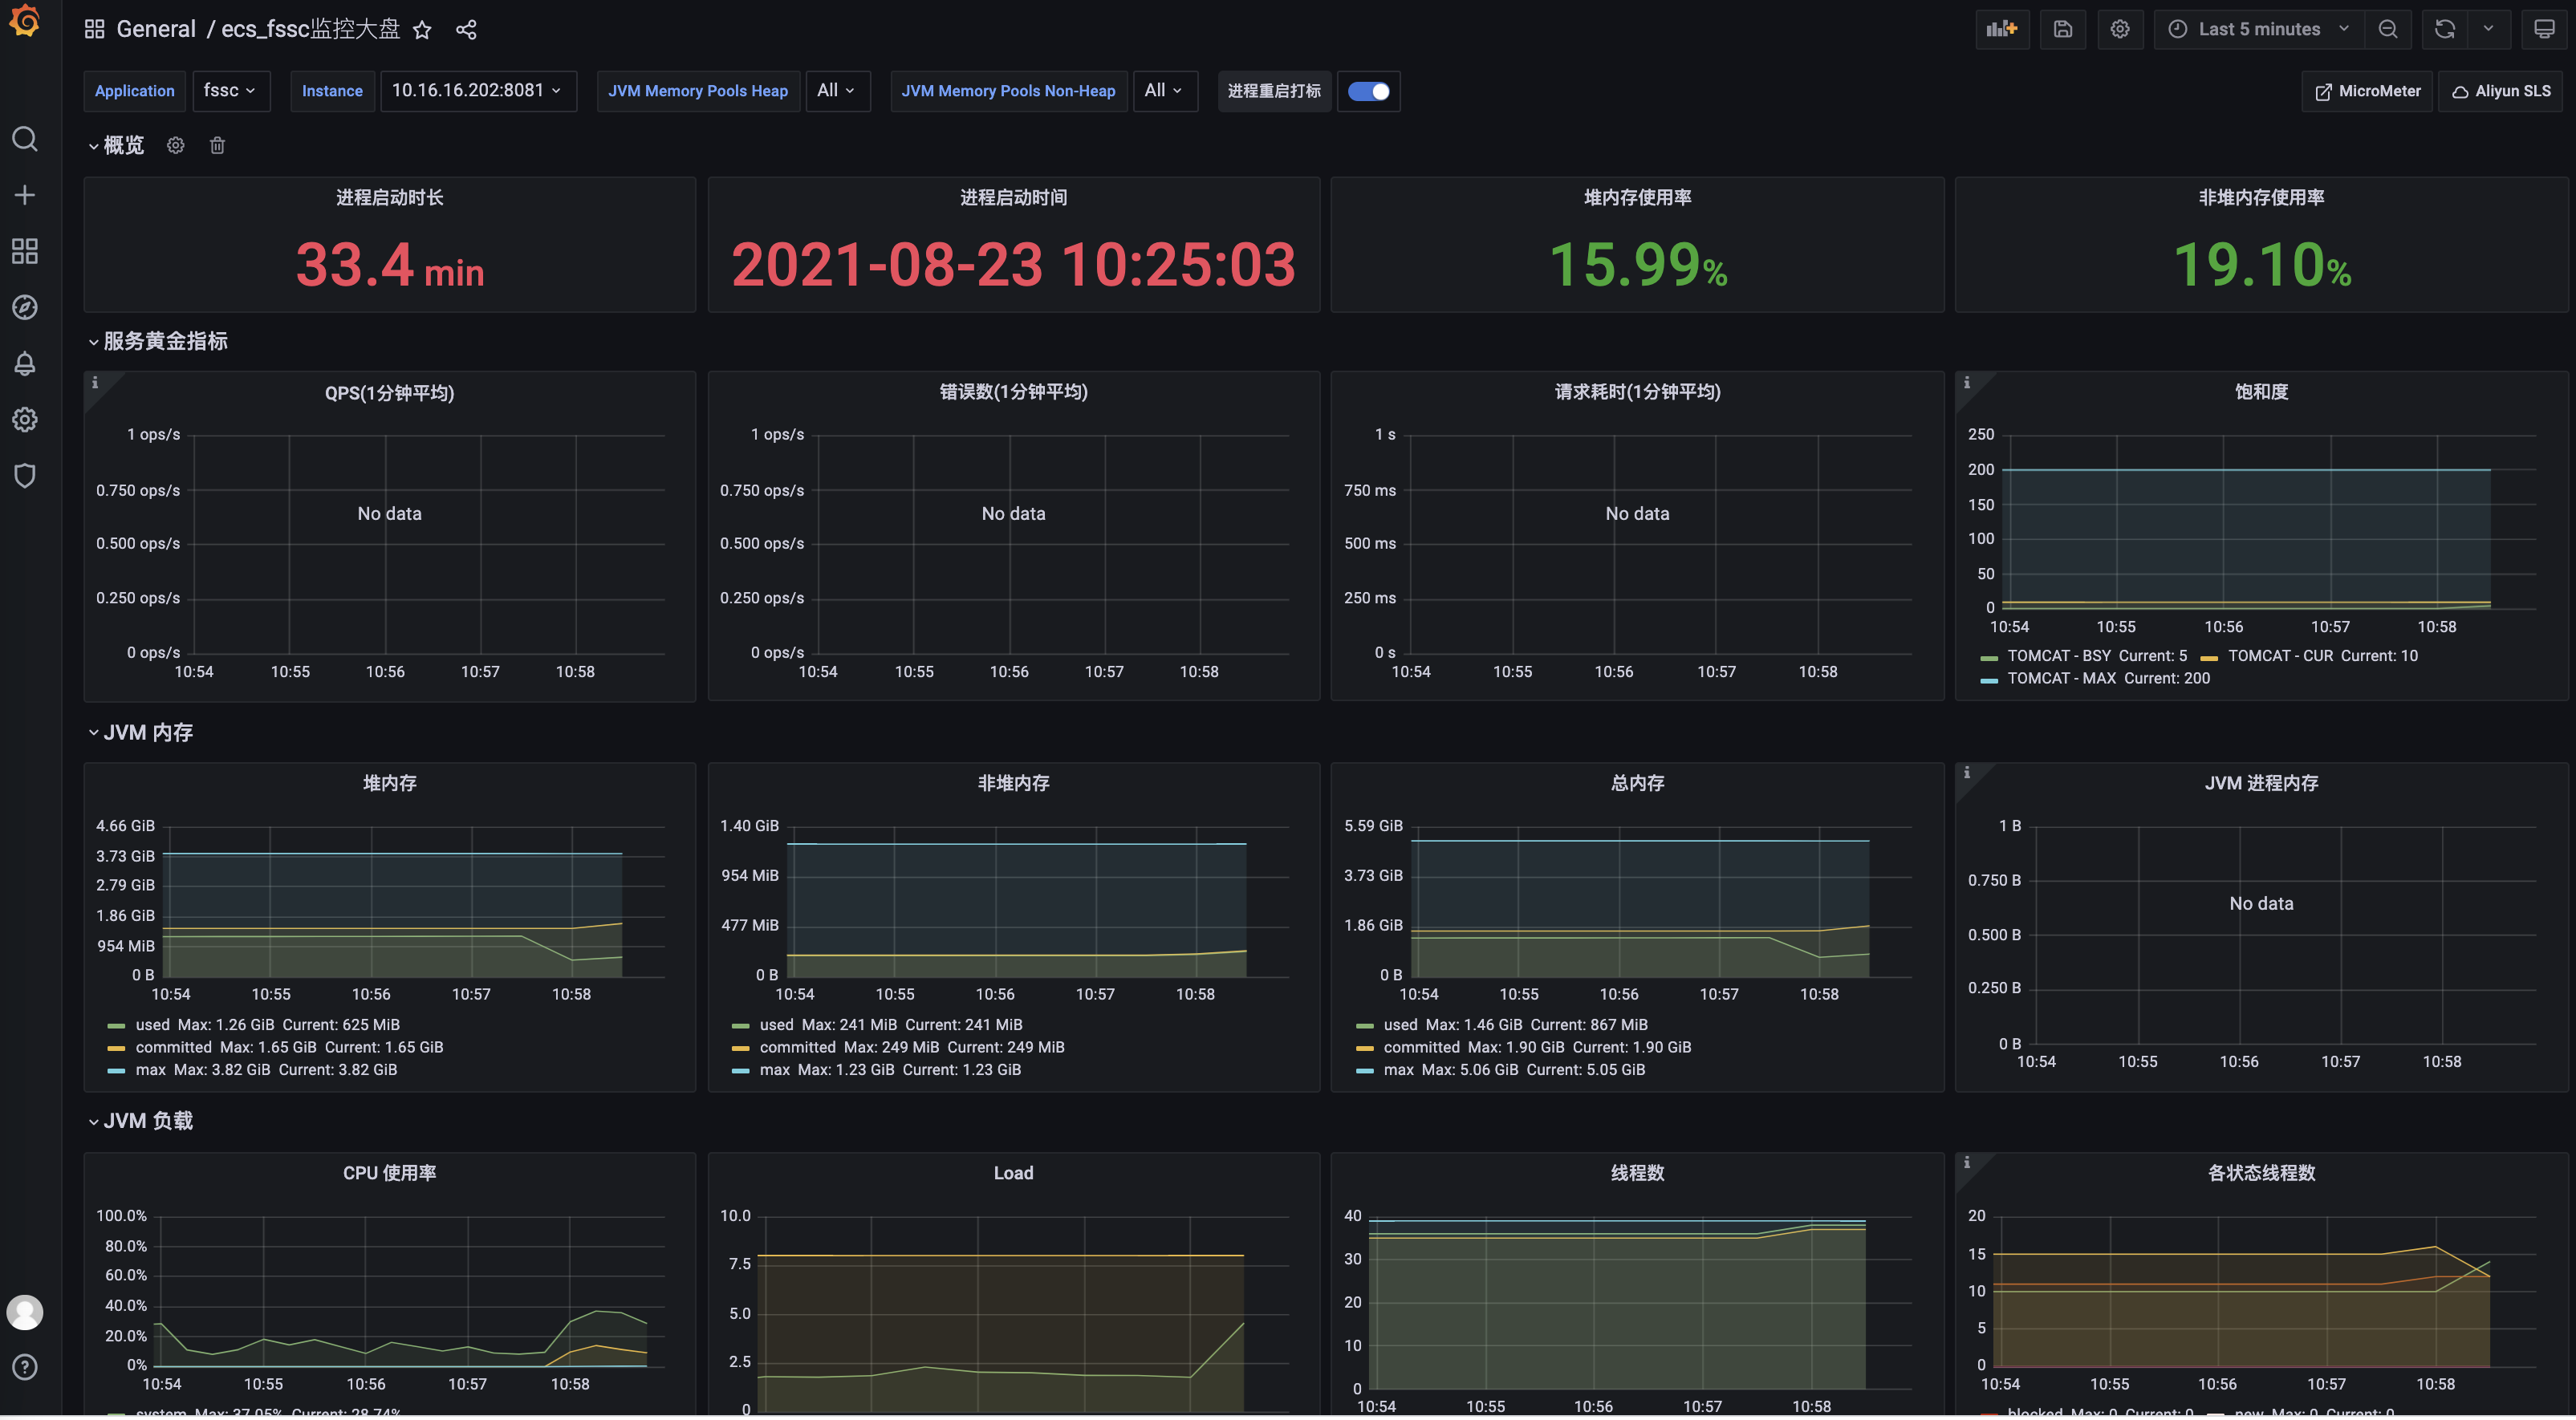
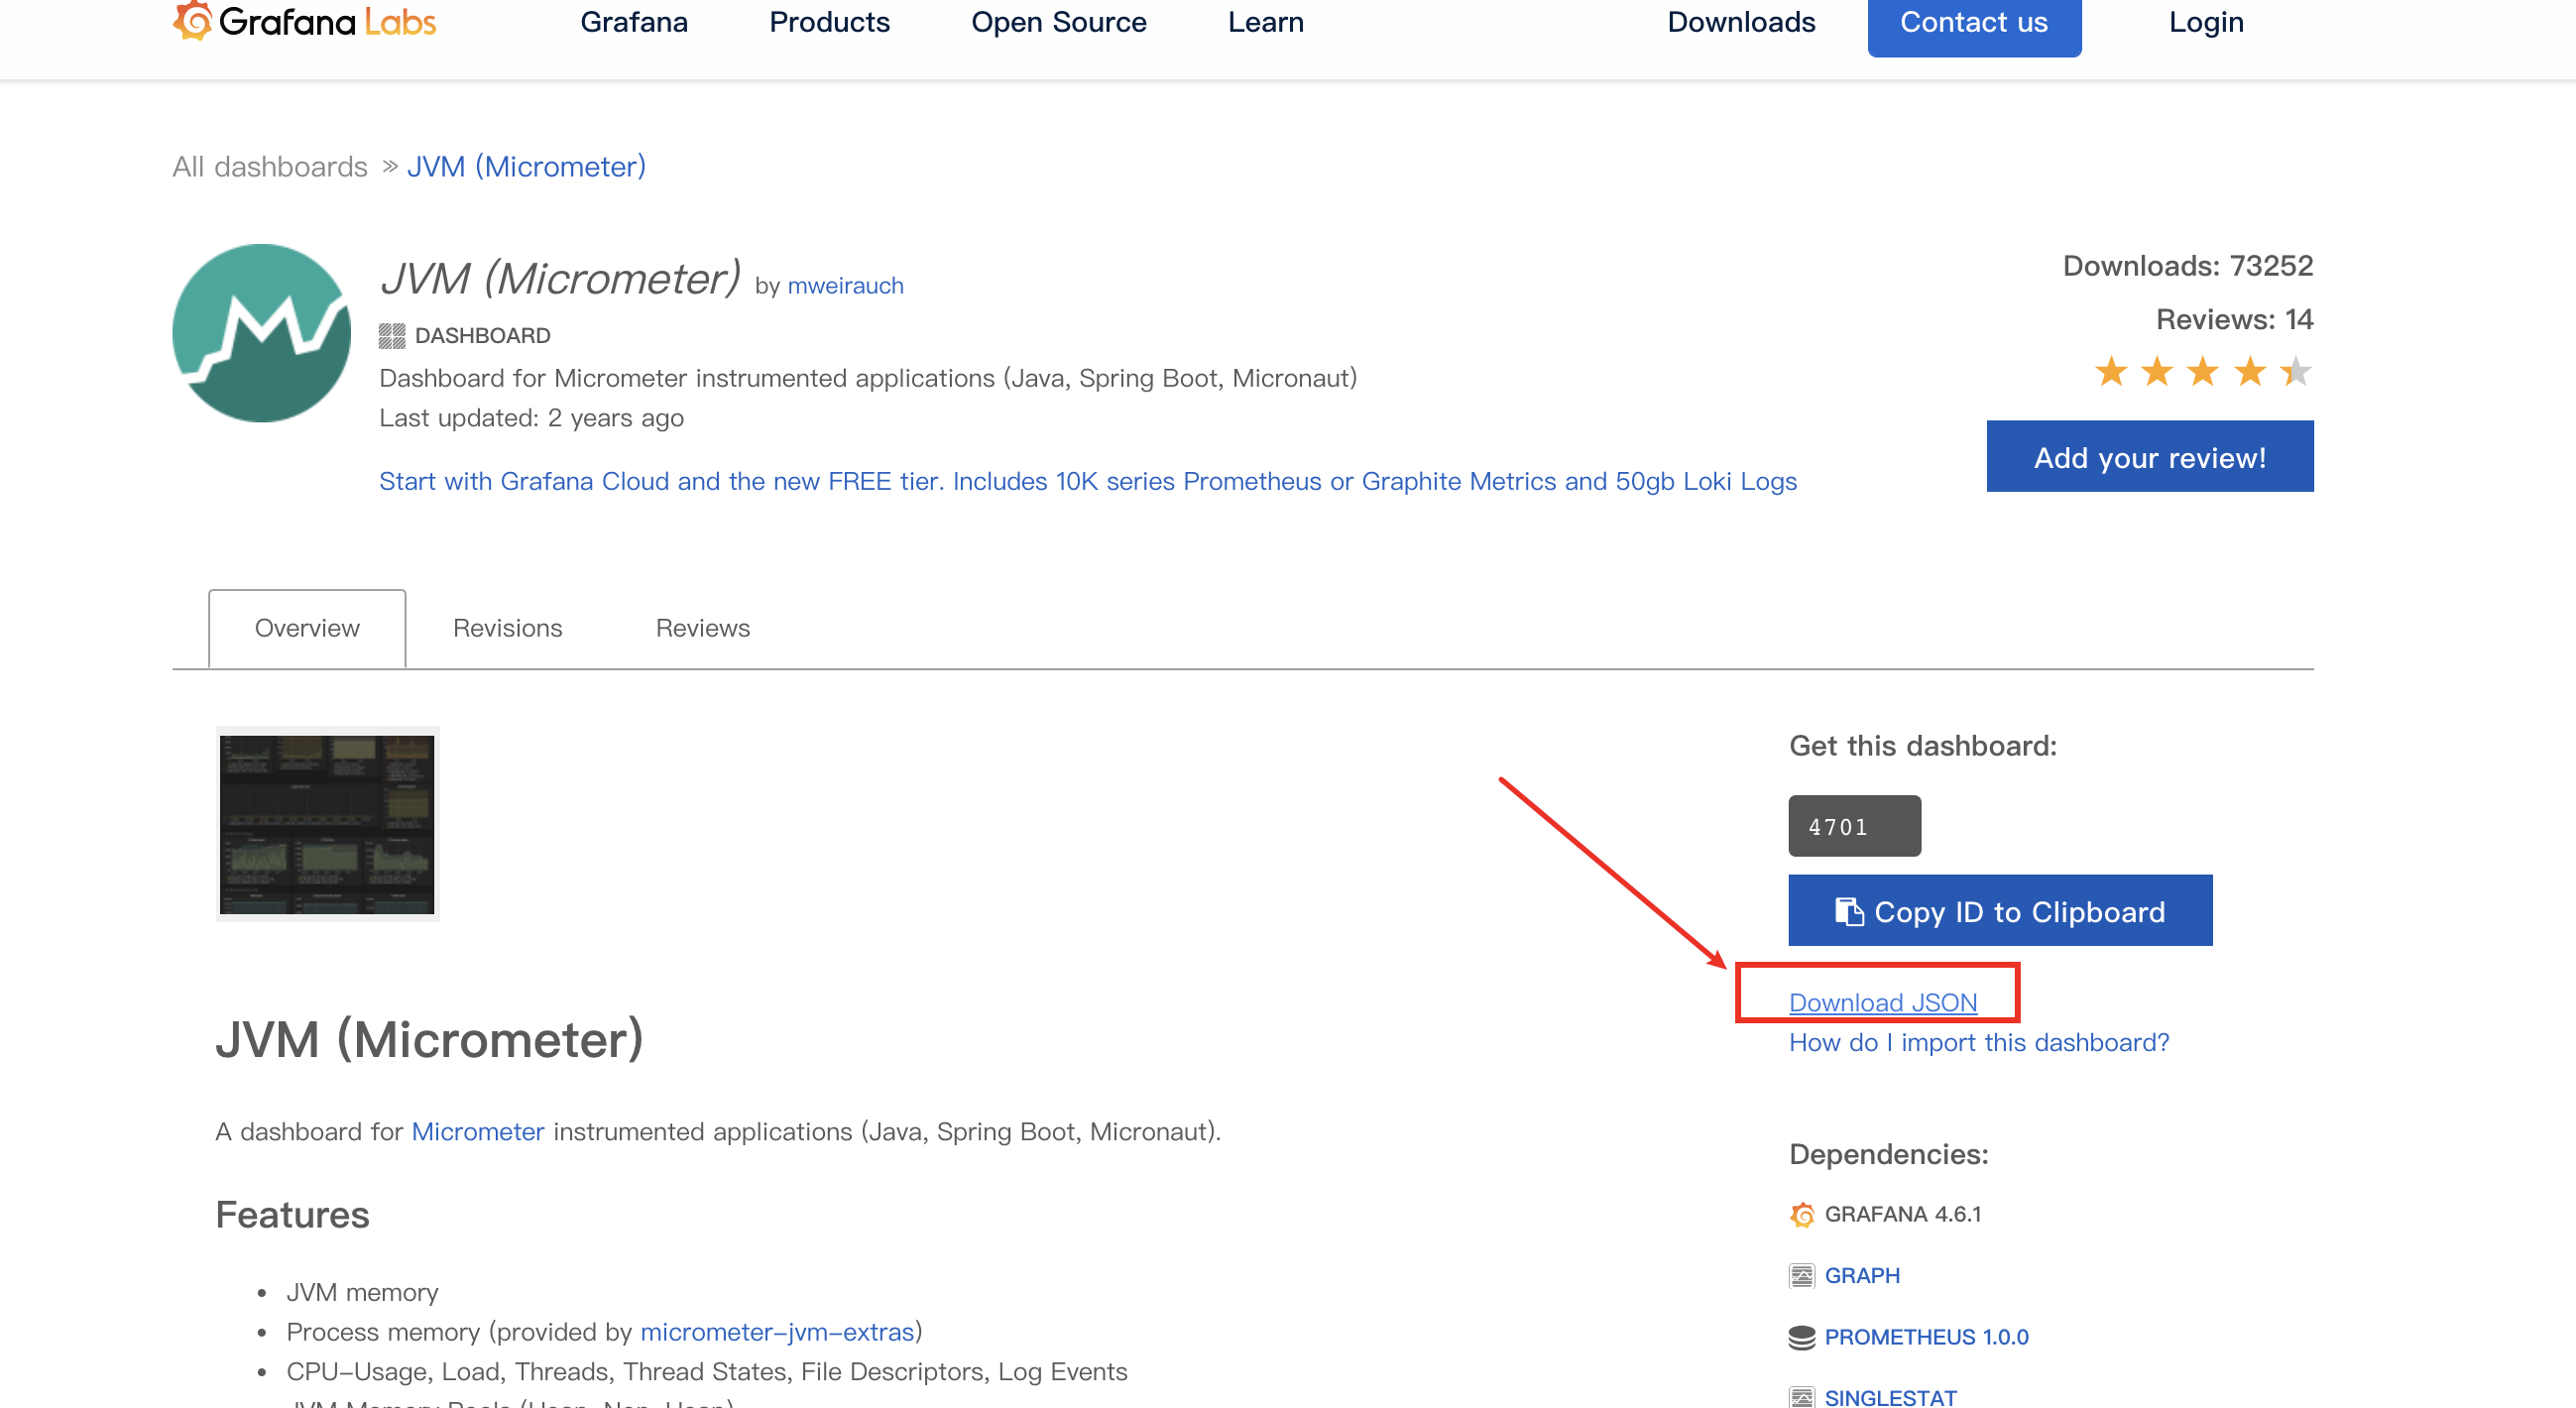
Configuring the grafana instrument cluster
Official recommendation: https://grafana.com/grafana/dashboards/4701
-
Download json file
-
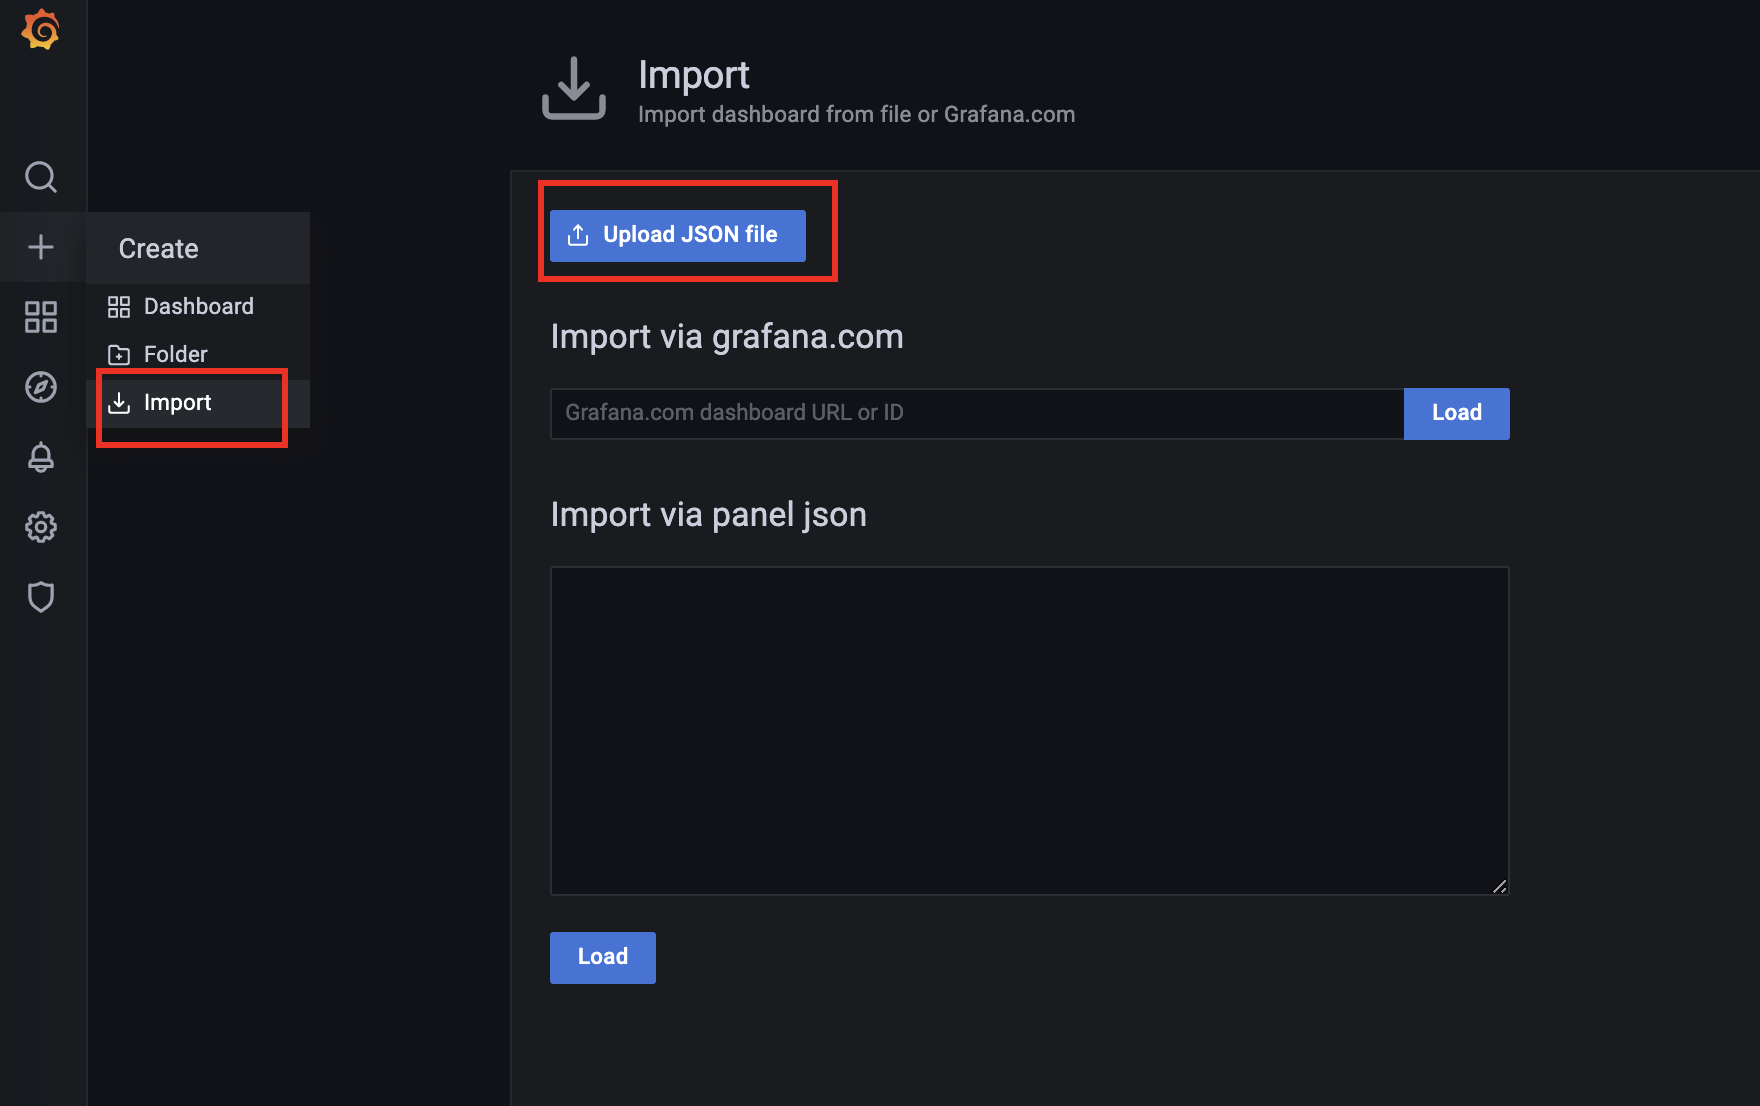
Import into grafana and upload the json file
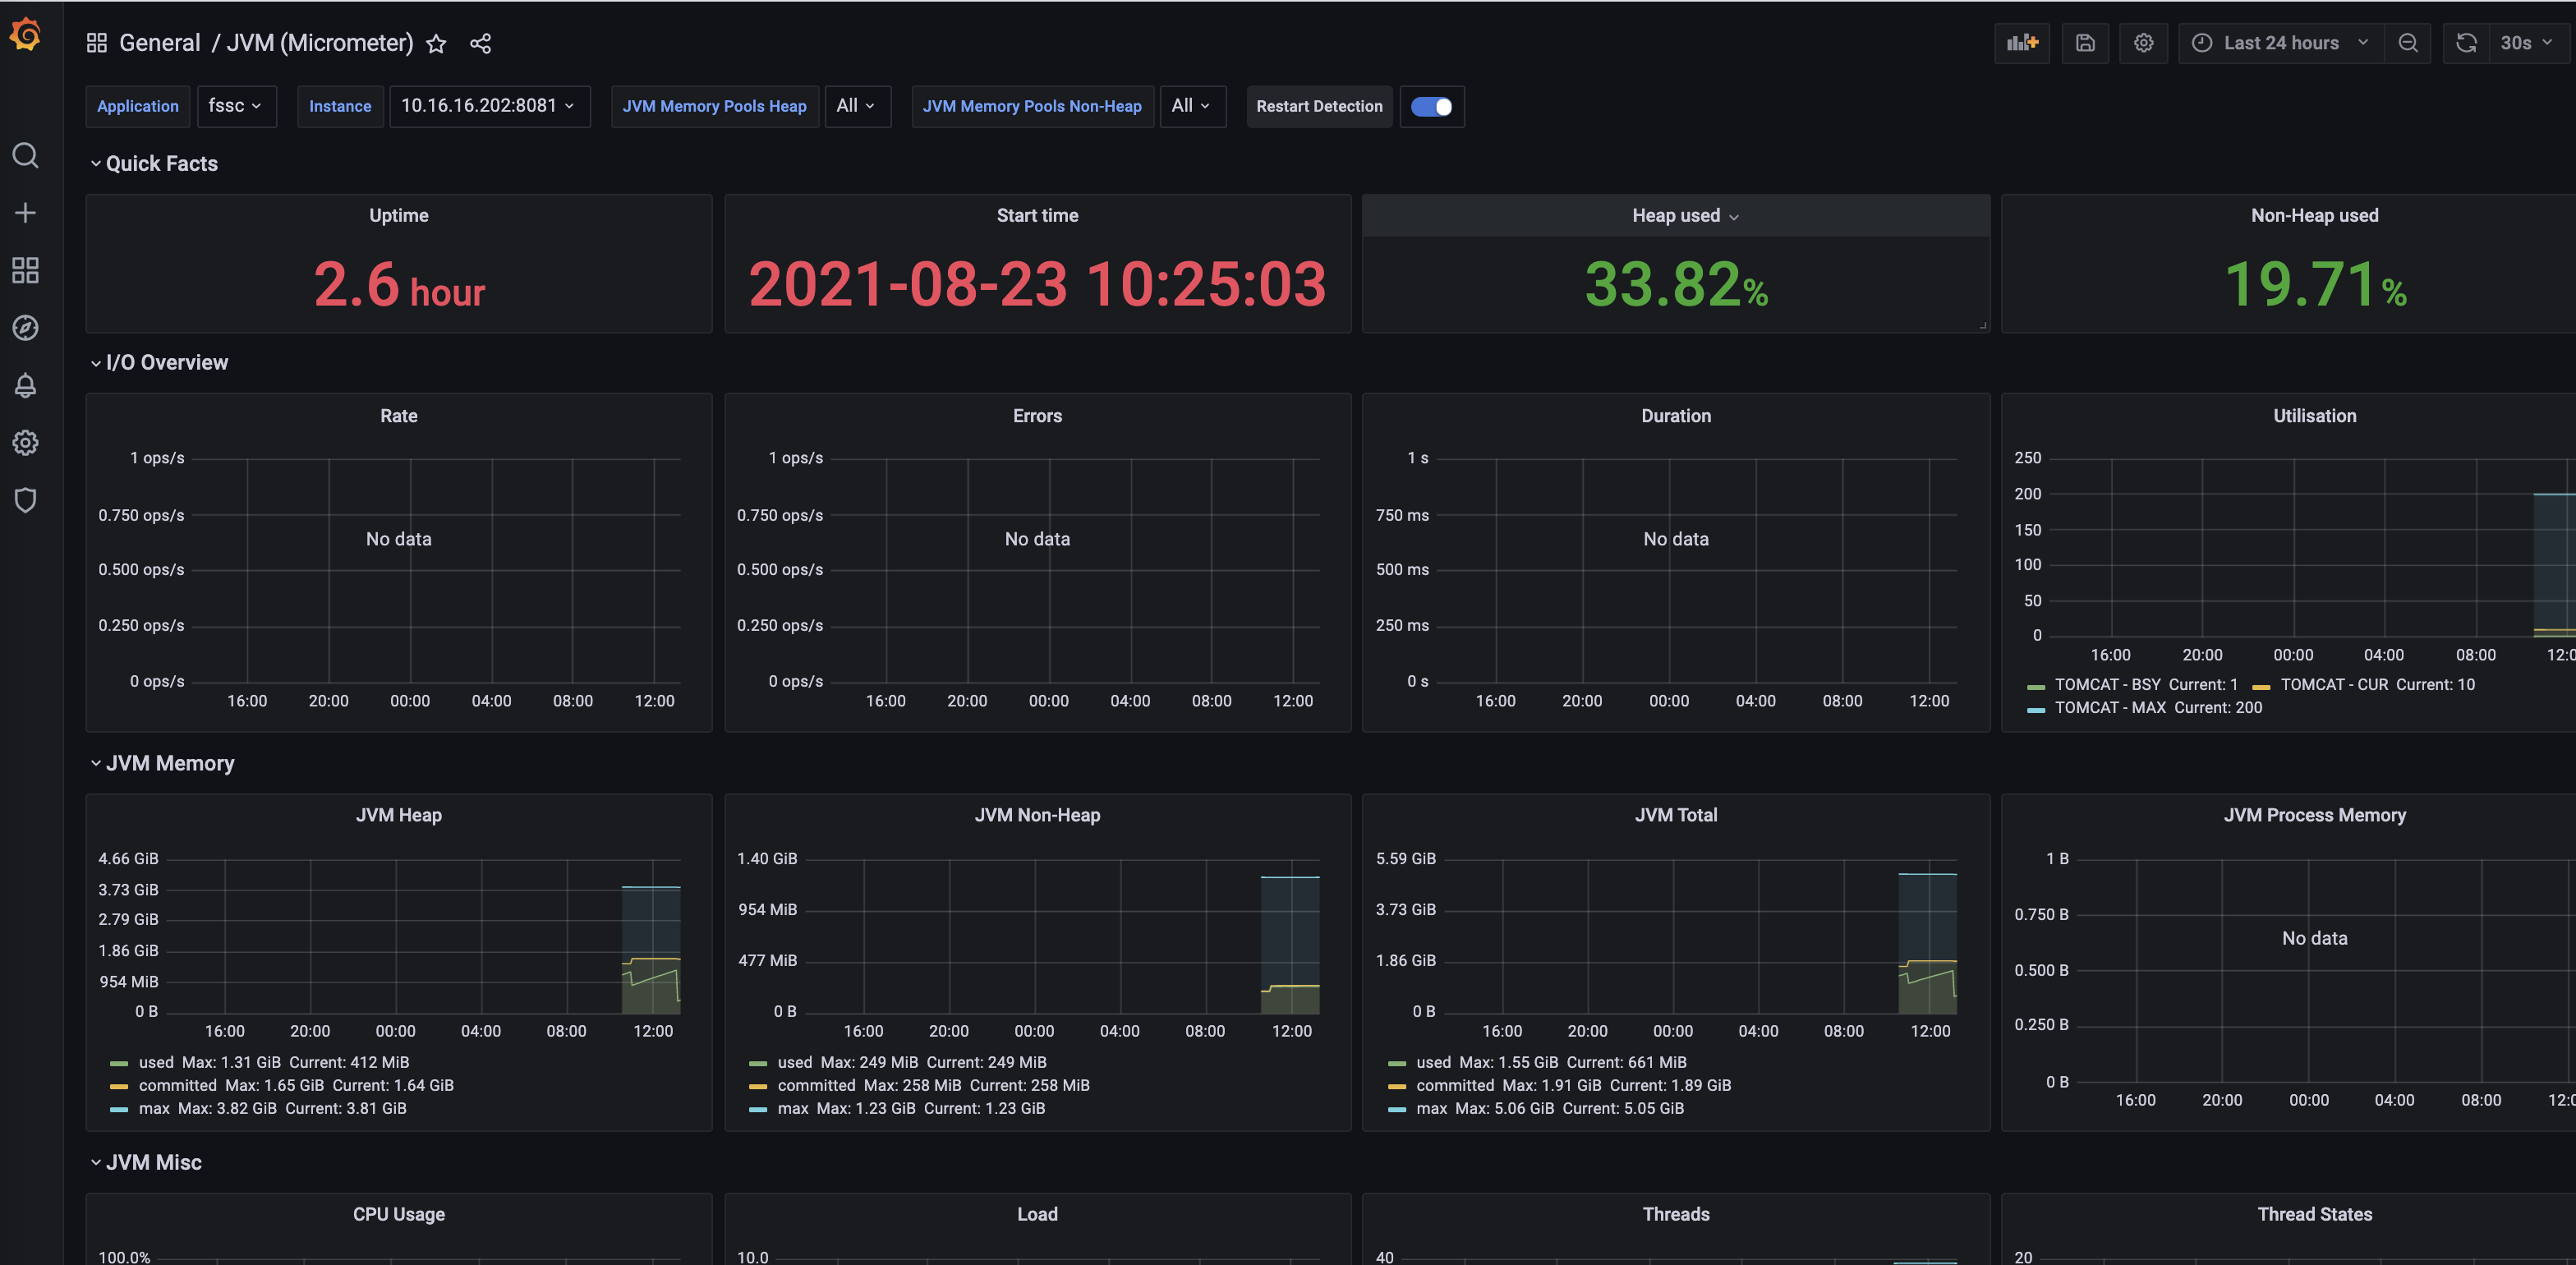
Congratulations, you have completed (part of) the process of integrating prometheus with spring MVC
Write at the end
In this case, you will see that some indicator data are not connected, and will be supplemented as much as possible in the future.