SpringBoot provides us with indicator monitoring. After each micro service is deployed on the cloud in the future, we need to monitor, track, audit and control it. SpringBoot extracts the actor scenario, so that we can quickly reference each micro service to obtain production level application monitoring, audit and other functions
For detailed introduction and usage, please refer to the official documents Click jump
SpringBoot Actuator
Refer to the official documentation. Before using a tool, we all need to introduce its dependencies
<dependencies>
    <dependency>
        <groupId>org.springframework.boot</groupId>
        <artifactId>spring-boot-starter-actuator</artifactId>
    </dependency>
</dependencies>
Then you can access the indicator monitoring page through localhost: 8080 / actor
By default, the actor exposes all endpoints to JMX, while the web side can only access health. Through the following settings, Endpoint is exposed to the web
# SpringBoot actuator configuration
management:
  endpoint:
    shutdown:
      enabled: true  # Expose all endpoint information (default is true)
    health:
      show-details: always # Details of turning on health
  endpoints:
    web:
      exposure:
        include: '*' # Expose as web
| ID | JMX | Web |
|---|---|---|
| auditevents | Yes | No |
| beans | Yes | No |
| caches | Yes | No |
| conditions | Yes | No |
| configprops | Yes | No |
| env | Yes | No |
| flyway | Yes | No |
| health | Yes | Yes |
| heapdump | N/A | No |
| httptrace | Yes | No |
| info | Yes | No |
| integrationgraph | Yes | No |
| jolokia | N/A | No |
| logfile | N/A | No |
| loggers | Yes | No |
| liquibase | Yes | No |
| metrics | Yes | No |
| mappings | Yes | No |
| prometheus | N/A | No |
| quartz | Yes | No |
| scheduledtasks | Yes | No |
| sessions | Yes | No |
| shutdown | Yes | No |
| startup | Yes | No |
| threaddump | Yes | No |
Health Endpoint
The health check endpoint is generally used in the cloud platform. The platform will regularly check the health status of the application. We need the Health Endpoint to return a collection of the health status of a series of components of the current application for the platform.
Important points:
-
The result returned by the health endpoint should be a summary report after a series of health checks
-
Many health checks are automatically configured by default, such as database, redis, etc
-
You can easily add a custom health check mechanism
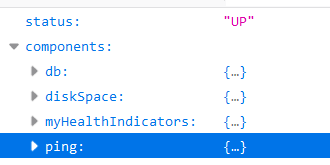
As shown in the figure, when all component s are up, status is up, and up represents health

Customize Health Endpoint
Just implement the HealthIndicator interface
@Component
public class MyHealthIndicators implements HealthIndicator {
    @Override
    public Health getHealth(boolean includeDetails) {
        return HealthIndicator.super.getHealth(includeDetails);
    }
    @Override
    public Health health() {
        HashMap<String, Object> map = new HashMap<>();
        //if the condition judges that the imitation monitoring system is abnormal
        if(1==1){
            map.put("code",200);
            map.put("success","success");
            return Health.up().withDetail("Operation succeeded","nice")
                    .withDetails(map).build();
        }else {
            map.put("code",100);
            map.put("fail","fail");
            return Health.down().withDetail("Operation failed","bad")
                    .withDetails(map).build();
        }
    }
}
Metrics Endpoint
Provide detailed, hierarchical and spatial index information, which can be obtained by pull (active push) or push (passive acquisition);
-
Docking multiple monitoring systems through Metrics
-
Simplify core Metrics development
-
Add custom Metrics or extend existing Metrics
To view the details, add a name after the web address, such as localhost: 8080 / Actor / http.server.requests

Customize Metrics Endpoint
We use metrics to implement a counting function to calculate the number of successful login to the website
@Controller
public class IndexController {
    Counter counter;

    public IndexController(MeterRegistry meterRegistry){
        counter = meterRegistry.counter("Number of login pages");
    }

    @PostMapping("/login")
    public String login(User user, Model model, HttpSession session){
        if ((user.getUserName() != null || user.getUserName() != "") && "123".equals(user.getPassword())){
            //count
            counter.increment();
            session.setAttribute("user",user);
            return "redirect:/index.html";
        }else {
            model.addAttribute("msg","Incorrect account password");
            return "login";
        }
    }
}
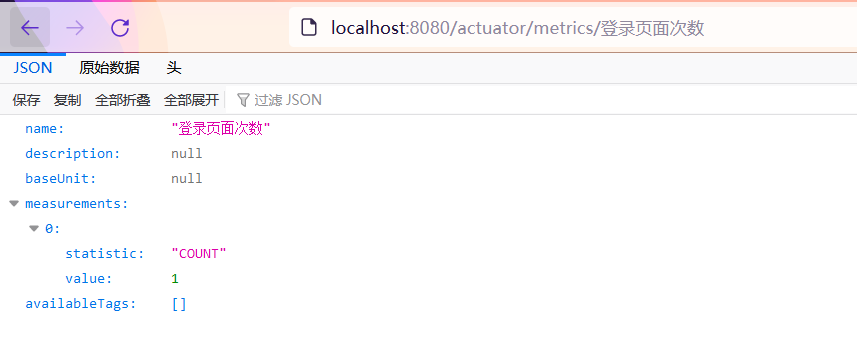
Visit the page and you will see the following information

Custom Endpoint
In the development process, we may need to customize the Endpoint, which can be implemented by referring to the following methods
@Component
@Endpoint(id = "myService")  //The id value here is equivalent to health, info, metrics, etc
public class DockerEndPoint {
    @ReadOperation
    public Map getDockerInfo(){
        //Reading method
        return Collections.singletonMap("info","docker started...");
    }
    @WriteOperation
    private void restartDocker(){
        System.out.println("docker restarted....");
    }
}
visit http://localhost:8080/actuator/myService

Visualization page
Can refer to https://github.com/codecentric/spring-boot-admin Do it
The currently accessible pages are not friendly to the extent of UI display. We can beautify the UI interface through third-party tools
Create a new project and change the access port number to 8888 (not the same as project 8080). This is used to simulate the interaction between one module and indicator monitoring
Import the following dependencies in a new project
        <dependency>
            <groupId>de.codecentric</groupId>
            <artifactId>spring-boot-admin-starter-server</artifactId>
            <version>2.5.1</version>
        </dependency>
Add @ EnableAdminServer annotation on the main program
@EnableAdminServer
@SpringBootApplication
public class Boot03WebAdminServerApplication {
    public static void main(String[] args) {
        SpringApplication.run(Boot03WebAdminServerApplication.class, args);
    }
}
After starting the program, we can see the following page. The current number of applications is 0. If we open the project and bind it to the current indicator monitoring page, the number of monitoring will increase

Operations on projects
We also need to introduce admin server dependency
Binding indicator monitoring path
spring:
  boot:
    admin:
      client:
        url: http://localhost:8888 # binding indicator monitoring path
        instance:
          prefer-ip: true # Register using ip
  application:
    name: boot-03-web
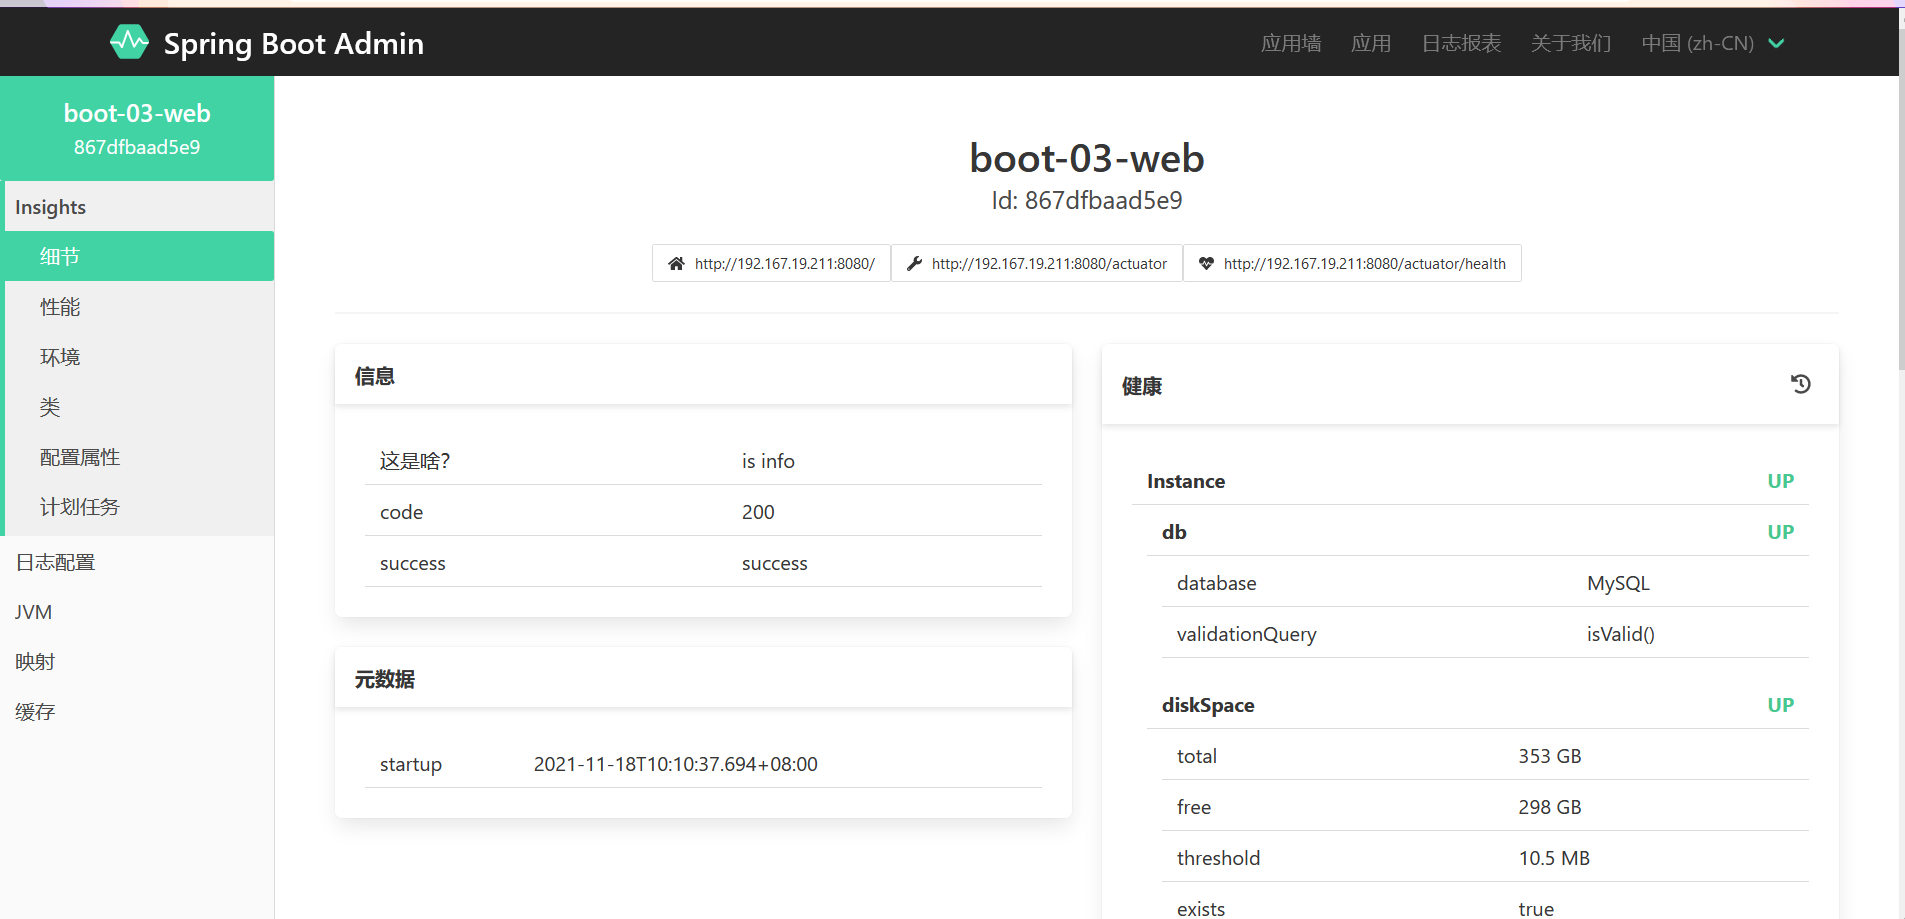
Start the project, and the indicator monitoring page is as follows. If the health page of the website is not healthy, online will not be displayed here

And you can view the information of all endpoints under the page
