Premise:
import pandas as pd
import numpy as np
import os

import seaborn as sns
from pyod.models.mad import MAD
from pyod.models.knn import KNN
from pyod.models.lof import LOF
import matplotlib.pyplot as plt
from sklearn.ensemble import IsolationForest
1.IQR
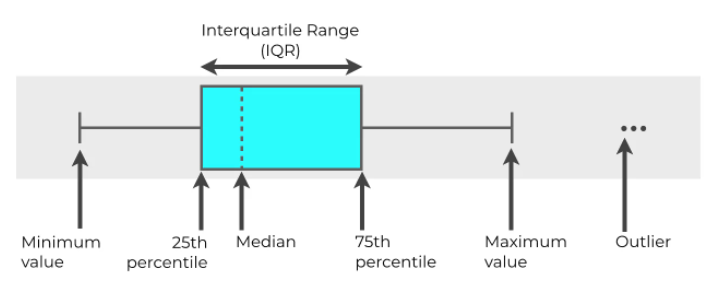
python deletes outliers based on IQR:
df = pd.read_excel('./7.xlsx')

def fit_model(model, data, column='Area'):
    # fit the model and predict it
    df = data.copy()
    data_to_predict = data[column].to_numpy().reshape(-1, 1)
    predictions = model.fit_predict(data_to_predict)
    df['Predictions'] = predictions

    return df

def plot_anomalies(df, x='Date', y='Area'):

    # categories will be having values from 0 to n
    # for each values in 0 to n it is mapped in colormap
    categories = df['Predictions'].to_numpy()
    colormap = np.array(['g', 'r'])

    f = plt.figure(figsize=(12/2.54, 6/2.54))
    f = plt.scatter(df[x], df[y], c=colormap[categories])
    f = plt.xlabel(x)
    f = plt.ylabel(y)
    f = plt.xticks(rotation=0)
    plt.show()

#IQR
def find_anomalies(value, lower_threshold, upper_threshold):

    if value < lower_threshold or value > upper_threshold:
        return 1
    else: return 0

def area_anomaly_detector(data, column='Area', threshold=1.1):

    df = data.copy()
    quartiles = dict(data[column].quantile([.25, .50, .75]))
    quartile_3, quartile_1 = quartiles[0.75], quartiles[0.25]
    area = quartile_3 - quartile_1

    lower_threshold = quartile_1 - (threshold * area)
    upper_threshold = quartile_3 + (threshold * area)

    print(f"Lower threshold: {lower_threshold}, \nUpper threshold: {upper_threshold}\n")

    df['Predictions'] = data[column].apply(find_anomalies, args=(lower_threshold, upper_threshold))
    return df

area_df = area_anomaly_detector(df)
plot_anomalies(area_df)
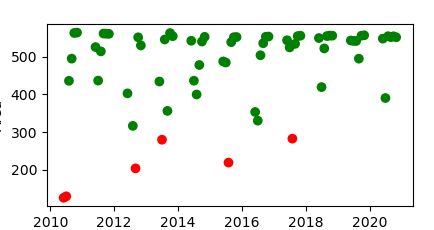
(red indicates abnormal value)
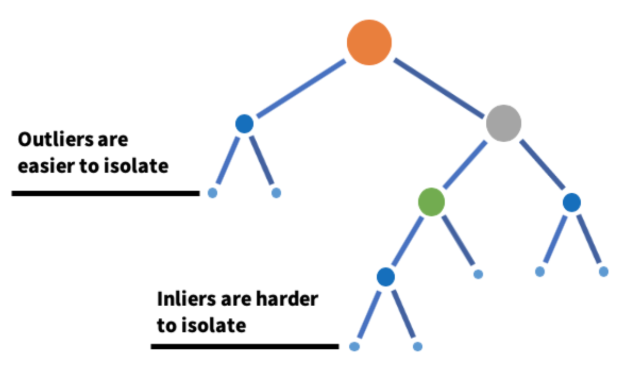
2.Isolation Forest
- Isolated forest is an algorithm based on decision tree. Randomly select features from a given feature set, and then randomly select a segmentation value between the maximum and minimum values of features to isolate outliers. The random division of this feature will make the path of abnormal data points generated in the tree shorter, so as to separate them from other data.
- An effective way to perform outlier detection in high-dimensional data sets is to use random forest.
- It belongs to unsupervised learning algorithm.
Model parameters: - Number of evaluators: n_estimators represents the number of integrated base evaluators or trees, that is, the number of trees in isolated forests. This is an adjustable integer parameter. The default value is 100;
- Maximum sample: max_samples is the number of samples to train each base evaluator. If max_samples
Larger than the sample size, all trees will be trained with the samples used. max_ The default value of samples is "auto". If the value is "auto", then
max_samples=min(256, n_samples); - Data pollution problem: the algorithm is very sensitive to this parameter. It refers to the expected proportion of outliers in the data set. It is used when defining the threshold according to the sample score fitting. The default value is "auto". If the value of "auto" is taken, the threshold is defined according to the original paper of isolated forest;
- Maximum feature: all base evaluators are not trained with all features in the dataset. This is the number of features proposed from all features for training each base evaluator or tree. The default value of this parameter is 1.
model=IsolationForest(n_estimators=50, max_samples='auto', contamination=float(0.1),max_features=1.0)
model.fit(df[['area']])
Algorithm implementation:
Direct call package: from sklearn ensemble import IsolationForest
iso_forest = IsolationForest(n_estimators=125)
iso_df = fit_model(iso_forest, df)
iso_df['Predictions'] = iso_df['Predictions'].map(lambda x: 1 if x==-1 else 0)
plot_anomalies(iso_df)

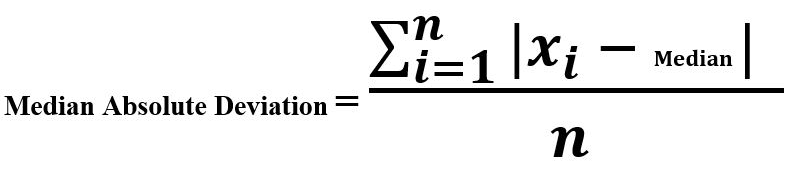
3.MAD(Median Absolute Deviation)
The median absolute deviation is the difference between each observation and the median of these observations.
Algorithm implementation: call from pyod models. mad import MAD
#MAD
#threshold : float, optional (default=3.5)
       # The modified z-score to use as a threshold. Observations with
       # a modified z-score (based on the median absolute deviation) greater
       # than this value will be classified as outliers.
mad_model = MAD()
mad_df = fit_model(mad_model, df)
plot_anomalies(mad_df)

MAD algorithm:
def _mad(self, X):
        """
        Apply the robust median absolute deviation (MAD)
        to measure the distances of data points from the median.

        Returns
        -------
        numpy array containing modified Z-scores of the observations.
        The greater the score, the greater the outlierness.
        """
        obs = np.reshape(X, (-1, 1))
        # `self.median` will be None only before `fit()` is called
        self.median = np.nanmedian(obs) if self.median is None else self.median
        diff = np.abs(obs - self.median)
        self.median_diff = np.median(diff) if self.median_diff is None else self.median_diff
        return np.nan_to_num(np.ravel(0.6745 * diff / self.median_diff))
Summary:
PyOD is a comprehensive and extensible Python toolkit that can be used to detect outliers. You can directly call the model inside.
PyOD website: https://github.com/yzhao062/pyod
Usage: for example, call MAD model
# train the MAD detector
from pyod.models.mad import MAD
clf = MAD()
clf.fit(X_train)

# get outlier scores
y_train_scores = clf.decision_scores_  # raw outlier scores on the train data
y_test_scores = clf.decision_function(X_test)  # predict raw outlier scores on test
reference material:
A walkthrough of uniform analog detection in Python: https://www.analyticsvidhya.com/blog/2021/06/univariate-anomaly-detection-a-walkthrough-in-python/
Isolated forest algorithm: https://blog.csdn.net/ChenVast/article/details/82863750
Outlier detection summary pyod package: https://blog.csdn.net/weixin_43822124/article/details/112523303