Visualization helps to explain and understand the internal structure of deep learning model. Through the visualization of the model calculation diagram, we can find out how the neural network is calculated. The visualization of the model mainly includes the following aspects:
- How many layers does the model have
- Input and output shapes of each layer
- How are different layers connected?
- Parameters used by each layer
- Different activation functions are used
This article will use Keras and PyTorch to build a simple deep learning model, and then use different tools and technologies to visualize its architecture.
Building models using Keras
import keras

# Train the model on Fashion MNIST dataset
(train_images, train_labels), _ = keras.datasets.fashion_mnist.load_data()
train_images = train_images / 255.0

# Define the model.
model = keras.models.Sequential([
    keras.layers.Flatten(input_shape=(28, 28)),
    keras.layers.Dense(32, activation='relu'),
    keras.layers.Dropout(0.2),
    keras.layers.Dense(10, activation='softmax')
])

#Compile the model
model.compile(
    optimizer='adam',
    loss='sparse_categorical_crossentropy',
    metrics=['accuracy'])
Keras built-in visualization model
The simplest way to display the model architecture in Keras is to use the summary() method
model.summary()
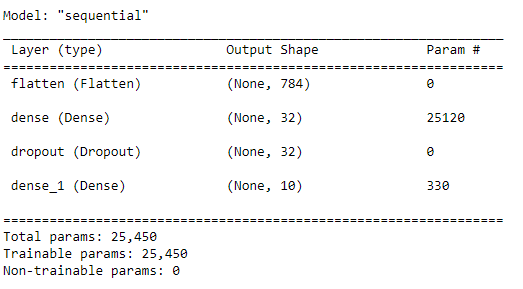
This method is a built-in implementation of keras, and its principle is very simple. To traverse all model layers and print relevant details, such as input and output dimensions, parameter quantity, activation type, etc., we can also use for training traversal. The code is as follows:
for layer in model.layers:
        print("Layer Name: " + layer.name)
        print("Type of layer: " + layer.__class__.__name__)
        print("Input dimesion: {}".format(layer.input_shape[1:]))
        print("Output dimesion: {}".format(layer.output_shape[1:]))
        print("Parameter Count: {}".format( layer.count_params()))
        try:
            print("Activation : " + layer.activation.__name__)
            print(" ")
        except:
            print(" ")
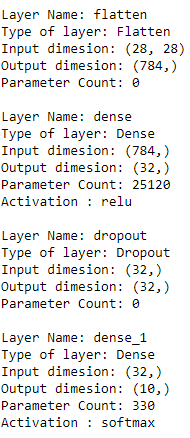
This method can only provide some simple information. Let's introduce some better methods
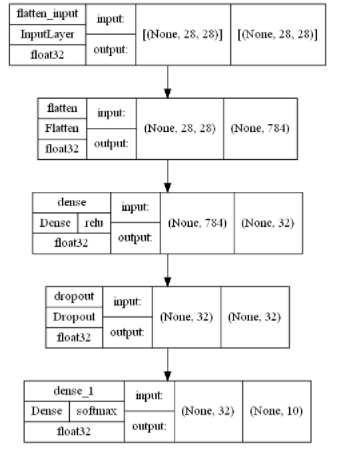
Keras vis_utils
keras.utils.vis_utils provides practical functions for drawing Keras models using Graphviz. However, some other dependencies need to be installed before use:
pip install pydot
pip install pydotplus
pip install graphviz
To use Graphviz, you also need to add the PATH of Graphviz bin folder in the system PATH. After setting, you can use it
model_img_file = 'model.png'
tf.keras.utils.plot_model(model, to_file=model_img_file,
                          show_shapes=True,
                          show_layer_activations=True,
                          show_dtype=True,
                          show_layer_names=True )
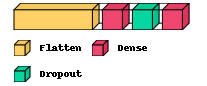
Visualkears
Visualkears library only supports the hierarchical style architecture generation of CNN (convolutional neural network) and the graphic style architecture of most models, including ordinary feedforward networks.
pip install visualkeras
layered view() is used to view the CNN model architecture
visualkeras.layered_view(model,legend=True, draw_volume=True)
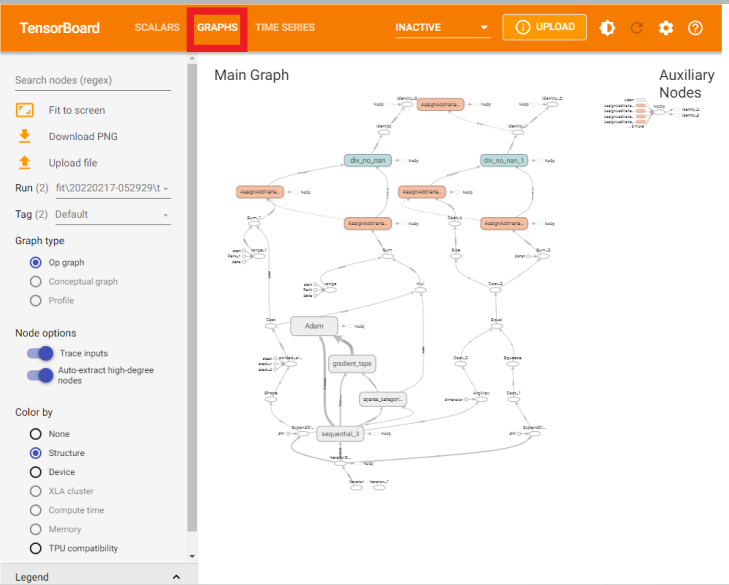
TensorBoard
Photos of Tensorboard can view the model structure diagram. For Tensorboard, use the following method.
import tensorflow as tf
from datetime import datetime
import tensorboard
If you need to use it in notebook, you can load the Tensorboard extension with the following statement
%load_ext tensorboard
Keras Tensorboard Callback used in fit()
# Define the Keras TensorBoard callback.
logdir="logs/fit/" + datetime.now().strftime("%Y%m%d-%H%M%S")
tensorboard_callback = keras.callbacks.TensorBoard(log_dir=logdir)

# Train the model.
model.fit(
    train_images,
    train_labels,
    batch_size=64,
    epochs=5,
    callbacks=[tensorboard_callback])

model.save("model.h5")
After the model training is completed, start TensorBoard and wait for the UI to load.
%tensorboard --logdir logs
You can see the visualization results of the model by clicking "Graphs".
Note: from torch is provided after Pytorch 1.8 utils. Tensorboard import summarywriter can also generate tensorboard data and interface with tensorboard.
Netron
Netron is a viewer designed specifically for neural networks, deep learning and machine learning models. It supports Keras, TensorFlow lite, ONNX, cafe, and experimental support for PyTorch and TensorFlow.
pip install netron
Browser and enter netron App, click "open model" and select the path of h5 file to upload.
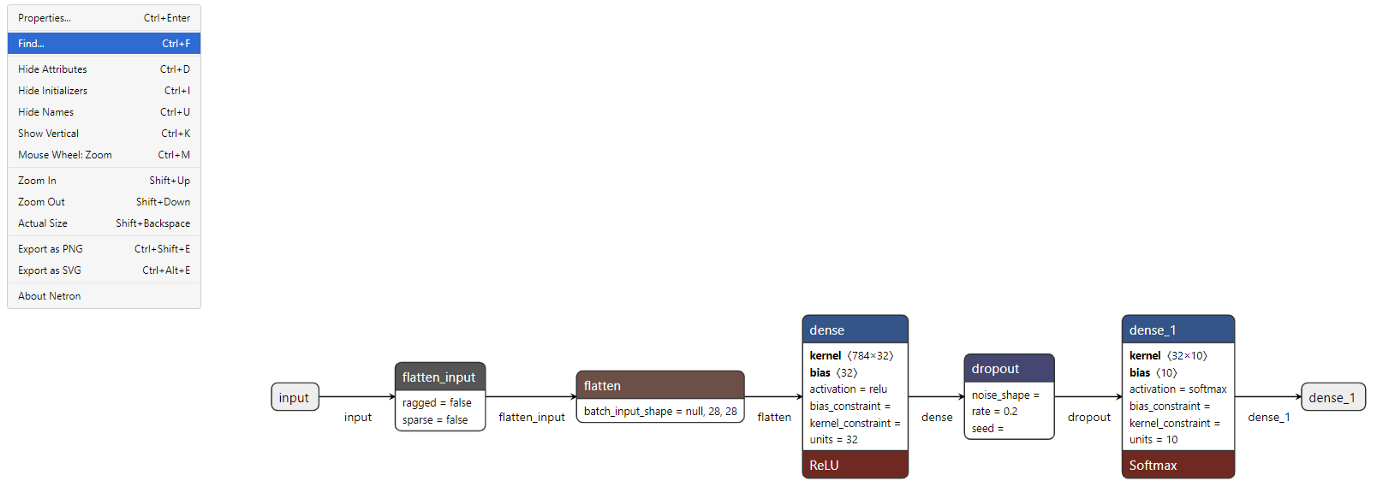
You can see the visualization results of each layer.
Build a simple deep learning model in PyTorch
import torch
from torch import nn
# Get cpu or gpu device for training.
device = "cuda" if torch.cuda.is_available() else "cpu"
print(f"Using {device} device")
class NeuralNetwork(nn.Module):
    def __init__(self):
        super(NeuralNetwork, self).__init__()
        self.flatten = nn.Flatten()
        self.linear_relu_stack = nn.Sequential(
            nn.Linear(28*28, 512),
            nn.ReLU(),
            nn.Linear(512, 512),
            nn.ReLU(),
            nn.Linear(512, 10),
        )def forward(self, x):
        x = self.flatten(x)
        logits = self.linear_relu_stack(x)
        return logits
pytorch_model = NeuralNetwork().to(device)
x = torch.randn(  512, 28,28,1).requires_grad_(True)
y = pytorch_model(x)
The most direct way to view the model architecture is to print it.
print(pytorch_model)
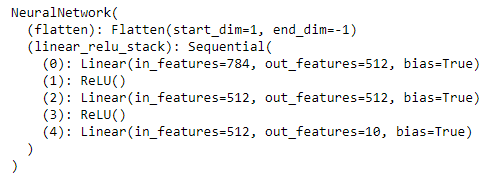
Although you can see the complete model architecture, the effect is not as good as the built-in function of Keras. Here is a useful library to solve this problem.
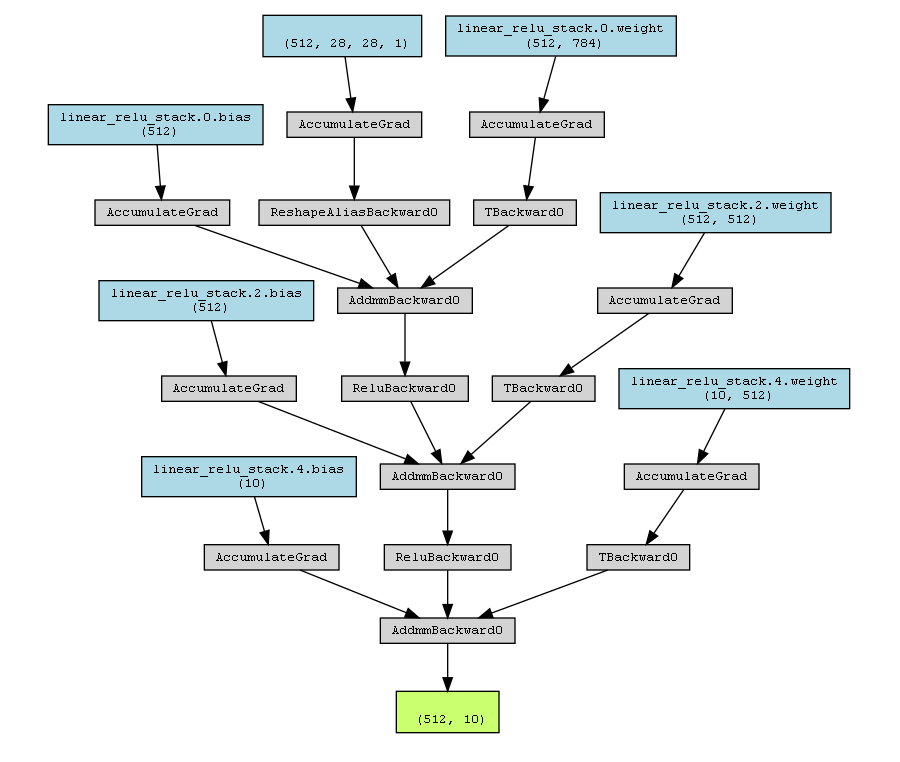
PyTorchViz
PyTorchViz depends on graphviz, so it also needs to be installed:
pip install graphviz
pip install torchviz
Using PyTorchViz visual model is very simple. You only need one method:
from torchviz import make_dot
make_dot(y, params=dict(list(pytorch_model.named_parameters()))).render("torchviz", format="png")
The above code generates a torchviz PNG file, as shown below.
summary
Visual model architecture can better explain the deep learning model. The visualization of model structure shows the number of layers, the input and output shapes of data in each layer, the activation function used and the number of parameters in each layer, so as to provide a better understanding for the optimization model.
https://www.overfit.cn/post/dff81951b62d48f79ff4995c1eedbbb3
Author: Renu Khandelwal