Preface:
A new sys schema is introduced in MySQL 5.7. Sys is a system library of MySQL. When MySQL 5.7 is installed and initialized with mysqld, sys library will be created automatically.
The tables, views, functions and stored procedures in sys libraries can make it easier and faster for us to understand some information of MySQL, such as which statements use temporary tables, which SQL does not use indexes, which schema has redundant indexes, searching for SQL using full table scanning, searching IO occupied by users, etc. The data in these views in sys libraries are mostly from performance_schema. It's got inside. The goal is to reduce the complexity of performance_schema so that we can get a faster understanding of how DB works.
1.sys Library Overview
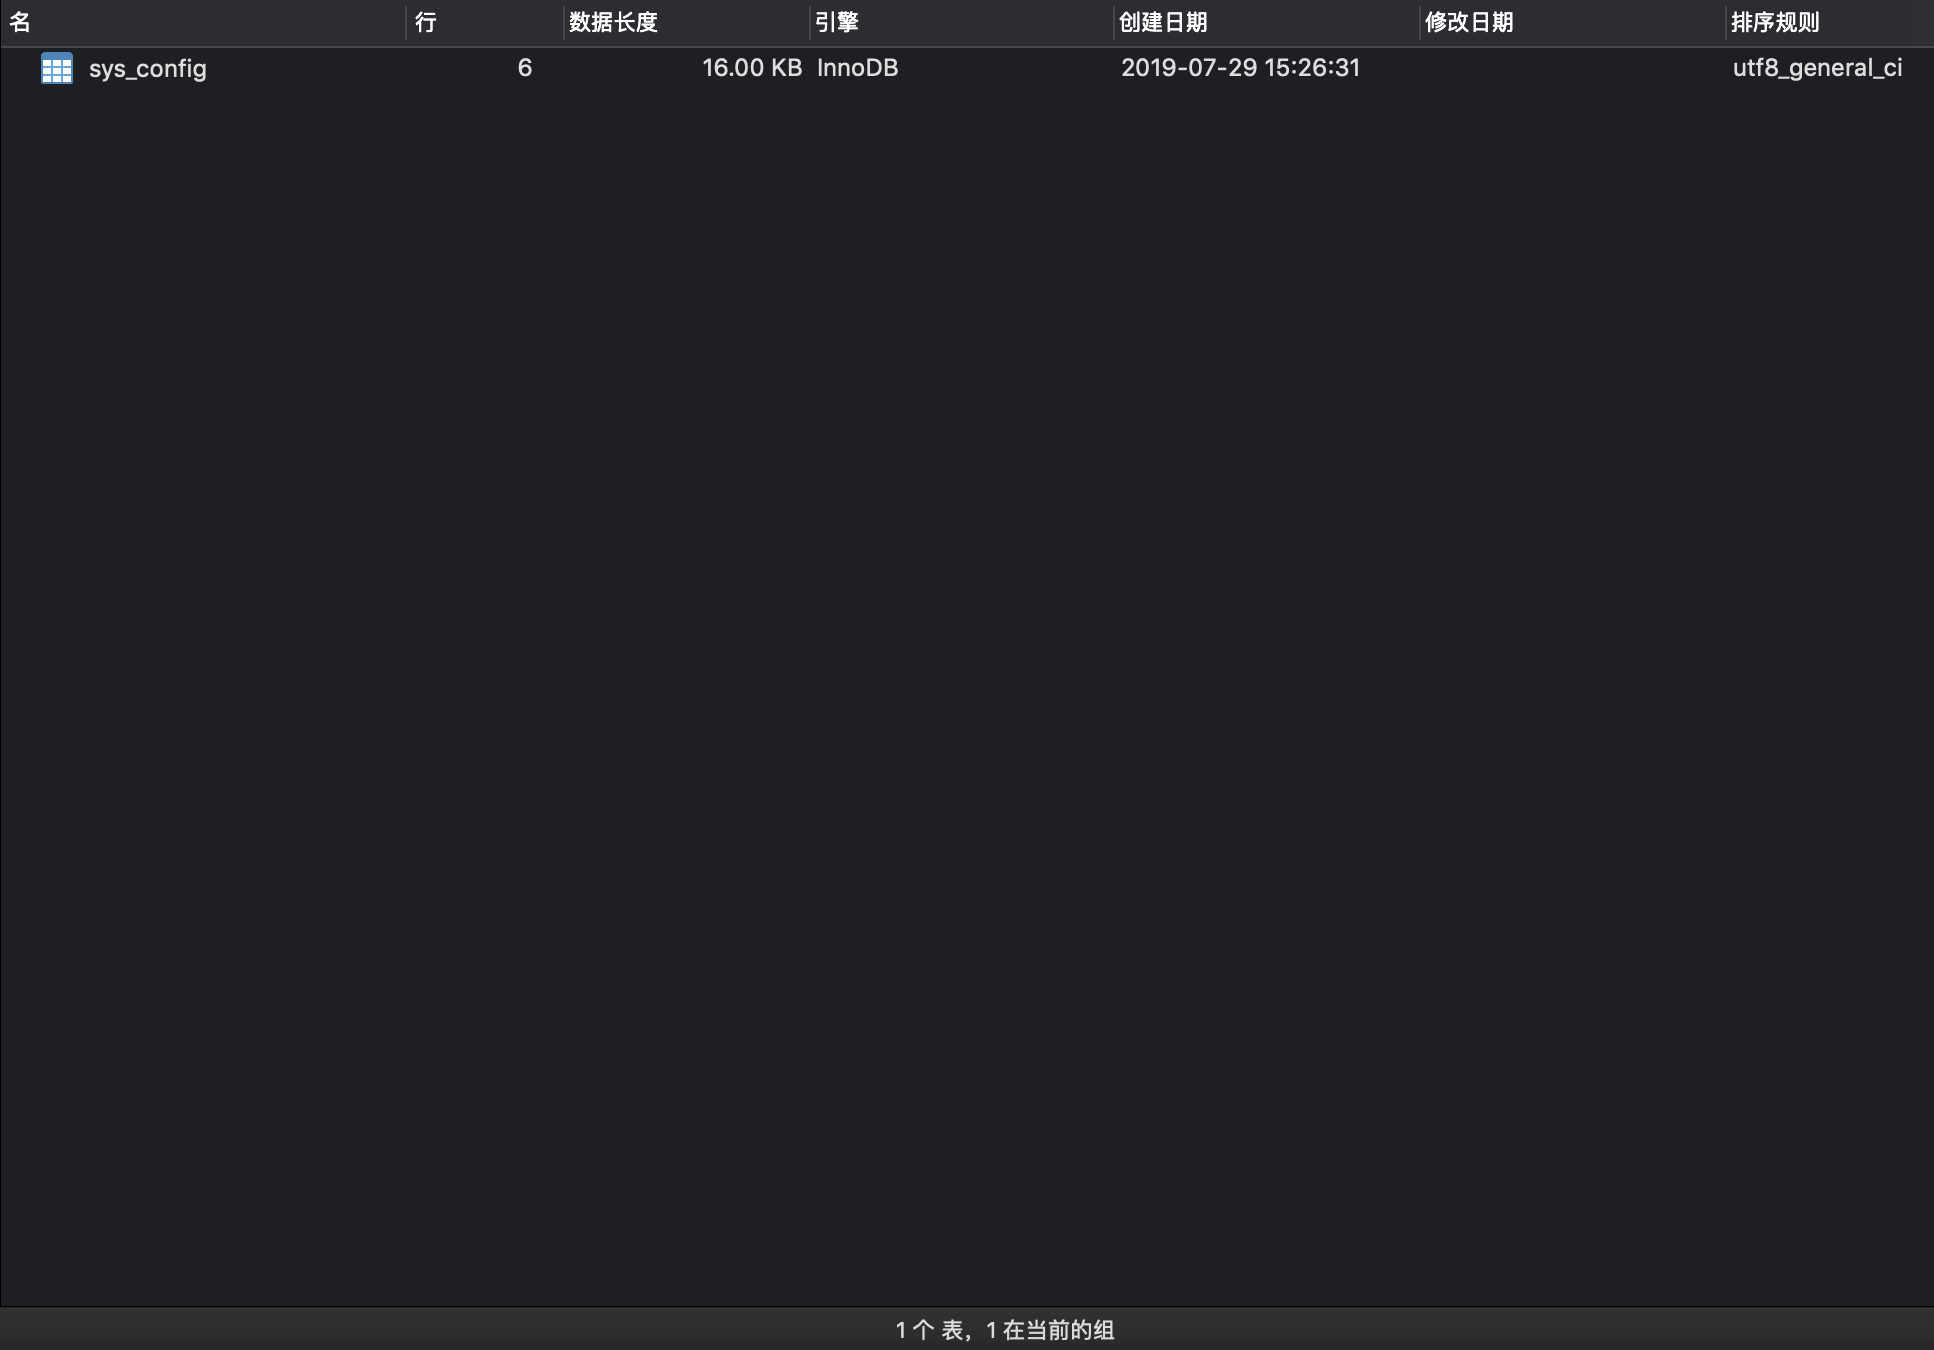
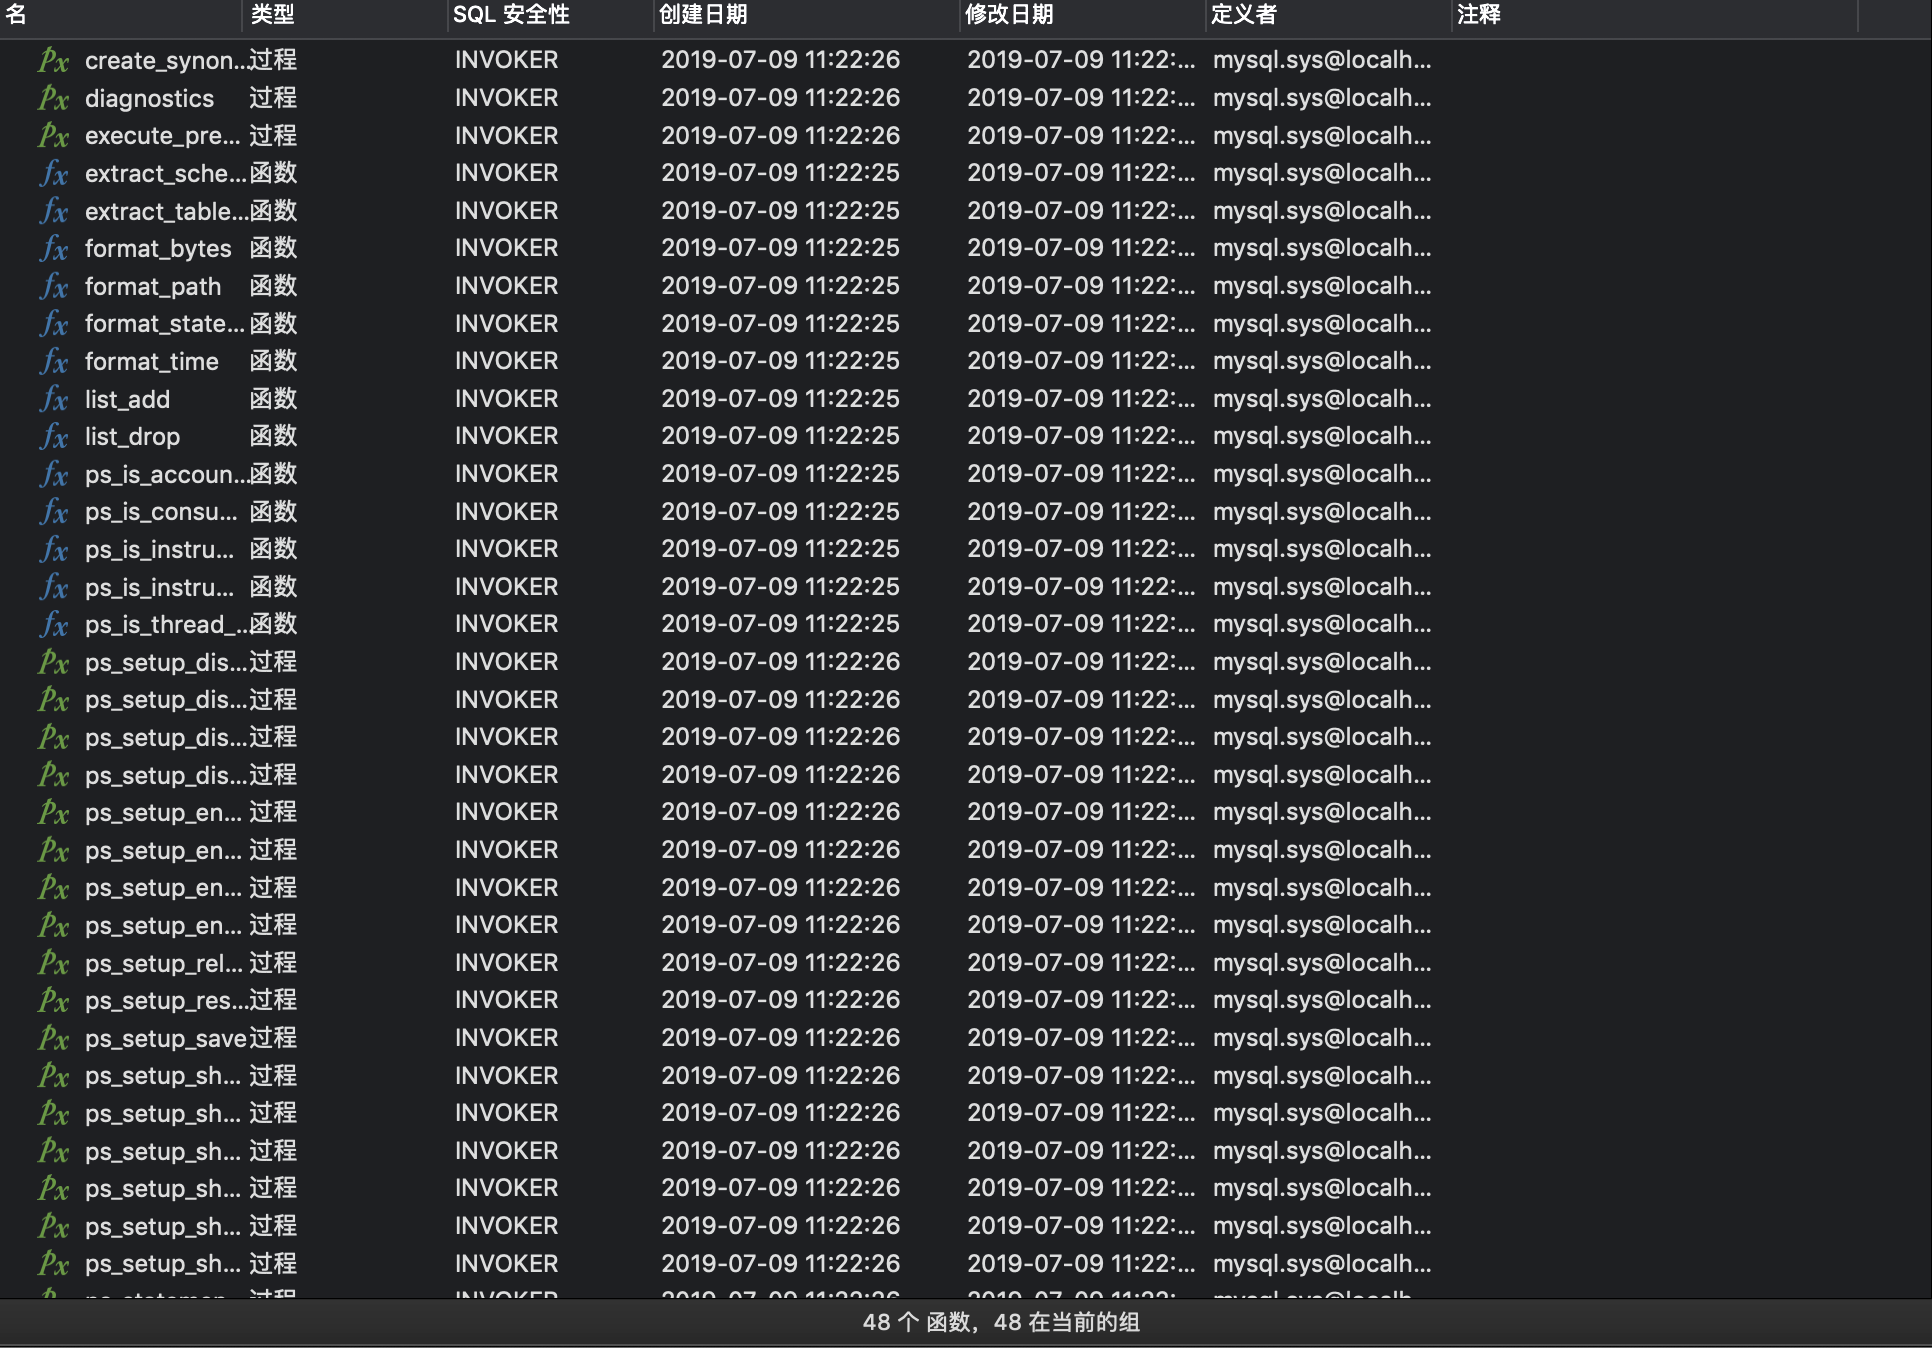
This article is based on MySQL version 5.7.23 experiment. Open the sys library (I hope you will do it with me). We will find that the sys schema contains one table, 100 views, 48 stored procedures and functions, as shown in the following figure:

In fact, we often use the views under sys schema. Here we will mainly introduce the functions of each view. We find that the views in sys schema are mainly divided into two categories. One is normally started with letters, a total of 52, and the other is started with x dollars, a total of 48. The view at the beginning of the letter shows formatted data, which is easier to read, while the view at the beginning of x $is suitable for tools to collect data, showing raw unprocessed data.
Next we will analyze 52 Views starting with letters by category:
- Host_summary: This is at the server level, grouped by IP, such as the view host_summary_by_file_io inside.
- User summary: This is user level, grouped by users, such as the view user summary by file.
- Innodb: This is at the InnoDB level, such as view innodb_buffer_stats_by_schema;
- Io: This is the I/O statistics, such as view io_global_by_file_by_bytes;
- Memory: About memory usage, such as view memory_by_host_by_current_bytes;
- Schema: statistics about schema level, such as schema table lock waits;
- Session: For session level, there are fewer such views, only session and session_ssl_status;
- Statement: About statement level, such as statements_with_errors_or_warnings;
- wait: About waiting, such as view waits_by_host_by_latency.
2. Introduction to Common Queries
1,View each client IP How much resources have been consumed by the connection.
mysql> select * from host_summary;2,See how much happens to a data file IO Request.
mysql> select * from io_global_by_file_by_bytes;3,See how much resources each user consumes.
mysql> select * from user_summary;4,See how much memory is allocated in total.
mysql> select * from memory_global_total;5,Where do the database connections come from and how do they request the database?
//View the current connection.
mysql> select host, current_connections, statements from host_summary;6,View the currently executing SQL And execution show full processlist The effect is comparable.
mysql> select conn_id, user, current_statement, last_statement from session;7,Which are in the database? SQL Frequently executed?
//Execute the following command to query the hottest SQL in TOP 10.
mysql> select db,exec_count,query from statement_analysis order by exec_count desc limit 10;8,Which file produced the most IO,Read more or write more?
mysql> select * from io_global_by_file_by_bytes limit 10;9,Which table is on? IO Most requests?
mysql> select * from io_global_by_file_by_bytes where file like '%ibd' order by total desc limit 10;10,Which table is visited the most? First visit statement_analysis,Popular SQL Sort to find the corresponding data table.
mysql> select * from statement_analysis order by avg_latency desc limit 10;11,Which? SQL Full table scan or sort?
mysql> select * from statements_with_sorting;
mysql> select * from statements_with_full_table_scans;12,Which? SQL Statements use temporary tables, and which use disk temporary tables?
//See which SQL tmp_tables and tmp_disk_tables in statement_analysis have values greater than 0.
mysql> select db, query, tmp_tables, tmp_disk_tables from statement_analysis where tmp_tables>0 or tmp_disk_tables >0 order by (tmp_tables+tmp_disk_tables) desc limit 20;13,Which table occupies the most buffer pool?
mysql> select * from innodb_buffer_stats_by_table order by allocated desc limit 10;14,Each library ( database)How much? buffer pool?
mysql> select * from innodb_buffer_stats_by_schema order by allocated desc limit 10;15,How much memory is allocated per connection?
//The session table and memory_by_thread_by_current_bytes allocation table are used for association query.
mysql> select b.user, current_count_used, current_allocated, current_avg_alloc, current_max_alloc, total_allocated,current_statement from memory_by_thread_by_current_bytes a, session b where a.thread_id = b.thd_id;16,MySQL The maximum value of the self-growing field and the value currently used?
mysql> select * from schema_auto_increment_columns;17,MySQL What are the redundant and useless indexes?
mysql> select * from schema_redundant_indexes;
mysql> select * from schema_unused_indexes;18,View transaction waiting
mysql> select * from innodb_lock_waits;
Conclusion:
This paper mainly introduces the related content of sys library. In fact, sys library has many useful queries, which can help you easily understand the operation of the database. Originally, you need to find data from multiple tables in performance_schema. Now querying a view can satisfy you. Of course, sys libraries need you to understand in detail and summarize the query methods you need.
References: