Performance test monitoring 1. Monitoring of pressure measuring end: JMeter cluster + InfluxDB storage + Grafana At the pressure measuring end, if it is found that there are many process failures, the following two situations can be considered: 1) The performance of the tested software has reached the bottleneck and can not accept so many requests. 2) The machine running the pressure measurement tool (such as JMeter) at the pressure measurement end needs to be solved by adding JMeter because it sends too many threads and the pressure measurement machine resources (CPU, memory, network or disk) are not enough. This requires a corresponding monitoring tool to monitor the performance test. The tools described in sections 1 and 3 can achieve this function, but JMeter cluster + InfluxDB storage + Grafana is the most friendly tool combination for monitoring the pressure measuring end at present. JMeter cluster + InfluxDB storage + Grafana environment can be installed under any operating system of Windows, Linux or MAC. This section takes Windows as an example. 1.1 download and install InfluxDB
- InfluxDB is an open source distributed database of time series, time and indicators. It is written in Go language without external dependence. Its design goal is to achieve distributed and horizontal scalability. It is the core product of InfluxData.
- Application of InfluxDB: back-end storage of performance monitoring, application indicators, Internet of things sensor data and real-time analysis.
- The complete upstream and downstream industries of InfluxDB also include Chronograf, Telegraf and Kapacitor. Their specific functions and relationships are shown in Figure 1.
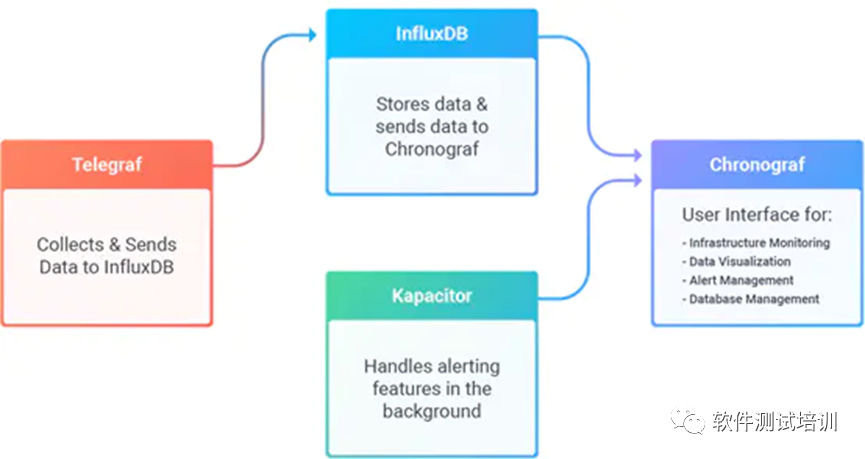
1. Influxdb family diagram
The specific operation steps are as follows. 1) To https://dl.influxdata.com/influxdb/releases/influxdb2-2.0.6-windows-amd64.zip Download influxdb2-2.0.6-windows-amd64 zip. 2) Store the downloaded zip file in a local non Chinese directory (I downloaded it in C:\influxdb-1.7.3-1). 3) Enter the C:\influxdb-1.7.3-1 directory and open influxdb.com with a text editor conf. 4) Edit as follows:
...
[meta]

  # Where the metadata/raft database is stored

  # dir = "/var/lib/influxdb/meta"

  dir = "C:\\influxdb\\meta"

  #I set it to C:\influxdb, and the database files will be generated in the C:\influxdb directory.


  # Automatically create a default retention policy when creating a database.

  retention-autocreate = true


  # If log messages are printed for the meta service

  logging-enabled = true

...

[data]

  # The directory where the TSM storage engine stores TSM files.

  dir = "C:\\influxdb\\meta"


  # The directory where the TSM storage engine stores WAL files.

  wal-dir = "C:\\influxdb\\wal"

...

[retention]

  # Determines whether retention policy enforcement enabled.

  enabled = true

  # The interval of time when retention policy enforcement checks run.

  check-interval = "30m"

...

[shard-precreation]

  # Determines whether shard pre-creation service is enabled.

  enabled = true


  # The interval of time when the check to pre-create new shards runs.

  check-interval = "10m"


  # The default period ahead of the endtime of a shard group that its successor

  # group is created.

  advance-period = "30m"

...

[monitor]

  # Whether to record statistics internally.

  store-enabled = true


  # The destination database for recorded statistics

  store-database = "_internal"


  # The interval at which to record statistics

  store-interval = "10s"

...
5) Use inluxd - config inluxdb Conf run
C:\influxdb-1.7.3-1>influxd -config influxdb.conf
 8888888           .d888 888                   8888888b.  888888b.

   888            d88P"  888                   888  "Y88b 888  "88b

   888            888    888                   888    888 888  .88P

   888   88888b.  888888 888 888  888 888  888 888    888 8888888K.

   888   888 "88b 888    888 888  888  Y8bd8P' 888    888 888  "Y88b

   888   888  888 888    888 888  888   X88K   888    888 888    888

   888   888  888 888    888 Y88b 888 .d8""8b. 888  .d88P 888   d88P

 8888888 888  888 888    888  "Y88888 888  888 8888888P"  8888888P"

...

2021-06-04T09:46:34.406806Z     info    Starting retention policy enforcement service
{"log_id": "0UXbWmRG000", "service": "retention", "check_interval": "30m"}

2021-06-04T09:46:34.408611Z     info    Listening for signals   {"log_id":
"0UXbWmRG000"}

2021-06-04T09:46:34.408611Z     info    Sending usage statistics to
usage.influxdata.com        {"log_id": "0UXbWmRG000"}
If "sending usage statistics to usage. Incluxdata. Com" appears, it indicates that the incluxdb is started successfully.
1.2 configuring InfluxDB
- Configuring with pluxdb studio
InfluxDB Studio is the graphical configuration interface of InfluxDB. Use the following steps to configure the InfluxDB. 1) Connect to get InfluxDB Studio. Link: https://pan.baidu.com/s/1CRJXtmj_W5bIEJjkP0mR5g . Extraction code: ok87. 2) After unpacking, run incluxdbstudio.com directly exe. 3) Click the icon in Figure 2.
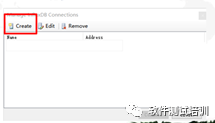
Figure 2 starting to establish database connection in influxdb studio
4) In Figure 3, enter any connection name you like, incluxdb address (localhost by default) and port number (8086 by default), as well as user name and password. Click the [Test] button to display that the Test is successful. Click the [save] button to display that the connection is successful. Save and close.
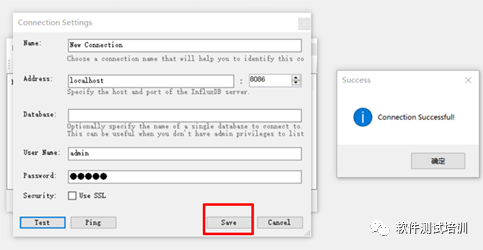
Figure 3 establishing the database connection of InfluxDBStudio
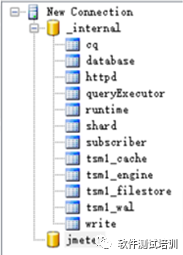
5) The tree structure in Figure 4 appears on the left_ internal is the default database.
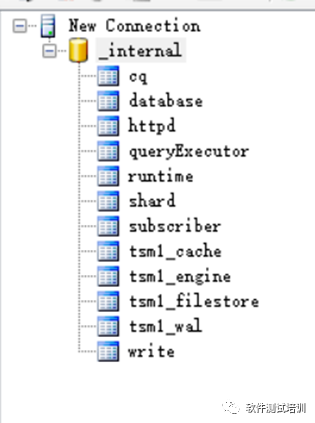
Figure 4. Influxdb default database
6) As shown in Figure 5 a), right-click the root of the menu and click "Create Database". 7) As shown in Figure 5 b), enter "jmeter". 8) As shown in Figure 5 c), after the jmeter database is established successfully.
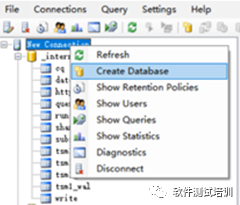
a)
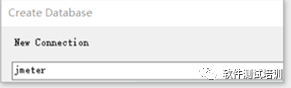
b)
c)
Figure 5 establishing jmeter database
- Configure with command line
1) On the command line, run include Exe, enter the InfluxDB command line.
C:\InfluxDB-1.7.3-1>influx.exe
Connected to http://localhost:8086 version 1.7.3

InfluxDB shell version: 1.7.3

Enter an InfluxQL query

>
2) Type the following commands in sequence.
>CREATE USER admin WITH PASSWORD 'admin' WITH ALL PRIVILEGES
>auth admin admin

>CREATE DATABASE jmeter

>show databases use jmeter

>show measurements
When the last command is executed, the command line interface is empty and there is no data at present.