This note is the learning content of Alibaba cloud Tianchi Longzhu program SQL training camp. The link is: https://tianchi.aliyun.com/specials/promotion/aicampsql
Exercise 1
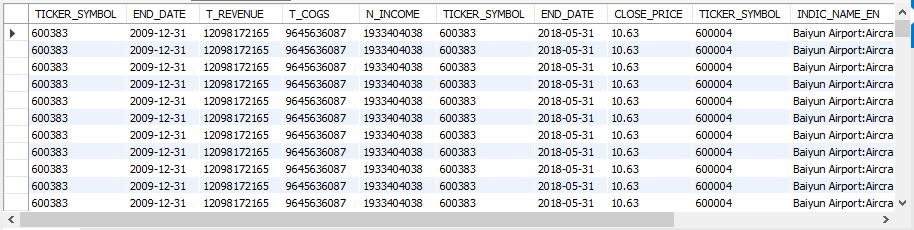
Please use the quarterly revenue forecast data sets "Income Statement.xls", "Company Operating.xlsx" and "Market Data.xlsx" of A-share listed companies, with Market Data as the main table and ticker in the three tables_ The information with symbol 600383 and 600048 is combined. Only the following fields need to be displayed.
| Table name | Field name |
|---|---|
| Income Statement | TICKER_SYMBOL |
| Income Statement | END_DATE |
| Income Statement | T_REVENUE |
| Income Statement | T_COGS |
| Income Statement | N_INCOME |
| Market Data | TICKER_SYMBOL |
| Market Data | END_DATE_ |
| Market Data | CLOSE_PRICE |
| Company Operating | TICKER_SYMBOL |
| Company Operating | INDIC_NAME_EN |
| Company Operating | END_DATE |
| Company Operating | VALUE |
Exercise Code:
SELECT inst.TICKER_SYMBOL, inst.END_DATE, inst.T_REVENUE, inst.T_COGS, inst.N_INCOME,
md.TICKER_SYMBOL, md.END_DATE, md.CLOSE_PRICE,
co.TICKER_SYMBOL, co.INDIC_NAME_EN, co.END_DATE, co.VALUE
FROM `Market Data` AS md
JOIN `income statement` AS inst
ON md.TICKER_SYMBOL = inst.TICKER_SYMBOL
JOIN `Company Operating` AS co
ON co.TICKER_SYMBOL = co.TICKER_SYMBOL
WHERE md.TICKER_SYMBOL IN ('600383', '600048');
Exercise results:
Exercise 2
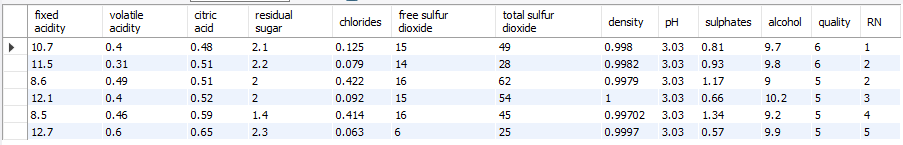
Please use Wine Quality Data set "winequality red. CSV" to find out all red wines with pH=3.03, and then rank their city acid in Chinese style (the next ranking in the same ranking should be the next consecutive integer value. In other words, there should be no "interval" between ranking)
Exercise Code:
SELECT *, DENSE_RANK() OVER (ORDER BY `citric acid`) AS RN
FROM `winequality-red`
WHERE pH = '3.03';
Exercise results:
Exercise 3
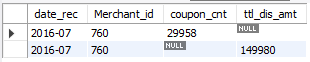
Using the data set ccf_offline_stage1_test_revised.csv in Coupon Usage Data for O2O, try to find out the merchants with the largest total amount of coupons and the largest number of coupons during July 2016.
Here, only the amount of full reduction is considered, and coupons with a few discounts are not considered.
Exercise Code:
SELECT * FROM
(SELECT SUBSTRING(Date_received, 1, 7) AS date_rec,
Merchant_id,
COUNT(User_id) AS coupon_cnt,
NULL AS `ttl_dis_amt`
FROM `ccf_offline_stage1_test_revised`
WHERE SUBSTRING(Date_received, 1, 7) = '2016-07'
GROUP BY Merchant_id
ORDER BY COUNT(User_id) DESC
LIMIT 1) temp1
UNION ALL
SELECT * FROM
(SELECT SUBSTRING(Date_received, 1, 7) AS date_rec,
Merchant_id,
NULL AS `coupon_cnt`,
SUM(SUBSTRING_INDEX(Discount_rate, ':', -1) + 0) AS ttl_dis_amt
FROM `ccf_offline_stage1_test_revised`
WHERE SUBSTRING(Date_received, 1, 7) = '2016-07'
GROUP BY Merchant_id
ORDER BY SUM(SUBSTRING_INDEX(Discount_rate, ':', -1) + 0) DESC
LIMIT 1) temp2;
Exercise results:
Exercise 4
Please use the sheet index in macro & industry.xlsx, the data set in the quarterly revenue forecast of A-share listed companies_ Data, please calculate the power consumption of the whole society: primary industry: the value of the current month is in which month did the peak of power consumption occur in 2015? And what percentage increase / decrease compared with the same period last year?
Exercise Code:
SELECT temp1.indic_id, temp1.name_cn, temp1.FREQUENCY_CD, temp1.PERIOD_DATE, temp1.DATA_VALUE,
temp2.indic_id, temp2.name_cn, temp2.FREQUENCY_CD, temp2.PERIOD_DATE, temp2.DATA_VALUE,
CONCAT(ROUND(((temp1.DATA_VALUE - temp2.DATA_VALUE) / temp2.DATA_VALUE * 100), 2) , '%') AS month_rate
FROM (
SELECT indic_id, name_cn, FREQUENCY_CD, PERIOD_DATE, DATA_VALUE,
ROW_NUMBER() OVER (ORDER BY DATA_VALUE DESC) AS RN
FROM `macro industry`
WHERE name_cn = 'Total Electricity Consumption: Primary Industry'
AND SUBSTRING(PERIOD_DATE, 1, 4) = '2015'
ORDER BY DATA_VALUE DESC
LIMIT 1 ) temp1
LEFT JOIN (
SELECT indic_id, name_cn, FREQUENCY_CD, PERIOD_DATE, DATA_VALUE
FROM `macro industry`
WHERE name_cn = 'Total Electricity Consumption: Primary Industry'
AND SUBSTRING(PERIOD_DATE, 1, 4) = '2014'
) temp2
ON SUBSTRING_INDEX(temp1.PERIOD_DATE, '-', -2) = SUBSTRING_INDEX(temp2.PERIOD_DATE, '-', -2);
Exercise results:

Exercise 5
Using the data set ccf_online_stage1_train.csv in Coupon Usage Data for O2O, try to calculate the overall rejection rate of online coupons during June 2016? And find out the merchants with the highest rejection rate of coupons.
Rejection rate = number of coupons received but not used / total number of coupons received
The size of the data set "ccf_online_stage1_train.csv" is 2.11GB, and the loading time is too long. Try to answer later.
Exercise 6
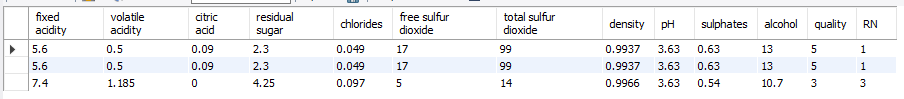
Please use Wine Quality Data set winequality-white.csv to find out all white wines with pH=3.63, and then rank their residual sugar in English (discontinuous ranking)
Exercise Code:
SELECT *,  RANK() OVER (ORDER BY `residual sugar`) AS RN
FROM `winequality-red`
WHERE pH = '3.63'
Exercise results:
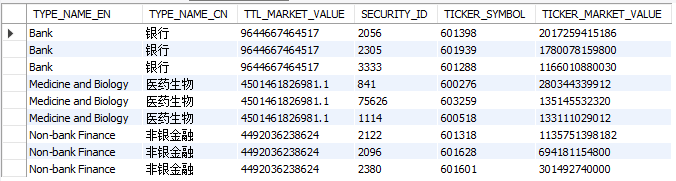
Exercise 7
Please use the sheet data in the data set Market Data.xlsx in the quarterly revenue forecast of A-share listed companies,
What are the three industries with the largest market value by the end of 2018? And what are the three companies with the largest market capitalization in these three industries? (find out the top three companies in each industry, that is, a total of 9 companies)
Exercise Code:
SELECT a.TYPE_NAME_EN, a.TYPE_NAME_CN, a.TTL_MARKET_VALUE,
b.SECURITY_ID, b.TICKER_SYMBOL, b.MARKET_VALUE AS TICKER_MARKET_VALUE
FROM (
SELECT TYPE_NAME_EN, TYPE_NAME_CN, SUM(MARKET_VALUE + 0) AS TTL_MARKET_VALUE
-- String type + 0 = value type
FROM `Market Data`
WHERE END_DATE = '2018-05-31'
GROUP BY TYPE_NAME_EN, TYPE_NAME_CN
ORDER BY SUM(MARKET_VALUE) DESC
LIMIT 3) a
LEFT JOIN (
SELECT SECURITY_ID, TICKER_SYMBOL, TYPE_NAME_EN, TYPE_NAME_CN, MARKET_VALUE,
ROW_NUMBER() OVER (PARTITION BY TYPE_NAME_CN ORDER BY MARKET_VALUE + 0 DESC) AS RN
FROM `Market Data`
WHERE END_DATE = '2018-05-31'
) b
ON a.TYPE_NAME_EN = b.TYPE_NAME_EN
WHERE b.RN <= 3
ORDER BY a.TTL_MARKET_VALUE DESC;
Exercise results:
Exercise 8
Using the data sets ccf_online_stage1_train.csv and ccf_offline_stage1_train.csv in Coupon Usage Data for O2O, try to find out the customers who used the most online and offline coupons during June 2016.
The size of the data set "ccf_online_stage1_train.csv" is 2.11GB, and the loading time is too long. Try to answer later.
Exercise 9
Please use sheet general business in Income Statement.xls and sheet en in Company Operating.xlsx, the quarterly revenue forecast data set of A-share listed companies.
Find out the corresponding net profit of the quarter with the highest passenger throughput of Baiyun Airport in all years of the data set? (note that it is the net profit corresponding to a single quarter, not the cumulative net profit.)
Exercise Code:
SELECT a.TICKER_SYMBOL, a.INDIC_NAME_EN, a.DATE_YEAR, a.DATE_QUARTER, a.TTL_VALUE, b.REPORT_TYPE, b.END_DATE, b.T_PROFIT
FROM (
SELECT TICKER_SYMBOL, INDIC_NAME_EN, YEAR(END_DATE) AS DATE_YEAR, QUARTER(END_DATE) AS DATE_QUARTER, SUM(VALUE) AS TTL_VALUE
FROM `Company Operating`
WHERE INDIC_NAME_EN = 'Baiyun Airport:Passenger throughput'
GROUP BY TICKER_SYMBOL, INDIC_NAME_EN, YEAR(END_DATE), QUARTER(END_DATE)
ORDER BY SUM(VALUE) DESC
LIMIT 1) a
LEFT JOIN `Income Statement` b
ON a.TICKER_SYMBOL = b.TICKER_SYMBOL
WHERE REPORT_TYPE = 'Q1' AND END_DATE = '2018-03-31';
Exercise results:

Exercise 10
Using the data sets ccf_online_stage1_train.csv and ccf_offline_stage1_train.csv in Coupon Usage Data for O2O, try to find out the top three merchants who have been used with the most coupons online and offline during June 2016.
For example, if merchant A uses A 200 minus 50 coupon and consumer B uses A 30 minus 1 coupon, merchant A will be deducted by 51 yuan.
The size of the data set "ccf_online_stage1_train.csv" is 2.11GB, and the loading time is too long. Try to answer later.