If you are Xiaobai, this set of information can help you become a big bull. If you have rich development experience, this set of information can help you break through the bottleneck
2022web full set of video tutorial front-end architecture H5 vue node applet Video + data + code + interview questions.
Data visualization Preface: https://blog.csdn.net/diviner_s/article/details/115933789
Introduction to Apache Echarts: https://blog.csdn.net/diviner_s/article/details/115934089
Final effect drawing of the project:
This blog is a summary and record of the project completed after learning teacher pink. It is only for communication and reference. Copyright, reprint, please mark the original author!
In addition, the technologies included in the project include html, css, js, jQuery, ajax, websocket, koa, etc.
Today's share is a dynamic highlight of the chart of this project. We look at the chart, and we find that the highlight on each chart is automatic and will keep cycling
Let's zoom in
Dynamic highlight effect of histogram:
Take another look at Nightingale:
These are automatic cycle highlighting [that is, we don't need to click the mouse to automatically display the corresponding data of each icon!]
Let's analyze how to achieve highlighting:
Auto highlight initialization
How to achieve highlighting? We will think that directly placing the mouse on the corresponding place will highlight it, so we realize this effect by binding mouse events!
How to make him show one by one? Of course, the mouse clicks one by one, so we need to define a pointer like pointer pointing array subscript to point to the corresponding data item.
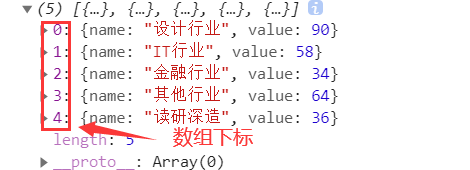
As shown in the figure above, 0-4 is the subscript range.
Define a switch that turns off automatic highlighting when we manually place the mouse over the icon, and turns on automatic highlighting when the mouse is removed.
JS code:
  var _this2 = this
  var isSet2 = true // For judgment: when the mouse moves up, the automatic highlighting is cancelled
  var currentIndex2 = 0 // Simulate a similar pointer to achieve the subscript effect of circular data group
Mouse click highlight animation
When the mouse is over the element, the pointer will explain the event.
We bind the mouseover event. When we put the mouse up, the event will be triggered, and then there will be a series of operations:
- When the switch is off, false means to cancel the automatic highlight and clear the timer
- Cancels previously highlighted shapes
- Highlight the current drawing to display the tooltip
JS code
// 2. Highlight animation when the mouse moves up
  myChart.on('mouseover', function (param) {
    isSet2 = false
    clearInterval(_this2.startCharts)
    // Cancels previously highlighted shapes
    myChart.dispatchAction({
      type: 'downplay',
      seriesIndex: 0,
      dataIndex: currentIndex2
    })
    // Highlight the current drawing
    myChart.dispatchAction({
      type: 'highlight',
      seriesIndex: 0,
      dataIndex: param.dataIndex
    })
    // Show tooltip
    myChart.dispatchAction({
      type: 'showTip',
      seriesIndex: 0,
      dataIndex: param.dataIndex
    })
  })
Auto highlight
Cycle highlighting principle:
As mentioned earlier, we use the pointer to mark the subscript of the array to highlight the corresponding element graphics. Then we must point to the next pointer + 1 every time.
Define a timer to trigger every 1 second to make the pointer + 1
Setinterval (function, time interval, ms unit) / / continuously execute the specified code and timer in the specified number of milliseconds
For this example, let's compare how to return to 0 after adding 4 from 0?
A very simple technique is used. A = (a + 1)% length
Explanation of modulus% taking: a / b = c...... d, d is the remainder, then a%b=d, a / b = c...... d, d is the remainder, then a%b=d, a / b = c...... d, d is the remainder, then a%b=d
When a = 4 a=4 a=4, according to this formula, a = (4 + 1)% 5 = 5% 5 = 0 a = (4 + 1)% 5 = 5 = 0 a = (4 + 1)% 5 = 5% 5 = 0
So you can continue to start from 0!
Circle the point! We need to find out the length of the current icon, which is the length: 5 in the above figure. We need to extract the 5 and save it
Definition: dataLen = mychart getOption(). series[0]. data. Length. At this time, datalength stores the array length 5.
JS code
 // 3. Auto highlight
  chartHover = function () {
    var dataLen = myChart.getOption().series[0].data.length
    // Cancels previously highlighted shapes
    myChart.dispatchAction({
      type: 'downplay',
      seriesIndex: 0,
      dataIndex: currentIndex2
    })
    currentIndex2 = (currentIndex2 + 1) % dataLen
    // Highlight the current drawing
    myChart.dispatchAction({
      type: 'highlight',
      seriesIndex: 0,
      dataIndex: currentIndex2
    })
    // Show tooltip
    myChart.dispatchAction({
      type: 'showTip',
      seriesIndex: 0,
      dataIndex: currentIndex2
    })
  }
  _this2.startCharts = setInterval(chartHover, 1000)
Automatically highlight when the mouse is removed
Bind mouseout time. The event will be triggered when the mouse is removed:
When the switch is off, [isSet = false] turns on [isSet = true]
  // 4. After the mouse is moved out, the automatic highlight is restored
  myChart.on('mouseout', function (param) {
    if (!isSet2) {
      _this2.startCharts = setInterval(chartHover, 1000)
      isSet2 = true
    }
  })
Take the full set of code templates and use them directly
/*******Highlight start**********/
  var _this2 = this
  var isSet2 = true // For judgment: when the mouse moves up, the automatic highlighting is cancelled
  var currentIndex2 = 0

  // 2. Highlight animation when the mouse moves up
  myChart.on('mouseover', function (param) {
    isSet2 = false
    clearInterval(_this2.startCharts)
    // Cancels previously highlighted shapes
    myChart.dispatchAction({
      type: 'downplay',
      seriesIndex: 0,
      dataIndex: currentIndex2
    })
    // Highlight the current drawing
    myChart.dispatchAction({
      type: 'highlight',
      seriesIndex: 0,
      dataIndex: param.dataIndex
    })
    // Show tooltip
    myChart.dispatchAction({
      type: 'showTip',
      seriesIndex: 0,
      dataIndex: param.dataIndex
    })
  })
  // 3. Auto highlight
  chartHover = function () {
    var dataLen = myChart.getOption().series[0].data.length
    // Cancels previously highlighted shapes
    myChart.dispatchAction({
      type: 'downplay',
      seriesIndex: 0,
      dataIndex: currentIndex2
    })
    currentIndex2 = (currentIndex2 + 1) % dataLen
    // Highlight the current drawing
    myChart.dispatchAction({
      type: 'highlight',
      seriesIndex: 0,
      dataIndex: currentIndex2
    })
    // Show tooltip
    myChart.dispatchAction({
      type: 'showTip',
      seriesIndex: 0,
      dataIndex: currentIndex2
    })
  }
  _this2.startCharts = setInterval(chartHover, 1000)
  // 4. After the mouse is moved out, the automatic highlight is restored
  myChart.on('mouseout', function (param) {
    if (!isSet2) {
      _this2.startCharts = setInterval(chartHover, 1000)
      isSet2 = true
    }
  })
  /*******Highlight end**********/
Dynamic highlighting can make the data more straightforward, without manual clicking each time, which is suitable for display on the public screen.