- The original content of GreatSQL community cannot be used without authorization. Please contact Xiaobian and indicate the source for reprint.
brief introduction
- Prometheus is an open-source combination of monitoring & Alarm & time series database. Usually, Kubernetes will cooperate with Prometheus for monitoring. Because the image of Prometheus is not powerful enough, Grafana will cooperate with Prometheus as a Dashboard for display.
- Grafana can also directly access MySQL's Performance Schema for presentation.
framework
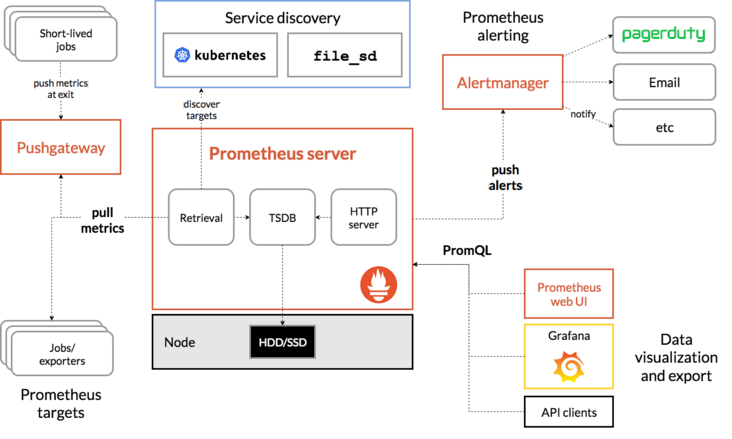
mysql exporter and node exporter are collected through Prometheus and displayed through Grafana
deploy
Based on docker deployment, this article is only presented as a local test
1. node_exporter deployment
- node_ The exporter will collect the usage of cpu, memory, disk and network card of the system. Since mysql itself does not collect the relevant configuration of the system, we can use node_exporter
cd /opt/node_exporter
wget https://github.com/prometheus/node_exporter/releases/download/v0.14.0/node_exporter-0.14.0.linux-amd64.tar.gz -O node_exporter.tar.gz
tar -zxf node_exporter.tar.gz
- Configure as system service
cat > /etc/systemd/system/node_exporter.service << EOF
[Unit]
Description=node_exporter
Documentation=https://prometheus.io/
After=network.target
[Service]
Type=simple
User=prometheus # System user name
ExecStart=/opt/node_exporter/node_exporter
Restart=on-failure
[Install]
WantedBy=multi-user.target
EOF
- Start service
systemctl enable node_exporter
systemctl start node_exporter
- see
curl 127.0.0.1:9100/metrics
Verify whether it is effective
2. mysql_exporter deployment
- mysql_ The exporter queries the performance of MySQL_ Generate corresponding metric from schema
- The database assigns a user to the exporter
  CREATE USER 'exporter'@'%' IDENTIFIED BY '123456' WITH MAX_USER_CONNECTIONS 3;
  GRANT PROCESS, REPLICATION CLIENT, SELECT ON *.* TO 'exporter'@'%';
  flush privileges;
- docker-compose.yml
version: '2.1'
services:
   mysqld-exporter:
    image: prom/mysqld-exporter
    container_name: mysqld-exporter
    environment:
      - DATA_SOURCE_NAME=exporter:123456@(192.168.5.242:3306)/
    ports:
    -  "9104:9104"
    restart: "always"
start-up
docker-compose up -d
- Check to see if it starts correctly
curl 127.0.0.1:9104/metrics
3.prometheus deployment
- prometheus profile
global:
  scrape_interval:     15s
  # By default, the frequency of grabbing the target
  evaluation_interval: 15s
  # Time interval for executing rules

scrape_configs:
  - job_name: 'prometheus'
    scrape_interval: 5s
    static_configs:
      - targets: ['localhost:9090']

  - job_name: 'mysql'
    static_configs:
      - targets: ['192.168.5.242:9104']
- targets: ['192.168.5.242:9100']- scrape_configs is mainly used to configure pull data nodes. Each pull configuration mainly includes the following parameters:
- job_name: Task name
- honor_labels:  It is used to solve the conflict between pull data labels. When set to true, The pulled data shall prevail, otherwise the service configuration shall prevail
- params: Request parameters for data pull access
- scrape_interval:  Pull interval
- scrape_timeout: Pull timeout
- metrics_path:  Pull node metric route
- scheme:  Pull data access protocol
- sample_limit:  The number of stored data labels is limited. If it exceeds the limit, the data will be ignored and will not be stored; The default value is 0, which means there is no limit
- relabel_configs:  Pull data to reset label configuration
- metric_relabel_configs: metric Reset label configuration
- prometheus container starts docker compose up - D
version: '3'

services:
  prometheus:
    user: "root"
    container_name: prometheus
    image: prom/prometheus:v2.2.1
    command:
      - --log.level=error
      - --storage.tsdb.path=/data/prometheus
      - --config.file=/etc/prometheus/prometheus.yml
    ports:
      - "9090:9090"
    volumes:
      - ./config/prometheus.yml:/etc/prometheus/prometheus.yml:ro
      - ./data:/data
    restart: on-failure
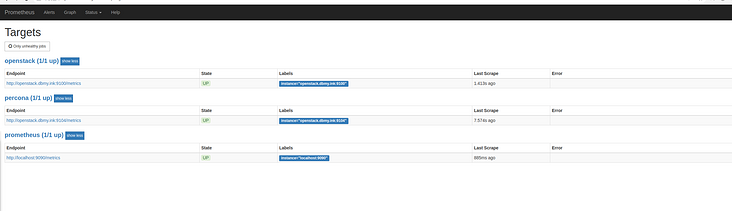
- Check 127.0.0.1:9090/targets to see if it is in
4. Grafana deployment
- rafana's docker compose yml
version: '3'

services:
  grafana:
    user: "0"
    container_name: grafana
    image: grafana/grafana:6.0.1
    environment:
      GF_LOG_LEVEL: info
      GF_PATHS_PROVISIONING: /etc/grafana/provisioning
      GF_PATHS_CONFIG: /etc/grafana/grafana.ini
    volumes:
      - ./data/grafana:/var/lib/grafana
    ports:
      - "3000:3000"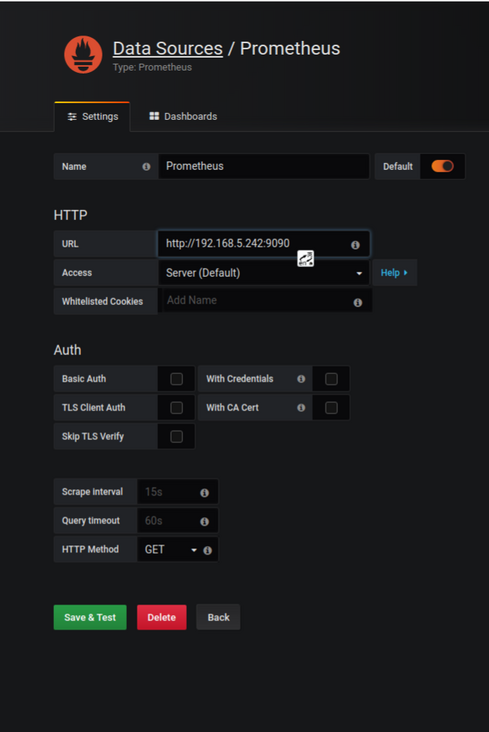
restart: on-failure- Enter through the page and configure prometheus as the data source
- Select import template
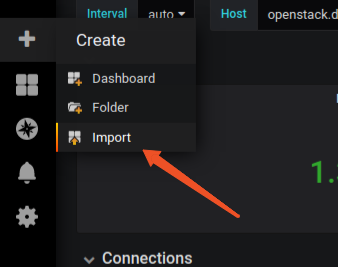
- Can import https://grafana.com/grafana/d... For the template provided by percona, you can also directly select the id. grafana will download the template according to the id
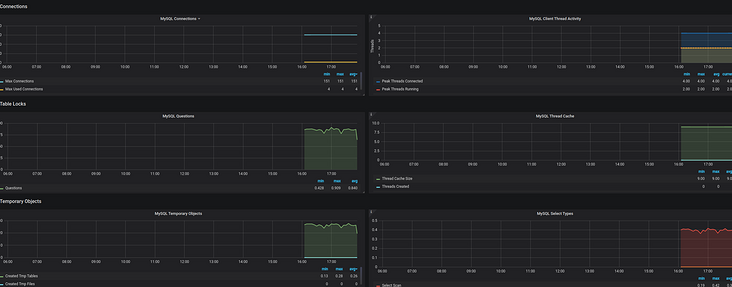
- The system configuration in the template aggregates data according to hosts, because it is a node used directly_ If the exporter is configured as a collection system, there is no System Charts,
- The simplest way is to modify the hosts of instance in Queries and directly replace it with '192.168.5.242:9100' node_ The name of the exporter
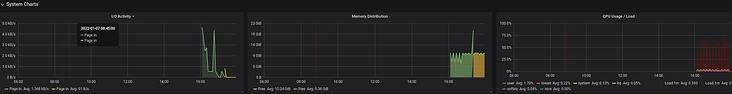
Such a basic monitoring platform has been built.
reference resources:
Enjoy GreatSQL :)
Article recommendation:
GreatSQL MGR FAQ
https://mp.weixin.qq.com/s/J6...
Wan Da #12, how can the MGR cluster automatically select the master without manual intervention
https://mp.weixin.qq.com/s/07...
"2021 data technology Carnival · ON LINE": evolution and practice of MySQL high availability architecture
https://mp.weixin.qq.com/s/u7...
Packet capture analysis of where an sql statement is slow
https://mp.weixin.qq.com/s/AY...
Wan Da #15, what are the conditions that may cause the MGR service to fail to start
https://mp.weixin.qq.com/s/in...
Technology sharing | why MGR consistency mode does not recommend AFTER
https://mp.weixin.qq.com/s/rN...
About GreatSQL
GreatSQL is a MySQL branch maintained by Wanli database. It focuses on improving the reliability and performance of MGR and supports the parallel query feature of InnoDB. It is a branch version of MySQL suitable for financial applications.
Gitee:
https://gitee.com/GreatSQL/Gr...
GitHub:
https://github.com/GreatSQL/G...
Bilibili:
https://space.bilibili.com/13...
Wechat & QQ group:
You can search and add GreatSQL community assistant wechat friends, send verification information "add group" to join GreatSQL/MGR communication wechat group
QQ group: 533341697
Wechat assistant: wanlidbc
This article is composed of blog one article multi posting platform OpenWrite release!