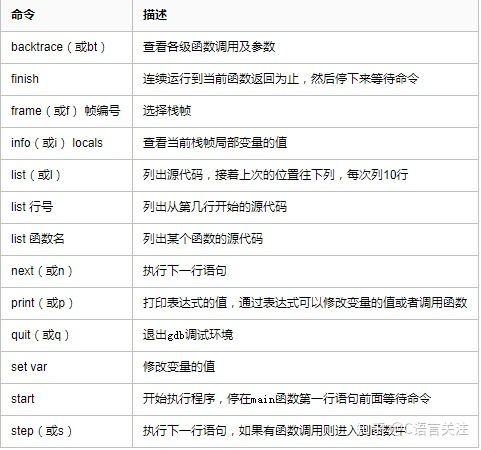
Common commands of gdb:
Linux Learning--gdb Debugging
2. Learning examples of gdb:
#include <stdio.h>

int add_range(int low, int high)
{
	int i, sum;
	for (i = low; i <= high; i++)
		sum = sum + i;
	return sum;
}

int main(void)
{
	int result[100];
	result[0] = add_range(1, 10);
	result[1] = add_range(1, 100);
	printf("result[0]=%d\nresult[1]=%d\n", result[0], result[1]);
	return 0;
}
The add_range function is added from low to high. In the main function, the result is saved from 1 to 10, then from 1 to 100, and then the result is saved. Finally, the two results printed are as follows:
result[0]=55
result[1]=5105
The first result is correct.[ 20 ] The second result is obviously incorrect. In elementary school, we have heard the story of Gauss's childhood. From 1 to 100, it should be 5050. A piece of code, the first run result is right, but the second run is wrong, this is a very common kind of error phenomenon, this situation should not doubt the code but the data, because the first run and the second run are the same piece of code, if the code is wrong, then why can the first run result be right? However, the data associated with the first and second runtimes may be different, and incorrect data can lead to incorrect results. Before debugging, the reader first tries to see if the code can see the cause of the error, as long as the previous chapters are well learned, they should be able to see.
When compiling, the - g option is added to generate executable files to debug at source level with gdb:
$ gcc -g main.c -o main
$ gdb main
GNU gdb 6.8-debian
Copyright (C) 2008 Free Software Foundation, Inc.
License GPLv3+: GNU GPL version 3 or later <http://gnu.org/licenses/gpl.html>
This is free software: you are free to change and redistribute it.
There is NO WARRANTY, to the extent permitted by law.  Type "show copying"
and "show warranty" for details.
This GDB was configured as "i486-linux-gnu"...
(gdb)
- The function of the g option is to add source code information to the executable file, such as which machine instruction in the executable file corresponds to the line of the source code, but it does not embed the whole source file into the executable file, so it is necessary to ensure that GDB can find the source file when debugging. GDB provides a Shell-like command-line environment. The above (gdb) is the prompt, under which you enter help to see the type of command:
(gdb) help
List of classes of commands:

aliases -- Aliases of other commands
breakpoints -- Making program stop at certain points
data -- Examining data
files -- Specifying and examining files
internals -- Maintenance commands
obscure -- Obscure features
running -- Running the program
stack -- Examining the stack
status -- Status inquiries
support -- Support facilities
tracepoints -- Tracing of program execution without stopping the program
user-defined -- User-defined commands

Type "help" followed by a class name for a list of commands in that class.
Type "help all" for the list of all commands.
Type "help" followed by command name for full documentation.
Type "apropos word" to search for commands related to "word".
Command name abbreviations are allowed if unambiguous.
You can also further see which commands are available in a particular category, such as those under the files category:
(gdb) help files
Specifying and examining files.

List of commands:

add-shared-symbol-files -- Load the symbols from shared objects in the dynamic linker's link map
add-symbol-file -- Load symbols from FILE
add-symbol-file-from-memory -- Load the symbols out of memory from a dynamically loaded object file
cd -- Set working directory to DIR for debugger and program being debugged
core-file -- Use FILE as core dump for examining memory and registers
directory -- Add directory DIR to beginning of search path for source files
edit -- Edit specified file or function
exec-file -- Use FILE as program for getting contents of pure memory
file -- Use FILE as program to be debugged
forward-search -- Search for regular expression (see regex(3)) from last line listed
generate-core-file -- Save a core file with the current state of the debugged process
list -- List specified function or line
...
Now try listing the source code from the first line with the list command:
(gdb) list 1
1	#include <stdio.h>
2
3	int add_range(int low, int high)
4	{
5		int i, sum;
6		for (i = low; i <= high; i++)
7			sum = sum + i;
8		return sum;
9	}
10
Only 10 rows at a time. If you want to continue the source code from line 11, you can enter
(gdb) list
You can also knock back directly without losing anything. gdb provides a very convenient function to knock back directly at the prompt to repeat the previous command.
(gdb) (Direct return
11	int main(void)
12	{
13		int result[100];
14		result[0] = add_range(1, 10);
15		result[1] = add_range(1, 100);
16		printf("result[0]=%d\nresult[1]=%d\n", result[0], result[1]);
17		return 0;
18
Many commands commonly used in gdb are abbreviated. For example, list command can be written as l, and the source code for listing a function can also be used as a parameter:
(gdb) l add_range
1	#include <stdio.h>
2
3	int add_range(int low, int high)
4	{
5		int i, sum;
6		for (i = low; i <= high; i++)
7			sum = sum + i;
8		return sum;
9	}
10
Now exit the environment of gdb:
(gdb) quit
We did an experiment to rename or move the source code elsewhere and debug it with gdb, so that we could not list the source code.
$ mv main.c mian.c
$ gdb main
...
(gdb) l
5	main.c: No such file or directory.
	in main.c
It can be seen that the - g option of gcc does not embed the source code into the executable file, and the source file is also needed when debugging. Now restore the source code as it is, and we'll continue debugging. Start the program with the start command:
$ gdb main
...
(gdb) start
Breakpoint 1 at 0x80483ad: file main.c, line 14.
Starting program: /home/akaedu/main
main () at main.c:14
14		result[0] = add_range(1, 10);
(gdb)
gdb stops at the first statement after the variable definition in main function and waits for our command. The statement listed by gdb is the next statement to be executed. We can use the next command (abbreviated as n) to control the execution of these statements one by one:
(gdb) n
15		result[1] = add_range(1, 100);
(gdb) (Direct return
16		printf("result[0]=%d\nresult[1]=%d\n", result[0], result[1]);
(gdb) (Direct return
result[0]=55
result[1]=5105
17		return 0;
Use the n command to execute two lines of assignment statement and one line of print statement in turn. When the print statement is executed, the result is typed immediately. Then stop before the return statement and wait for us to issue the command. Although we have complete control over the execution of the program, we still can't see what's wrong, because the error is not in the main function but in the add_range function. Now we use the start command again. This time we use the step command (s) to drill into the add_range function to track the execution:
(gdb) start
The program being debugged has been started already.
Start it from the beginning? (y or n) y

Breakpoint 2 at 0x80483ad: file main.c, line 14.
Starting program: /home/akaedu/main
main () at main.c:14
14		result[0] = add_range(1, 10);
(gdb) s
add_range (low=1, high=10) at main.c:6
6		for (i = low; i <= high; i++)
This time it stops at the first statement after the variable definition in the add_range function. There are several ways to view state in functions. The backtrace command (abbreviated as bt) can view stack frames of function calls:
(gdb) bt
#0  add_range (low=1, high=10) at main.c:6
#1  0x080483c1 in main () at main.c:14
It can be seen that the current add_range function is called by main function, and the parameters passed in by main are low = 1 and high = 10. The stack frame number of main function is 1, and the stack frame number of add_range is 0. Now you can use the info command (abbreviated as i) to see the value of the local variable of the add_range function:
(gdb) i locals
i = 0
sum = 0
If you want to see the value of the current local variable of the main function, you can also do this by first selecting the 1 stack frame with the frame command (abbreviated as f) and then looking at the local variable:
(gdb) f 1
#1  0x080483c1 in main () at main.c:14
14		result[0] = add_range(1, 10);
(gdb) i locals
result = {0, 0, 0, 0, 0, 0, 134513196, 225011984, -1208685768, -1081160480,
...
  -1208623680}
Noting that many elements in the result array have chaotic values, we know that uninitialized local variables have uncertain values. So far everything has been normal. Take a few steps down with s or n, and print out the value of the variable sum with the print command (abbreviated as p):
(gdb) s
7			sum = sum + i;
(gdb) (Direct return
6		for (i = low; i <= high; i++)
(gdb) (Direct return
7			sum = sum + i;
(gdb) (Direct return
6		for (i = low; i <= high; i++)
(gdb) p sum
$1 = 3
The first cycle i is 1, and the second cycle i is 2, which adds up to 3. That's right. Here, $1 means that gdb keeps these intermediate results, and the number after $increases automatically, replacing the corresponding values with the numbers of $1, $2, $3 in the command. Since we already know that the result of the first call is correct, it doesn't make sense to follow it down. We can use the finish command to keep the program running until it returns from the current function:
(gdb) finish
Run till exit from #0  add_range (low=1, high=10) at main.c:6
0x080483c1 in main () at main.c:14
14		result[0] = add_range(1, 10);
Value returned is $2 = 55
The return value is 55. We are currently preparing to perform an assignment operation, assign it with the s command, and then look at the result array:
(gdb) s
15		result[1] = add_range(1, 100);
(gdb) p result
$3 = {55, 0, 0, 0, 0, 0, 134513196, 225011984, -1208685768, -1081160480,
...
  -1208623680}
The first value 55 does assign the zero element of the result array. Next, use the s command to enter the second add_range call, and after entering, first look at the parameters and local variables:
(gdb) s
add_range (low=1, high=100) at main.c:6
6		for (i = low; i <= high; i++)
(gdb) bt
#0  add_range (low=1, high=100) at main.c:6
#1  0x080483db in main () at main.c:15
(gdb) i locals
i = 11
sum = 55
Because the local variables i and sum are not initialized, they have uncertain values, and because the two calls are adjacent, i and sum just take the value of the last call, which is the same as the original. Example 3.7 "Verify the allocation and release of local variable storage space" It's the same thing, but the example i've given here tries to make the local variable sum zero on the first call. It doesn't matter if the initial value of i is not zero, it will be assigned zero in the for loop, but if the initial value of sum is not zero, the cumulative result will be wrong. Well, we've found the cause of the error and can quit gdb to modify the source code. If we don't want to waste this debugging opportunity, we can immediately change the initial value of sum to 0 in gdb to continue running, and see if there are any other Bug s after this change:
(gdb) set var sum=0
(gdb) finish
Run till exit from #0  add_range (low=1, high=100) at main.c:6
0x080483db in main () at main.c:15
15		result[1] = add_range(1, 100);
Value returned is $4 = 5050
(gdb) n
16		printf("result[0]=%d\nresult[1]=%d\n", result[0], result[1]);
(gdb) (Direct return
result[0]=55
result[1]=5050
17		return 0;
That's the right result. In addition to the set command, you can also use the print command to modify the value of a variable, because the print command is followed by an expression, and we know that assignment and function call are also expressions, so you can also use the print command to modify the value of a variable or call a function:
(gdb) p result[2]=33
$5 = 33
(gdb) p printf("result[2]=%d\n", result[2])
result[2]=33
$6 = 13