Summary
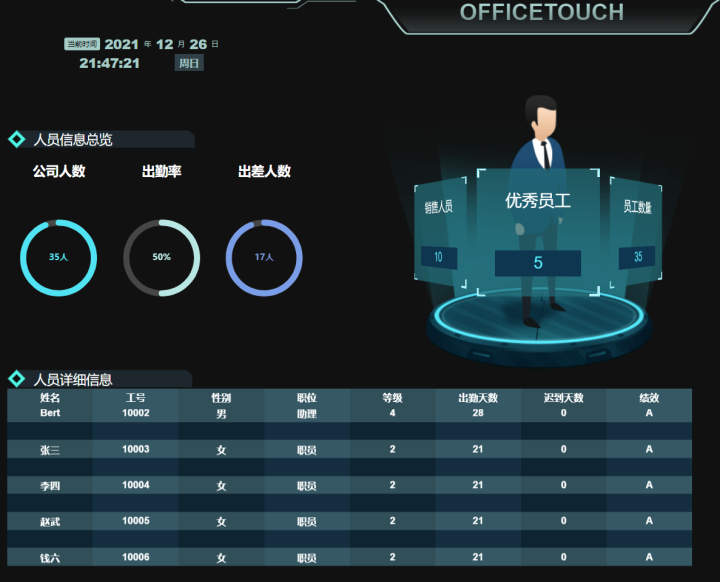
(showcase OF OFs)
OFPreviously, python was introduced for data visualization, data analysis and some small projects, but the basic knowledge is backend. To make a good visualization screen, we also need to learn some front-end knowledge (vue), there are many more complex online (need to execute a variety OF commands) and incomplete tutorials. Today OFwill fully explain how to make a good visualization screen with vue. As long as you follow the steps, you can also achieve your own visualization project.
Main Content: Vue Write Visual Large Screen
For people: Beginners in Python, Beginners in Front End/Vue
Prepare software: pycharm
1. Preparing for installation
Before writing a large screen, we need to install two things: the vue plug-in and the node.js.
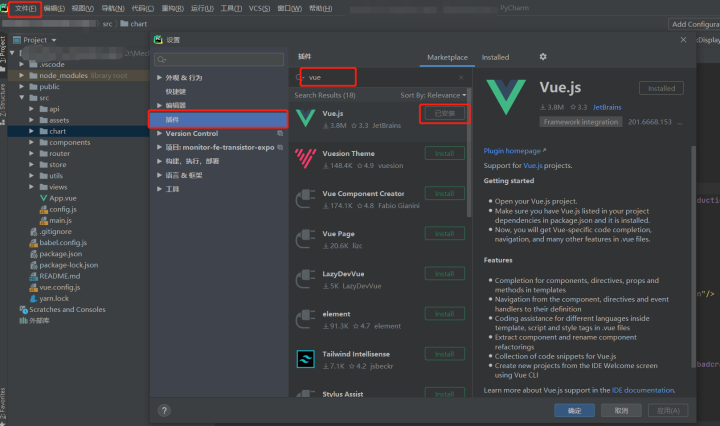
Install vue plug-in in pycharm; (installing vue with pycharm is very simple and does not require a bunch of commands)
1.1 Open pycharm, click File-Settings-Plugins, search for "vue" in the search bar, and click install. Wait until the installation is complete.
Install node.js is for use with npm instructions, download address: Node.js
1.2 After downloading, install by default (installation path can be modified by yourself).
2. First Identity VUE
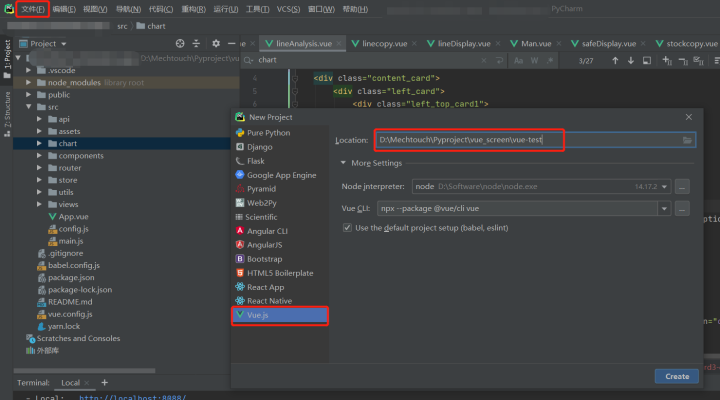
When the preparation is complete, we can start creating the VUE project.
2.1 Click File-New Project and select Vue in the pop-up window. Js, then modify the path address in the Location bar, click "creat e" in the lower right corner
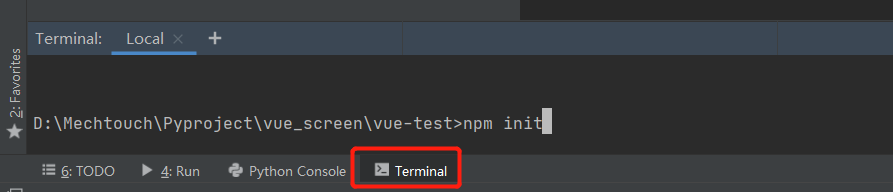
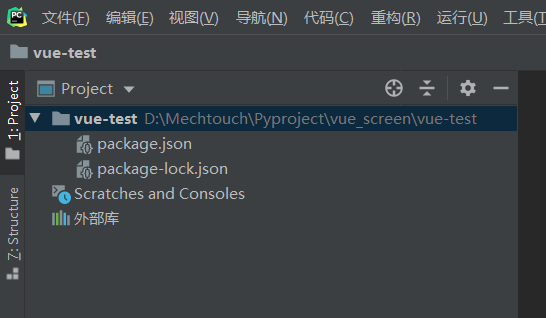
2.2 We can see the newly created vue project, the directory is blank, and npm init is executed under pycharm's Terminal window to generate the package.json file, which is important. (Note: If permissions are incorrect at the time of execution, we will delete the npmrc file (the.Npmrc file under C:\Users\{Account}\)
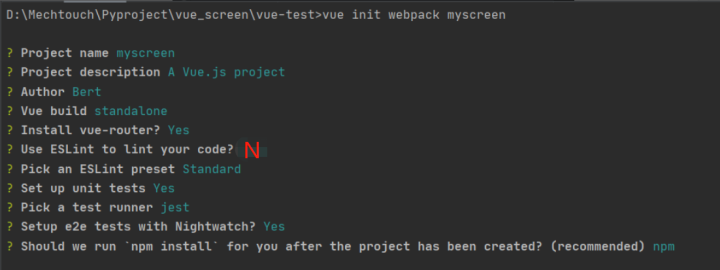
2.3 Initialize a full version of the project: execute the vue init webpack myscreen command under pycharm's Terminal window, then you can select and enter as follows, waiting for the automatic installation.
2.4 Installation Successful: Installation Successful appears as follows.
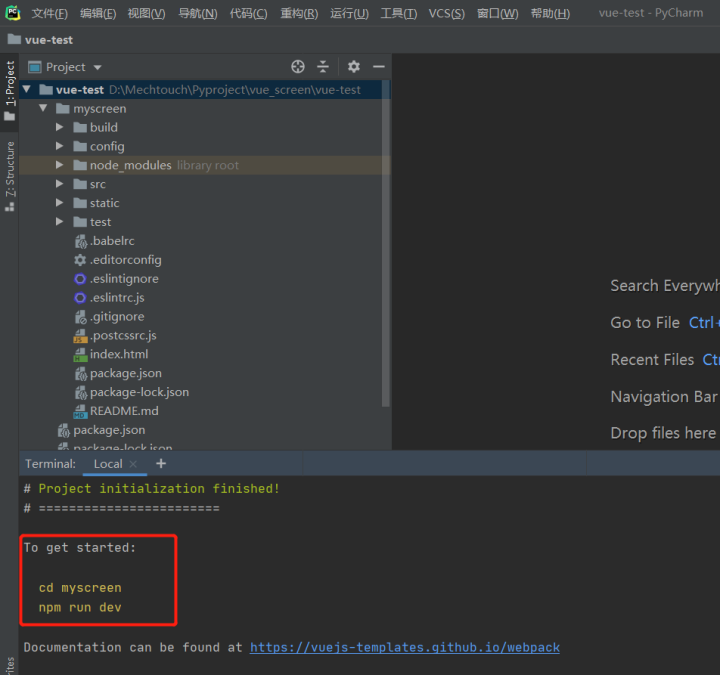
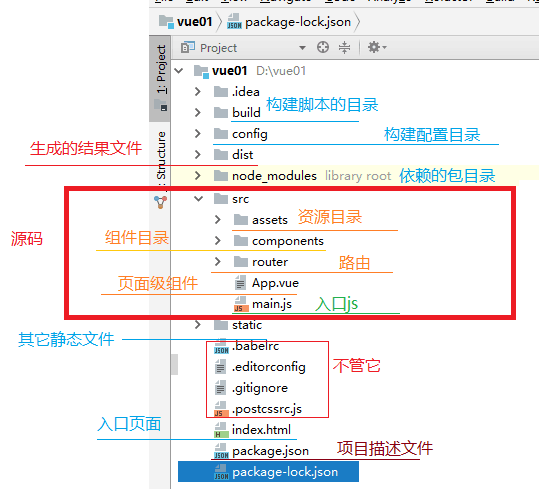
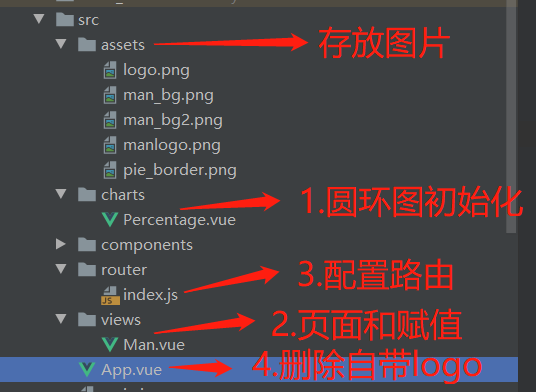
Let's illustrate the role of folders/files in this directory. We mainly use the contents under the src folder.
3. Typescript
Coding in vue is similar to HTML in that it has three parts overall:
1) template: Write what you want to show like a body in HTML;
2) script:HTML commonly used javascript,;
3) style: basically the same as style in HTML.
Before writing the chart, we use Typescript to briefly describe the properties of the script section for beginners to understand.
The TypeScript program consists of modules (the relationship between the two modules is established by using import and export), functions, variables, statements and expressions, and comments.
<script>
var [Variable Name] = value    //variable
export default{    //Modular
    name:'Percentage',
    props:{},      //props is the only interface for child components to access parent component data
    data(){
      return {}
    },             //Functions for storing data
    mounted(){},   //Hook function, executed after html loading is complete, execution order: child component-parent component
    computed:{},   //Calculating attributes, that is, relying on other attributes to calculate the final value
    watch:{},      //Listen for attributes, listen for changes in a value, and then execute the corresponding function
    methods:{},    //Event Method Execution
}
</script>
Note: For introducing the sass style, the following commands (installing a lower version) need to be executed in terminal or run unsuccessfully.
npm install sass-loader@7.3.1 --save-dev
npm install node-sass@4.14.1 --save-dev
4. Writing Common Charts
Through the preparation of the above three parts, we can formally enter the writing of chart content, Vue is powerful than the convenience of the application of component.
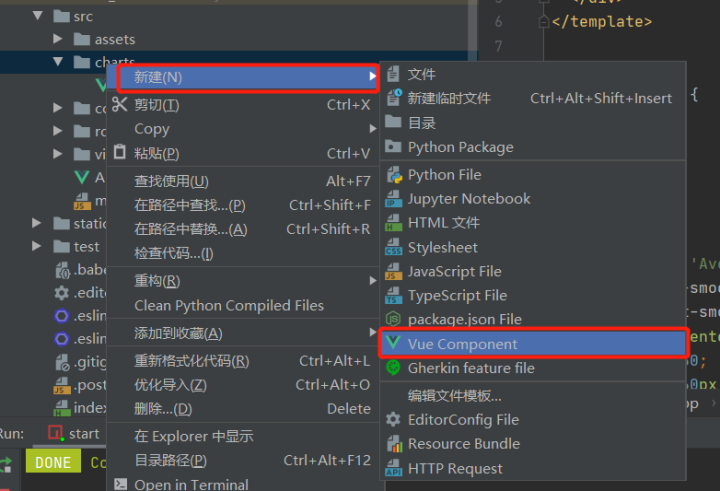
4.1 OF Take the torus chart as an example, there are many places for charts to use, so a new charts folder is created to store the vue files of various charts, and then a new Vue Component file is created in the charts folder, as follows:
4.2 Write the initialization code for the circle chart. This time we do three circle charts, then our Percentage. The Vue is the parent component.
<template>
    <div class="percentage"> </div>
</template>
<script>
export default {
    name:'Percentage',
    props:{
        containerId:String,
        option:{}
    },
    data(){
        return {
            option1:{
                color:'#516c72',
                series: [{
                    type: 'gauge',
                    startAngle: 90,
                    endAngle: -270,
                    pointer: {
                        show: false
                    },
                    progress: {
                        show: true,
                        overlap: false,
                        roundCap: true,
                        clip: false,
                    },
                    axisLine: {
                        lineStyle: {
                           color: [[1, '#464646']],
                            width: 10,
                        }
                    },
                    splitLine: {
                        show: false,
                        distance: 0,
                        length: 10
                    },
                    axisTick: {
                        show: false
                    },
                    axisLabel: {
                        show: false,
                        distance: 50,
                        backgroundColor:'red'
                    },
                    data: [{
                        value: 20,
                        detail: {
                            offsetCenter: ['0%', '0%']
                        }
                    },
                    ],
                    title: {
                        fontSize: 14
                    },
                    detail: {
                        width: 50,
                        height: 14,
                        fontSize: 14,
                        color: 'auto',
                        formatter: '{value}%'
                    }
                }]
            },
        }
    },
    methods:{
        initChart(newOption){
            if(newOption.series){
                this.option1.series[0].data[0].value = newOption.series[0].data[0].value ;
                this.option1.series[0].detail.formatter = newOption.series[0].detail.formatter;
                if(newOption.color){
                    this.option1.color = newOption.color
                }
            }
            let myChart = this.$echarts.init(
                document.getElementById(this.containerId)
            );
            //  console.log('this.option1',this.option1)
            myChart.setOption(this.option1);
        },
    }
}
</script>
<style scoped>
    .percentage{
        width: 100%;
        height: 100%;
    }
</style>
4.3 Assign values to the three rings, and we can do that directly in Percentage. Write in vue, but to facilitate reuse, add another subcomponent: create a new views folder, and create a new Man under the views folder. Vue file. (import Percentage from'.. /charts/Percentage')
<template>
<div class="home">
<div class="content_card">
<div class="left_card">
<div class="left_middle_card">
<div class="left_middle_chart_card">
<div class="left_middle_left_chart_card">
<div class="safe_title_spec">Overview of personnel information</div>
<div class="left_middle_left_chart_card_content">
<div class="tip">
<h3 class="titletip">Number of Companies</h3>
<div id="manchart" class="chart_card">
<percentage ref="manpercentage" :containerId="'manchart'" :option="manoption"/>
</div>
</div>
<div class="tip">
<h3 class="titletip">Attendance</h3>
<div id="man2chart" class="chart_card">
<percentage ref="man2percentage" :containerId="'man2chart'" :option="man2option"/>
</div>
</div>
<div class="tip">
<h3 class="titletip">Number of travelers</h3>
<div id="man3chart" class="chart_card">
<percentage ref="man3percentage" :containerId="'man3chart'" :option="man3option"/>
</div>
</div>
</div>
</div>
</div>
</div>
</div>
</div>
</div>
</template>
<script>
// @ is an alias to /src
import Percentage from '../charts/Percentage'
export default {
name: 'staff',
components: {
Percentage,
},
data(){
return {
manoption:{
color:'#45e2f5',
series: [{
data: [
{ name: 'itemA', value: 94}
],
detail: {
formatter: '35 people'
}
}]
},
man2option:{
color:'#b7e8e4',
series: [{
data: [
{ name: 'itemA', value: 50}
],
detail: {
formatter: '{value}%'
}
}]
},
man3option:{
color:'#7a9ae7',
series: [{
data: [
{ name: 'itemA', value: 17 }
],
detail: {
formatter: '17 people'
}
}]
},
}
},
mounted(){
this.chartInit()
},
methods:{
chartInit(){
this.$refs.manpercentage.initChart(this.manoption)
this.$refs.man2percentage.initChart(this.man2option)
this.$refs.man3percentage.initChart(this.man3option)
},
}
}
</script>
<style lang="scss" scoped>
.home{
height: 100%;
background-color: #111;
padding: 1%;
.content_card{
width: 100%;
height: 95%;
display: flex;
justify-content: flex-start;
// margin-top: 2%;
.safe_title_spec{
height: 50%;
background: url(data:image/png) no-repeat;
background-size: contain;
color: #fff;
font-size: 1.5rem;
display: flex;
align-items: center;
text-indent: 2rem;
}
div{
width: 100%;
//height: 100%;
// border: 1px solid white;
}
>div.left_card{
width: 60%;
height: 100%;
.left_middle_card{
width: 100%;
height:90%;
.left_middle_chart_card{
height: 80%;
display: flex;
.tip{
.titletip{
font-size: 1.5rem;
color: #fff;
}
}
.left_middle_left_chart_card{
height: 100%;
width: 50%;
margin-top: 1%;
.left_middle_left_chart_card_content{
height: 100%;
display: flex;
.chart_card{
height: 150px;
width: 180px;
}
}
}
}
}
}
}
}
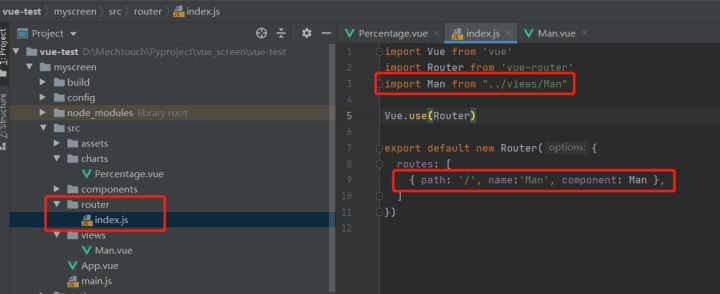
</style>4.4 Configure routes, click the router folder - enter index.js, modify the code as follows:
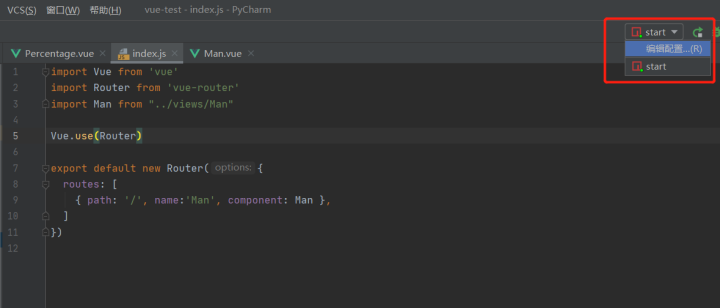
4.5 There are two ways to run vue:
1) Click on the terminal below pycharm to execute the run command npm run dev
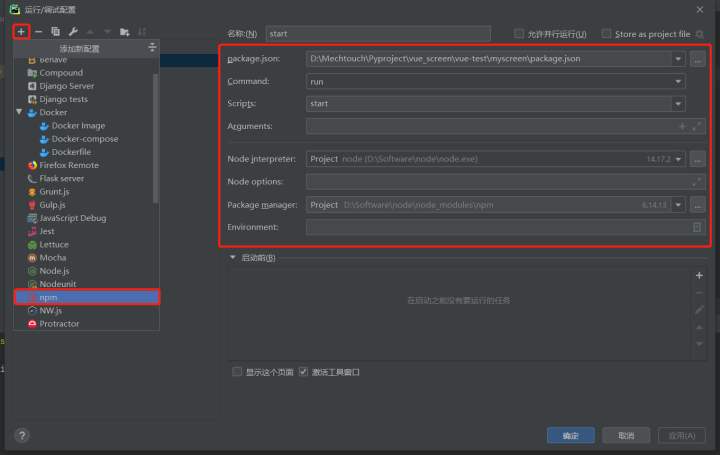
2) Set the npm Run Configuration in the upper right corner. The advantage is that once set, we can click Run directly in the future, as shown below
Run result:
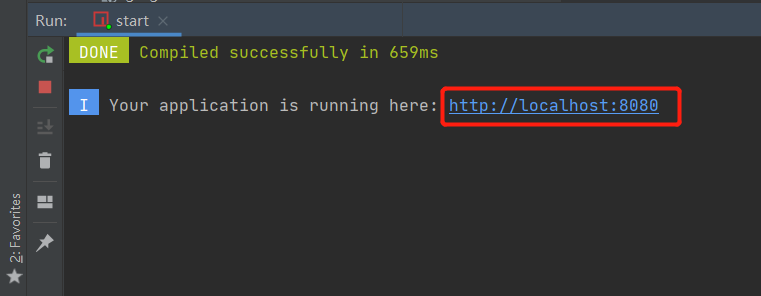
Clicking on a link will automatically open the browser
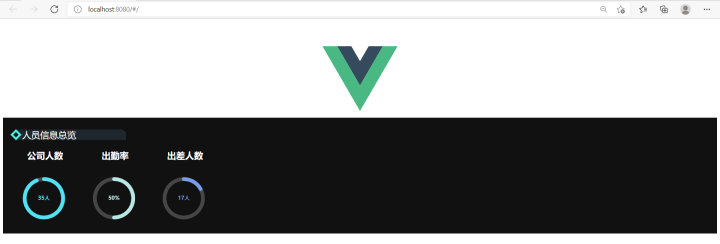
We can see a V sign, we can go to App. In the Vue file, delete the following picture contents
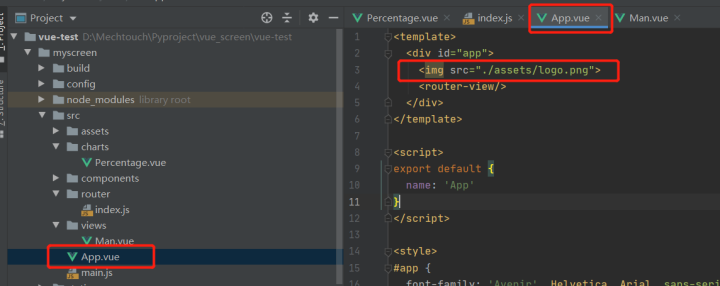
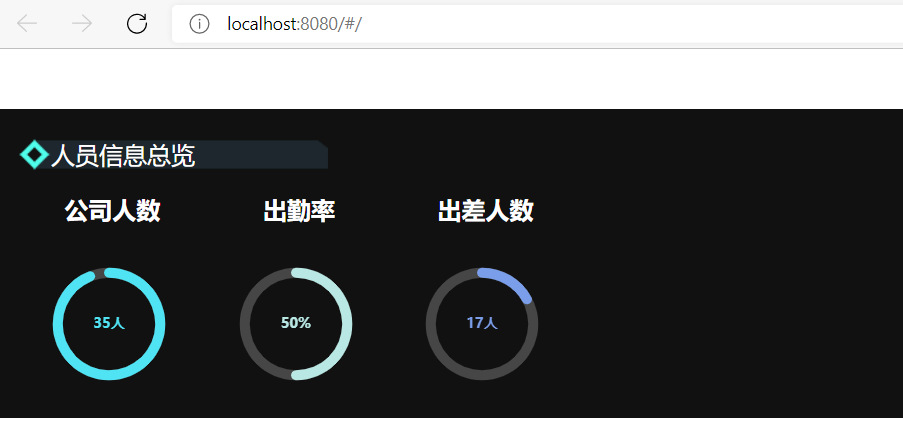
After deleting this code, you do not need to click Run again. The browser you just opened will automatically update the results
Thank you for this in Man. The following code in vue:
mounted(){ this.chartInit() }, //mounted(){} hook function, executed after html loading is complete, execution order: child component-parent componentV. Summary
Did the students feel dizzy? In fact, it is very simple to do one operation in each file. OF summarizes the file structure that needs to be written code.
It is almost a new year. Happy New Year to you all in advance. Summarize yourself and see if you have learned new skills and achieved your goals this year.