1, Decision tree
1. Concept
Decision tree is a classification algorithm based on tree structure. We hope to learn a model (i.e. decision tree) from a given training data set and use the model to classify new samples. The decision tree can intuitively show the classification process and results. Once the model is built successfully, the classification efficiency of new samples is also quite high.
2. information entropy
Assume current sample set D pass the civil examinations k The proportion of class samples is pk(k=1,,2,...,
|y|),be D The information entropy of is defined as: Ent(D) = -∑k=1 pk·log2 pk appointment
 if p=0,be log2 p=0)obviously, Ent(D)The smaller the value, D The higher the purity of. because
0<=pk<= 1,so log2 pk<=0,Ent(D)>=0. In extreme cases, consider D in
 If the samples belong to the same category, the Ent(D)The value is 0 (the minimum value is taken). When D
 When the samples belong to different categories, Ent(D)Get the maximum value log2 |y|.
3. information gain
  Assumed discrete attribute a have V Possible values{a1,a2,...,aV}. If used a
  For sample set D Classification will be generated V Branch nodes, note Dv For the first v Individual points
  Included in the branch node D All properties in a The upper value is av A sample of. Different branching nodes
  We give different weights to branch nodes when the number of point samples is different:|Dv|/|D|, Should
  The weight gives greater influence to the branch nodes with more samples. Therefore, the attribute is used a yes
  Sample set D The information gain obtained by dividing is defined as: Gain(D,a) = Ent(D)-∑v=1 |Dv|/|D|·Ent(Dv)
Where Ent(D) is the information entropy before data set D division, and Σ v=1 |Dv|/|D | · Ent(Dv) can be expressed as the information entropy after division. The "front back" results show the reduction of information entropy obtained by this division, that is, the improvement of purity. Obviously, the greater the Gain(D,a), the greater the purity improvement, and the better the effect of this division.
4. Gain ratio
  The optimal attribute division principle based on information gain -- information gain criterion
  Attributes with more data are preferred. C4.5 The algorithm uses gain rate to replace information gain
  Select the optimal partition attribute, and the gain rate is defined as: Gain_ratio(D,a) = Gain(D,a)/IV(a
  among IV(a) = -∑v=1 |Dv|/|D|·log2 |Dv|/|D|
It is called the intrinsic value of attribute a. The greater the number of possible values of attribute a (i.e. the greater V), the greater the value of IV(a). This eliminates the preference for attributes with more value data to a certain extent.
In fact, the gain rate criterion has a preference for attributes with a small number of values. C4.5 algorithm does not directly use the gain rate criterion, but first finds the attributes with higher information gain than the average level from the candidate partition attributes, and then selects the attribute with the highest gain rate.
Next, we will build a decision tree model for the watermelon samples in the following table.

5. Code implementation
1. Import module
#Import module
import pandas as pd
import numpy as np
from collections import Counter
from math import log2
Read with pandas module_ Excel () function reads data text; Use numpy module to convert dataframe into list; Count with Counter; Use the log2 function of math module to calculate the logarithm. It will be reflected in the following code.
2. Data acquisition and processing function
#Data acquisition and processing
def getData(filePath):
    data = pd.read_excel(filePath)
    return data

def dataDeal(data):
    dataList = np.array(data).tolist()
    dataSet = [element[1:] for element in dataList]
    return dataSet
getData() through read in the pandas module_ The EXCEL () function reads the sample data. I tried to save the data file in csv format, but it is not very good for Chinese processing, so I chose to use xls format file.
The dataDeal() function converts the dataframe to a list and removes the numbered column. The number column is not an attribute of watermelon. In fact, if it is regarded as an attribute, it will get the maximum information gain.
These two functions can be combined into the same function, but I want to use data (dataframe structure with attribute tag) and dataSet (list) data samples respectively, so I write two functions separately.
3. Get attribute name
#Get property name
def getLabels(data):
    labels = list(data.columns)[1:-1]
    return labels
Very simple, get the attribute name: texture, color, root, knock, navel, touch.
4. Get category tag
#Get category tag
def targetClass(dataSet):
    classification = set([element[-1] for element in dataSet])
    return classification
Get the mark of whether a sample is good (yes or no).
5. Leaf node marking
#Mark the branch node as the leaf node, and select the class with the largest number of samples as the class mark
def majorityRule(dataSet):
    mostKind = Counter([element[-1] for element in dataSet]).most_common(1)
    majorityKind = mostKind[0][0]
    return majorityKind
6. Calculate information entropy
#Calculating information entropy
def infoEntropy(dataSet):
    classColumnCnt = Counter([element[-1] for element in dataSet])
    Ent = 0
    for symbol in classColumnCnt:
        p_k = classColumnCnt[symbol]/len(dataSet)
        Ent = Ent-p_k*log2(p_k)
    return Ent
7. Sub dataset construction
#Sub dataset construction
def makeAttributeData(dataSet,value,iColumn):
    attributeData = []
    for element in dataSet:
        if element[iColumn]==value:
            row = element[:iColumn]
            row.extend(element[iColumn+1:])
            attributeData.append(row)
    return attributeData
Data under a certain attribute value, such as a dataset with clear texture.
8. Calculate information gain
#Calculate information gain
def infoGain(dataSet,iColumn):
    Ent = infoEntropy(dataSet)
    tempGain = 0.0
    attribute = set([element[iColumn] for element in dataSet])
    for value in attribute:
        attributeData = makeAttributeData(dataSet,value,iColumn)
        tempGain = tempGain+len(attributeData)/len(dataSet)*infoEntropy(attributeData)
        Gain = Ent-tempGain
    return Gain
9. Select the optimal attribute
#Select optimal attribute
def selectOptimalAttribute(dataSet,labels):
    bestGain = 0
    sequence = 0
    for iColumn in range(0,len(labels)):#Ignore the last category column
        Gain = infoGain(dataSet,iColumn)
        if Gain>bestGain:
            bestGain = Gain
            sequence = iColumn
        print(labels[iColumn],Gain)
    return sequence
10. Establish decision tree
#Establish decision tree
def createTree(dataSet,labels):
    classification = targetClass(dataSet) #Get category type (collection de duplication)
    if len(classification) == 1:
        return list(classification)[0]
    if len(labels) == 1:
        return majorityRule(dataSet)#Return categories with more sample types
    sequence = selectOptimalAttribute(dataSet,labels)
    print(labels)
    optimalAttribute = labels[sequence]
    del(labels[sequence])
    myTree = {optimalAttribute:{}}
    attribute = set([element[sequence] for element in dataSet])
    for value in attribute:

        print(myTree)
        print(value)
        subLabels = labels[:]
        myTree[optimalAttribute][value] =  \
                createTree(makeAttributeData(dataSet,value,sequence),subLabels)
    return myTree
The tree itself is not complex and is implemented recursively.
11. Define main function
def main():
    filePath = 'watermelonData.xls'
    data = getData(filePath)
    dataSet = dataDeal(data)
    labels = getLabels(data)
    myTree = createTree(dataSet,labels)
    return myTree
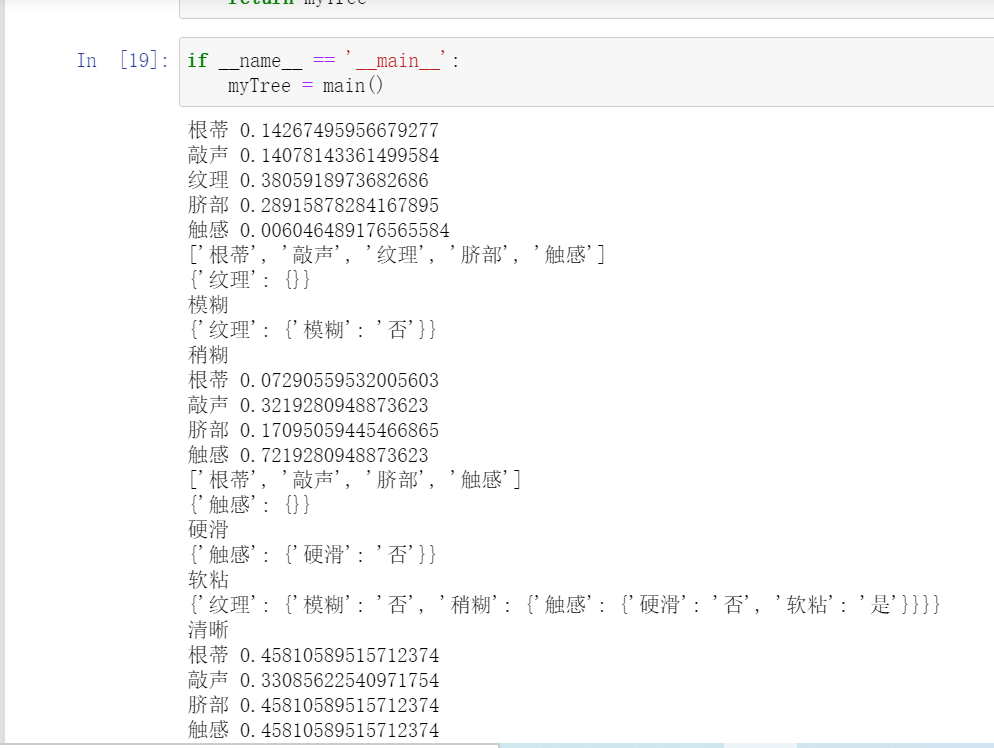
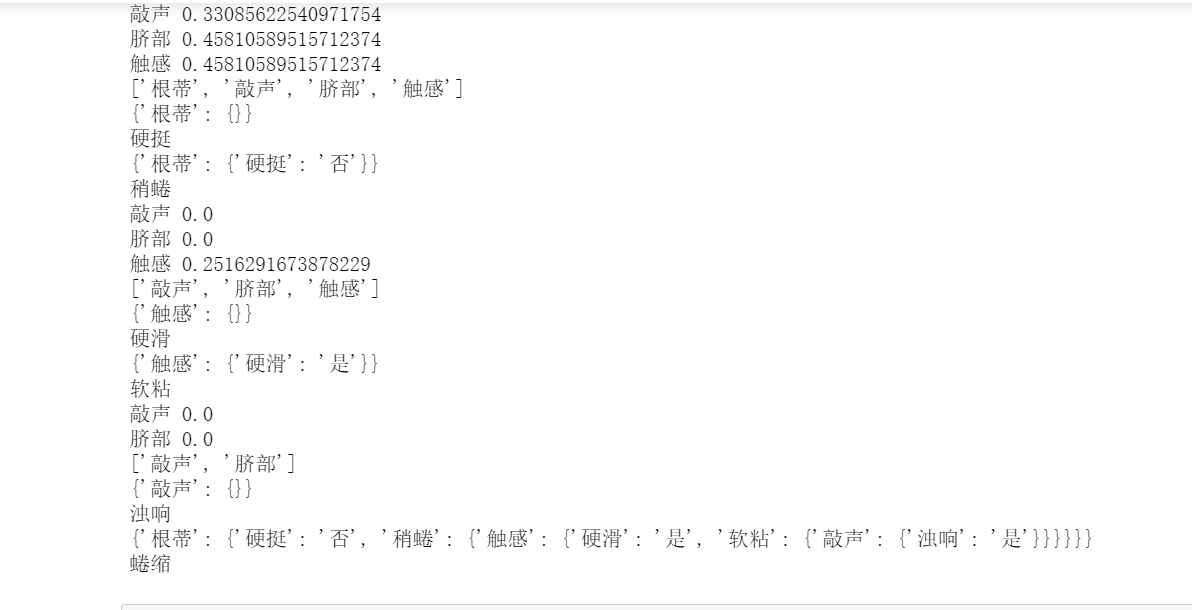
12. Spanning tree
if __name__ == '__main__':
    myTree = main()
6. Draw decision tree
#Drawing a decision tree using Matlotlib
import matplotlib.pyplot as plt

#Format text boxes and arrows
decisionNode = dict(boxstyle = "sawtooth", fc = "0.8")
leafNode = dict(boxstyle = "round4", fc = "0.8")
arrow_args = dict(arrowstyle = "<-")
plt.rcParams['font.sans-serif'] = ['SimHei']
plt.rcParams['font.family'] = 'sans-serif'

#Draw node
def plotNode(nodeTxt, centerPt, parentPt, nodeType):
    createPlot.ax1.annotate(nodeTxt, xy = parentPt,\
    xycoords = "axes fraction", xytext = centerPt, textcoords = 'axes fraction',\
    va = "center", ha = "center", bbox = nodeType, arrowprops = arrow_args)

#Gets the number of leaf nodes of the decision tree
def getNumLeafs(myTree):
    leafNumber = 0
    firstStr = list(myTree.keys())[0]
    secondDict = myTree[firstStr]
    for key in secondDict.keys():
        if(type(secondDict[key]).__name__ == 'dict'):
            leafNumber = leafNumber + getNumLeafs(secondDict[key])
        else:
            leafNumber += 1
    return leafNumber

#Get the height of the decision tree (recursive)
def getTreeDepth(myTree):
    maxDepth = 0
    firstStr = list(myTree.keys())[0]
    secondDict = myTree[firstStr]
    for key in secondDict.keys():
        #test to see if the nodes are dictonaires, if not they are leaf nodes
        if type(secondDict[key]).__name__=='dict':
            thisDepth = 1 + getTreeDepth(secondDict[key])
        else:   thisDepth = 1
        if thisDepth > maxDepth: maxDepth = thisDepth
    return maxDepth

#Add information to parent-child nodes
def plotMidText(cntrPt, parentPt, txtString):
    xMid = (parentPt[0]-cntrPt[0])/2.0 + cntrPt[0]
    yMid = (parentPt[1]-cntrPt[1])/2.0 + cntrPt[1]
    createPlot.ax1.text(xMid, yMid, txtString, va="center", ha="center", rotation=30)

#Painting tree
def plotTree(myTree, parentPt, nodeTxt):#if the first key tells you what feat was split on
    numLeafs = getNumLeafs(myTree)  #this determines the x width of this tree
    depth = getTreeDepth(myTree)
    firstStr = list(myTree.keys())[0]     #the text label for this node should be this
    cntrPt = (plotTree.xOff + (1.0 + float(numLeafs))/2.0/plotTree.totalW, plotTree.yOff)
    plotMidText(cntrPt, parentPt, nodeTxt)
    plotNode(firstStr, cntrPt, parentPt, decisionNode)
    secondDict = myTree[firstStr]
    plotTree.yOff = plotTree.yOff - 1.0/plotTree.totalD
    for key in secondDict.keys():
        if type(secondDict[key]).__name__=='dict':
            plotTree(secondDict[key],cntrPt,str(key))        #recursion
        else:   #it's a leaf node print the leaf node
            plotTree.xOff = plotTree.xOff + 1.0/plotTree.totalW
            plotNode(secondDict[key], (plotTree.xOff, plotTree.yOff), cntrPt, leafNode)
            plotMidText((plotTree.xOff, plotTree.yOff), cntrPt, str(key))
    plotTree.yOff = plotTree.yOff + 1.0/plotTree.totalD


#Canvas initialization
def createPlot(inTree):
    fig = plt.figure(1, facecolor='white')
    fig.clf()
    axprops = dict(xticks=[], yticks=[])
    createPlot.ax1 = plt.subplot(111, frameon=False, **axprops)    #no ticks
    #createPlot.ax1 = plt.subplot(111, frameon=False) #ticks for demo puropses
    plotTree.totalW = float(getNumLeafs(inTree))
    plotTree.totalD = float(getTreeDepth(inTree))
    plotTree.xOff = -0.5/plotTree.totalW; plotTree.yOff = 1.0;
    plotTree(inTree, (0.5,1.0), '')
    plt.show()
Define main function
def main():
#createPlot()
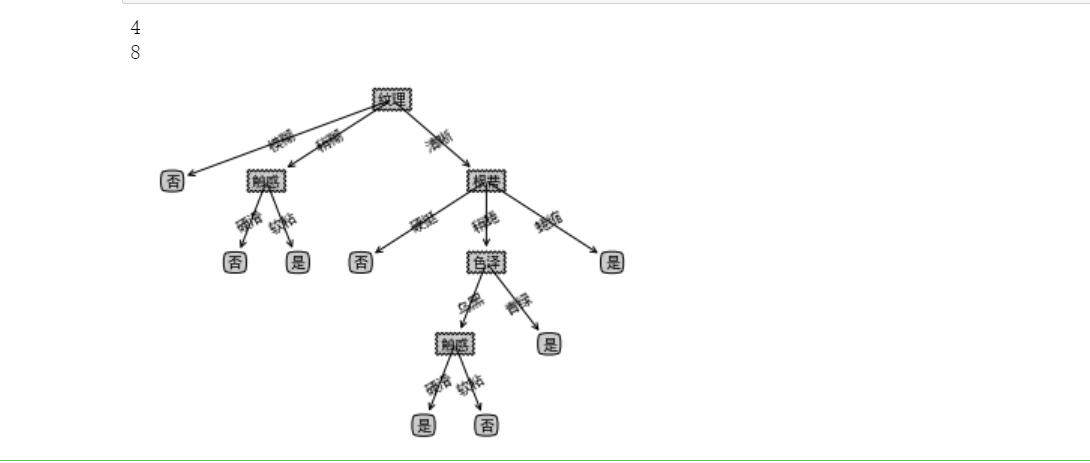
print(getTreeDepth(myTree)) #Depth of output number
print(getNumLeafs(myTree)) #Number of output leaves
createPlot(myTree)
main()
2, The algorithm codes of ID3, C4.5 and CART are implemented for watermelon data set with SK learn library.
1. Establish decision tree based on information gain criterion (ID3 id3id3 or c4.5c4.5)
Import related libraries
#Import related libraries
import pandas as pd
import graphviz
from sklearn.model_selection import train_test_split
from sklearn import tree
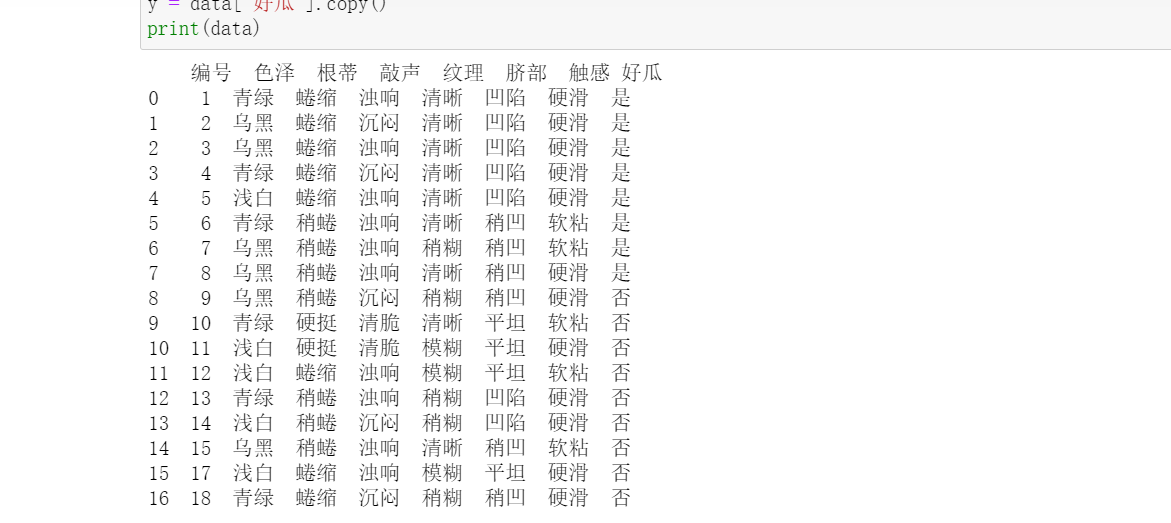
Import data
f = open('watermalon.csv','r',encoding='utf-8')
data = pd.read_csv(f)
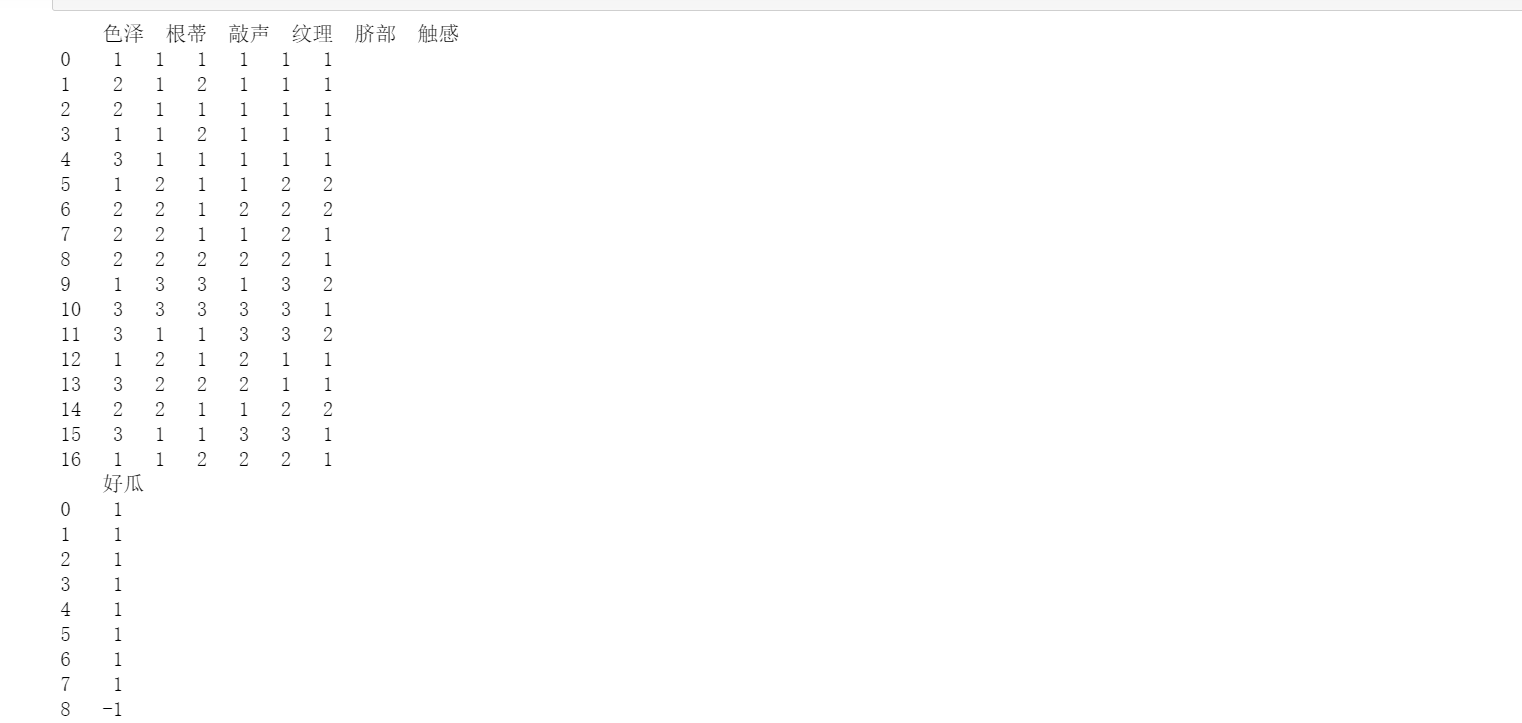
x = data[["color and lustre","Root","stroke ","texture","Umbilicus","Tactile sensation"]].copy()
y = data['Good melon'].copy()
print(data)
Data preprocessing
Numeric eigenvalues
#Numeric eigenvalues
x = x.copy()
for i in ["color and lustre","Root","stroke ","texture","Umbilicus","Tactile sensation"]:
    for j in range(len(x)):
        if(x[i][j] == "dark green" or x[i][j] == "Curl up" or data[i][j] == "Turbid sound" \
           or x[i][j] == "clear" or x[i][j] == "sunken" or x[i][j] == "Hard slip"):
            x[i][j] = 1
        elif(x[i][j] == "Black" or x[i][j] == "Slightly curled" or data[i][j] == "Dull" \
           or x[i][j] == "Slightly paste" or x[i][j] == "Slightly concave" or x[i][j] == "Soft sticky"):
            x[i][j] = 2
        else:
            x[i][j] = 3

y = y.copy()
for i in range(len(y)):
    if(y[i] == "yes"):
        y[i] = int(1)
    else:
        y[i] = int(-1)
Convert data to DataFrame data type
#You need to convert the data x and y into a good format and the data frame dataframe, otherwise the format will report an error
x = pd.DataFrame(x).astype(int)
y = pd.DataFrame(y).astype(int)
print(x)
print(y)
Dividing training set and test set
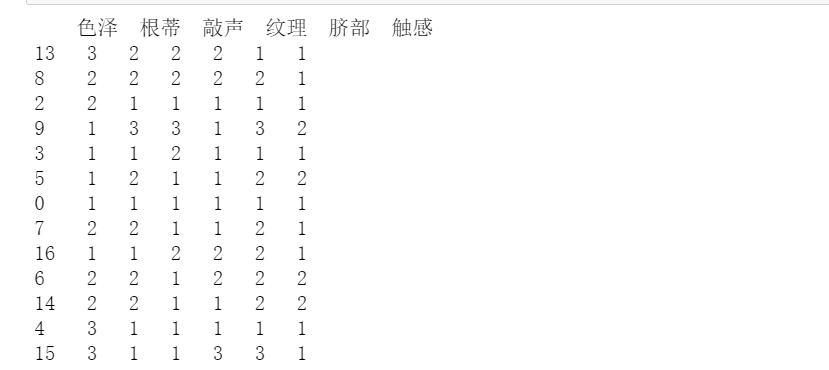
80% of the data is used for training and 20% for testing
x_train, x_test, y_train, y_test = train_test_split(x,y,test_size=0.2)
print(x_train)
Modeling and training
#Decision tree learning
clf = tree.DecisionTreeClassifier(criterion="entropy")                    #instantiation
clf = clf.fit(x_train, y_train)
score = clf.score(x_test, y_test)
print(score)
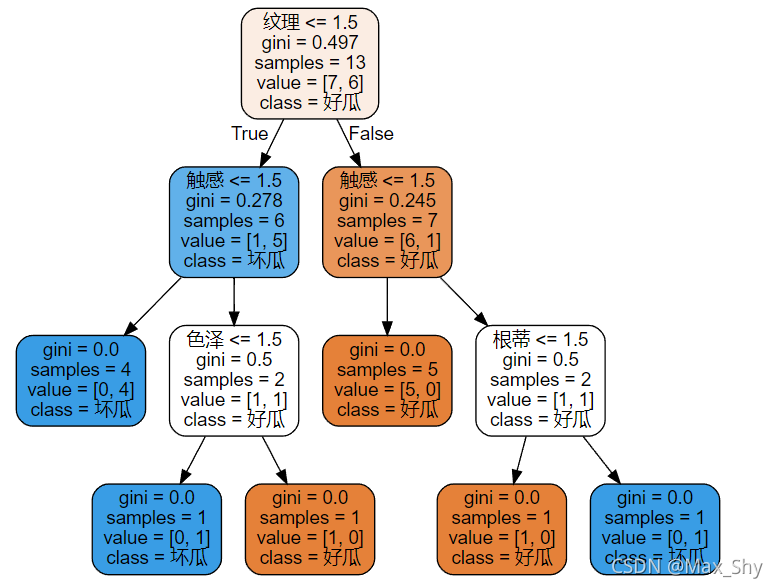
Visual decision tree
feature_name = ["color and lustre","Root","stroke ","texture","Umbilicus","Tactile sensation"]
dot_data = tree.export_graphviz(clf
                                ,feature_names= feature_name
                                ,class_names=["Good melon","Bad melon"]
                                ,filled=True
                                ,rounded=True
                                ,out_file =None
                                )
graph = graphviz.Source(dot_data)
graph
2. Establish decision tree based on Gini index (cartcart)
According to the parameter interpretation of the DecisionTreeClassifier function, the decision tree can be established based on the gini index (C A R T CARTCART) by changing the criterion value to "gini".
#Decision tree learning
clf = tree.DecisionTreeClassifier(criterion="gini")                    #instantiation
clf = clf.fit(x_train, y_train)
score = clf.score(x_test, y_test)
print(score)
Visual (C A R T CARTCART) decision tree
3, Summary
The experiment is to realize the ID3 algorithm code for watermelon dataset under jupyter, and output the visual results.
The algorithm codes of ID3, C4.5 and CART are implemented for watermelon data set with SK learn library.
4, Reference link
https://www.cnblogs.com/dennis-liucd/p/7905793.html,
https://blog.csdn.net/bjjoy2009/article/details/80884526
https://blog.csdn.net/YangMax1/article/details/120917236?spm=1001.2014.3001.5501
https://blog.csdn.net/qq_55691662/article/details/120569410