Crawl the latest epidemic data with Python
The data of this major epidemic may change all the time. This blog will explain how to crawl real-time epidemic data, analyze the data and make the effect of data visualization.
Summary of the report:
Analysis of epidemic situation in China
1.1 display the specific situation of epidemic situation in each province (including cities in each province)
1.2 find out the cities with new epidemic situation in China
1.3 show the total number of people infected by the epidemic in each province
1.4 draw the cumulative infection distribution map of epidemic situation in China
The cumulative trend of epidemic situation in China was analyzed
2.1 draw local cumulative diagnosis trend chart
2.2 map the new trend of national infection (in recent months)
Epidemic analysis of other countries in the world
3.1 draw the distribution map of the total number of infected people in various countries around the world
Check the epidemic development of various countries
Step 1: epidemic data interface acquisition
Tencent News obtained and sorted out the epidemic tracking data of COVID-19 from the websites of WHO and Hopkins University. The API interface URL is:
url1 = "https://view.inews.qq.com/g2/getOnsInfo?name=disease_h5"
url2 = "https://view.inews.qq.com/g2/getOnsInfo?name=disease_other"
url3 = "https://view.inews.qq.com/g2/getOnsInfo?name=disease_foreign"
url4 = "https://api.inews.qq.com/newsqa/v1/automation/foreign/daily/list?country = United States“
Step 2: import the necessary Libraries
import numpy as np  #Import the necessary library functions
import pandas as pd
import matplotlib
import matplotlib.pyplot as plt
from matplotlib.ticker import MaxNLocator
import requests
import json
from pyecharts.charts import Map, Geo
from PIL import Image
1. Analyze the local epidemic situation in China
Process: 1. First get the local epidemic data of China from the API interface
2. Because the 'data' data in the json file analyzed in advance is a string, it is convenient to convert 'data' into dictionary type for analysis
url1 = "https://view.inews.qq.com/g2/getOnsInfo?name=disease_h5"
resp=requests.get(url1)
listdata=[]
listdata=resp.json()
listdata1=json.loads(listdata['data']) #Convert 'data' into dictionary type for easy analysis
#Read the overall situation of the epidemic in China from the file
listtime=listdata1['lastUpdateTime']
pd_china=pd.DataFrame()
pd1=pd.DataFrame(listdata1['chinaTotal'],index=['chinaTotal'], columns=['confirm', 'heal','dead','suspect','nowConfirm','nowSevere','importedCase','noInfect'])
pd_china=pd_china.append(pd1)
pd1=pd.DataFrame(listdata1['chinaAdd'],index=['chinaAdd'], columns=['confirm', 'heal','dead','suspect','nowConfirm','nowSevere','importedCase','noInfect'])
pd_china=pd_china.append(pd1)
pd_china['lastUpdateTime']=listtime
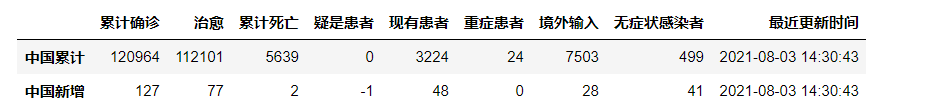
pd_china=pd_china.rename(columns={"confirm": "Cumulative diagnosis", "heal": "cure","dead":"Cumulative death","suspect":"Suspected patient","nowConfirm":"Existing patients","importedCase":"Overseas input","noInfect":"asymptomatic patient","lastUpdateTime":"Last updated","nowSevere":"patient in severe condition"})
pd_china=pd_china.rename(index={"chinaTotal":"China cumulative","chinaAdd":"New in China"})
pd_china
1.1 clean and analyze the data of domestic provinces and cities 
areaTree=listdata1['areaTree']
china_data=areaTree[0]['children'] #Obtain data from provinces and cities in China
china_data
china_list = []
for a in range(len(china_data)):
province = china_data[a]['name'] #Get all the provinces
province_list = china_data[a]['children'] #Get a list of cities in each province
for b in range(len(province_list)):
city = province_list[b]['name']
total = province_list[b]['total']
today = province_list[b]['today']
china_dict = {} #Store the information of each city in a dictionary
china_dict['province'] = province
china_dict['city'] = city
china_dict['total'] = total
china_dict['today'] = today
china_list.append(china_dict)
china_data = pd.DataFrame(china_list)
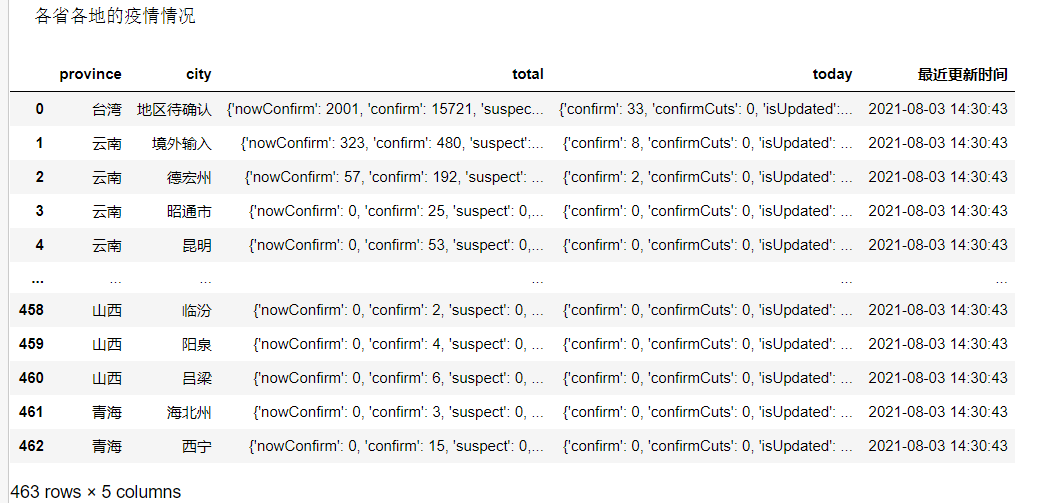
china_data['Last updated']=listtime
print('Epidemic situation in all provinces')
china_data
# Define data processing functions
def confirm(x): # Output the value corresponding to 'confirm' in 'total' or 'today' (both dictionary type data) obtained above
confirm = eval(str(x))['confirm']
return confirm
def suspect(x): # Output the value corresponding to 'prospect' in 'total' or 'today' (both dictionary type data) obtained above
suspect = eval(str(x))['suspect']
return suspect
def dead(x): # Output the value corresponding to 'dead' in 'total' or 'today' (both dictionary type data) obtained above
dead = eval(str(x))['dead']
return dead
def heal(x): # Output the value corresponding to 'heal' in 'total' or 'today' (both dictionary type data) obtained above
heal = eval(str(x))['heal']
return heal
# Function mapping
china_data['confirm'] = china_data['total'].map(confirm)
china_data['suspect'] = china_data['total'].map(suspect)
china_data['dead'] = china_data['total'].map(dead)
china_data['heal'] = china_data['total'].map(heal)
china_data['addconfirm'] = china_data['today'].map(confirm)
china_data = china_data[["province","city","confirm","suspect","dead","heal","addconfirm"]]
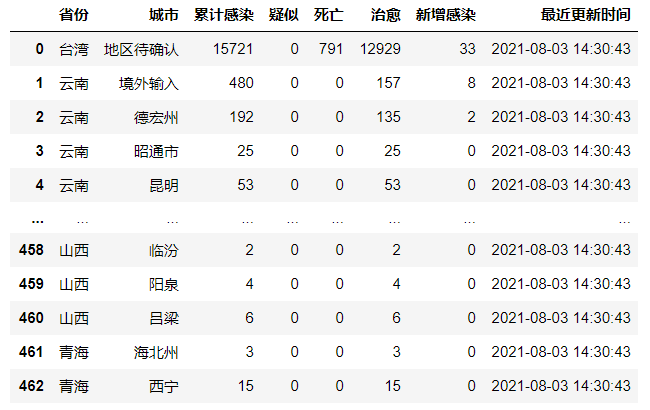
china_data=china_data.rename(columns={"province":"province","city":"city","confirm":"Cumulative infection","suspect":"Suspected","dead":"death","heal":"cure","addconfirm":"New infection"})
print('Specific epidemic situation in all provinces')
china_data['Last updated']=listtime
china_data
1.2 find out the cities with new epidemic situation in China
china_data1=china_data[china_data['New infection']>=1]
china_data1

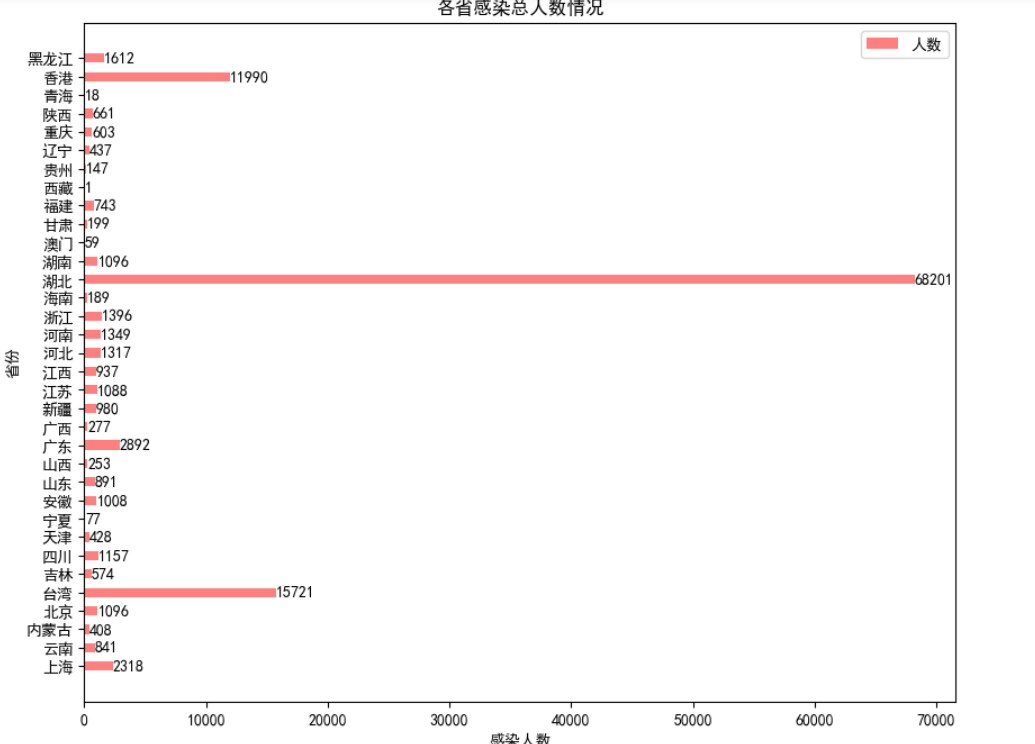
1.3 calculate the total number of infected people in each province and draw a histogram
area_data = china_data.groupby("province")["Cumulative infection"].sum().reset_index()
area_data.columns = ["province","Cumulative infection"]
print('\n Comparison of the total number of infected people in various provinces\n')
print(area_data )
matplotlib.rcParams['font.sans-serif'] = ['SimHei']  # Display Chinese in bold
# mapping
plt.figure(figsize = (10,8),dpi=100)  #Resize image and pixels
plt.bar(x=0,bottom=area_data['province'],height=0.5,width=area_data['Cumulative infection'],orientation='horizontal',label='Number of people',color='red',alpha=0.5 )

#The specific values are displayed on the histogram. The ha parameter controls the horizontal alignment and va controls the vertical alignment
for x1, yy in zip(area_data['Cumulative infection'], area_data['province']):
  plt.text(x1+1, yy , str(x1),  va='center', fontsize=10, rotation=0)
# Set title
plt.title("Total number of infected persons in each province")
# Sets the name for both axes
plt.xlabel("Number of infected persons")
plt.ylabel("province")
# Show Legend
plt.legend(loc="upper right")
plt.show()
plt.close()
1.4 draw the cumulative infection distribution map of epidemic situation in China 
privince=[]
columns=[]
x=[]   # Match the number of infected people in each province with that in each province
for i in range(len(area_data)):
    privince.append(area_data.loc[i]['province'])
    columns.append(int(area_data.loc[i]['Cumulative infection']))
for z in zip(list(privince), list(columns)):
    list(z)
    x.append(z)
from pyecharts.charts import Map
import pyecharts.options as opts
from pyecharts import options
from pyecharts.globals import ChartType
area_map = Map()
area_map.add("Distribution of epidemic infection in China",x, "china",is_map_symbol_show=False)
area_map.set_global_opts(title_opts=opts.TitleOpts(title="Distribution map of cumulative number of infections in China"),visualmap_opts=opts.VisualMapOpts(is_piecewise=True,
              pieces=[
                    {"min": 1500, "label": '>10000 people', "color": "#6F171F"},
                    {"min": 500, "max": 15000, "label": '500-1000 people', "color": "#C92C34"},
                    {"min": 100, "max": 499, "label": '100-499 people', "color": "#E35B52"},
                    {"min": 10, "max": 99, "label": '10-99 people', "color": "#F39E86"},
                    {"min": 1, "max": 9, "label": '1-9 people', "color": "#FDEBD0"}]))
area_map.render_notebook()

2 analyze the cumulative trend of epidemic situation in China
url2 = "https://view.inews.qq.com/g2/getOnsInfo?name=disease_other"
resp=requests.get(url2)
listdata=[]
listdata=resp.json()
listdata2=json.loads(listdata['data'])
chinaDayList=listdata2['chinaDayList'] #Put the epidemic data recorded in China in the original data text (dictionary form) into a sequence
i=len(chinaDayList) #Calculate the number of days from the beginning of epidemic data statistics to today
china_date=pd.DataFrame()
for n in range(i):
pd1=pd.DataFrame(data=chinaDayList[n],index=[n],columns=['confirm','dead','heal','nowConfirm','nowSevere','healRate','date'])
china_date=china_date.append(pd1)
china_date=china_date.rename(columns={"confirm":"Cumulative diagnosis","dead":"Cumulative death","heal":"Cumulative cure","nowConfirm":"Existing diagnosis","nowSevere":"Local new","healRate":"cure rate","date":"date"})
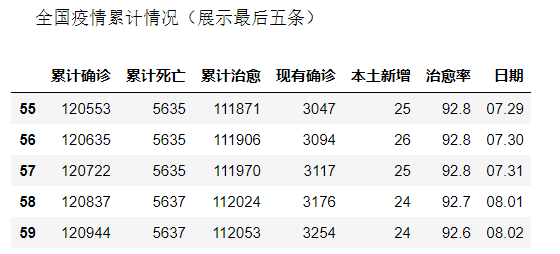
print('\n Cumulative national epidemic situation (show the last five)')
china_date.tail()
2.1 draw local cumulative diagnosis trend chart
matplotlib.rcParams['font.sans-serif'] = ['SimHei']
plt.figure(figsize=(10,4),dpi=90)    #Resizing, clarity
plt.xticks(rotation=70)      #Font tilt
x=np.array(china_date['date'])
y=np.array(china_date['Cumulative diagnosis'])
plt.xticks(range(0,i,4))
plt.plot(x,y)
plt.title('Cumulative trend of national epidemic situation')
plt.xlabel("Date")
plt.ylabel("Number of infected persons")
plt.show()

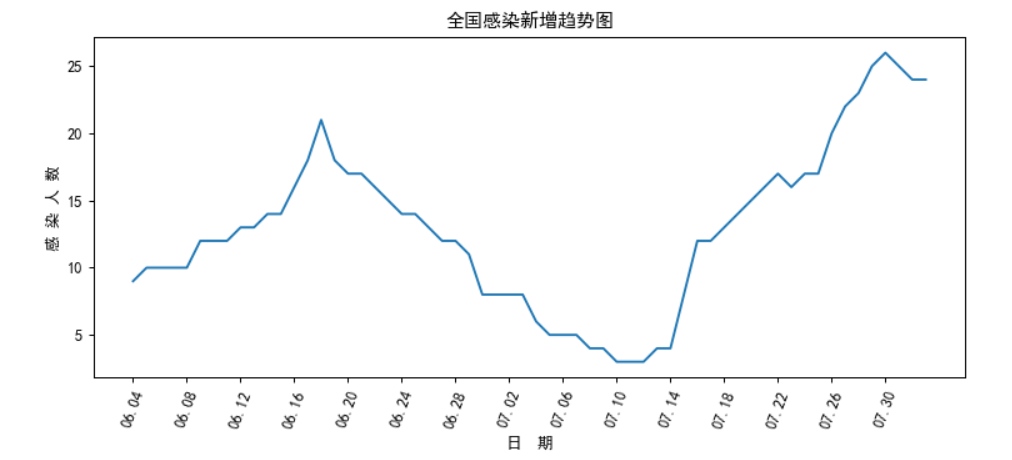
2.2 map the new trend of national infection (in recent months)
matplotlib.rcParams['font.sans-serif'] = ['SimHei']
plt.figure(figsize=(10,4),dpi=90)    #Resizing, clarity
plt.xticks(rotation=70)      #Font tilt
x=np.array(china_date['date'])
y=np.array(china_date['Local new'])
plt.xticks(range(0,i,4))
plt.plot(x,y)
plt.title('National trend of new infections')
plt.xlabel("Date")
plt.ylabel("Number of infected persons")
plt.show()
3. Analysis of epidemic situation in other countries around the world
url3 = "https://view.inews.qq.com/g2/getOnsInfo?name=disease_foreign"
resp=requests.get(url3)
listdata=[]
listdata=resp.json()
listdata3=json.loads(listdata['data'])
areaTree=listdata3['foreignList']  #Obtain total data for each country
country_list=pd.DataFrame()
for a in range(len(areaTree)):
    pd1=pd.DataFrame(areaTree[a],index=[a],columns=['name','continent','y','date','confirmAdd','confirm','dead','heal','nowConfirm'])
    country_list=country_list.append(pd1)
country_list=country_list.rename(columns={"name":"name","continent":"Continent","y":"year","date":"date","confirmAdd":"newly added","confirm":"Infected","dead":"death","heal":"cure","nowConfirm":"Number of existing infections"})
print('\n Show the first 10 records')
country_list.head(10)
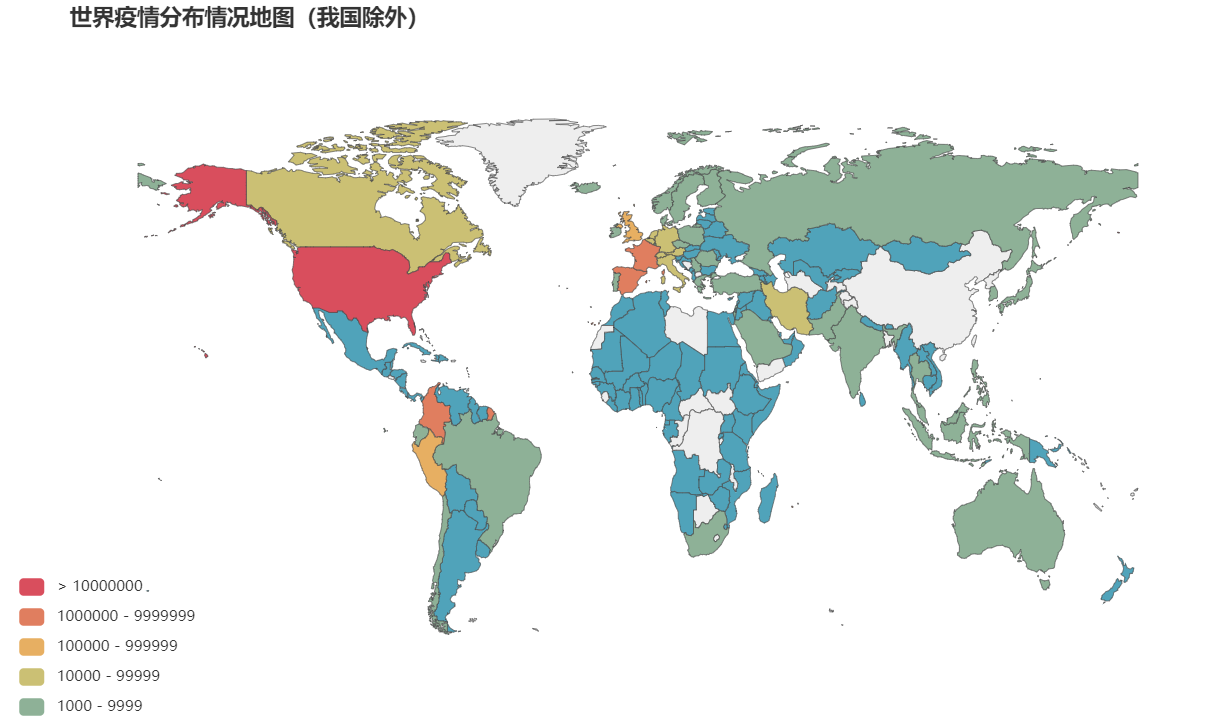
3.1 draw the distribution map of the total number of infected people in various countries around the world
# Create an empty list to hold relevant data for each country
info_list = []
name2=[]
confirm2=[]
# Traversal polling information for each country
for a in range(len(areaTree)):    # Extract country name
    name = areaTree[a]['name']
    name2.append(name)  #  Extract the number of confirmed cases in each country
    confirm = int(areaTree[a]["confirm"])
    confirm2.append(confirm)   #Put each country and the number of confirmed cases in a tuple and add them to the list
    info_tuple = (name,confirm)
    info_list.append(info_tuple)
#  Match the Chinese name of each country with the English name
nameMap = {
        'Singapore Rep.':'Singapore',
        'Dominican Rep.':'Dominican',
        'Palestine':'Palestine',
        'Bahamas':'Bahamas',
        'Timor-Leste':'Timor-Leste',
        'Afghanistan':'Afghanistan',
        'Guinea-Bissau':'Guinea-Bissau',
        "Côte d'Ivoire":'Cote d'Ivoire',
        'Siachen Glacier':'Siachin glacier',
        "Br. Indian Ocean Ter.":'British Indian Ocean Territory',
        'Angola':'Angola',
        'Albania':'Albania',
        'United Arab Emirates':'The United Arab Emirates',
        'Argentina':'Argentina',
        'Armenia':'Armenia',
        'French Southern and Antarctic Lands':'French Southern Hemisphere and Antarctic Territory',
        'Australia':'Australia',
        'Austria':'Austria',
        'Azerbaijan':'Azerbaijan',
        'Burundi':'burundi',
        'Belgium':'Belgium',
        'Benin':'Benin',
        'Burkina Faso':'burkina faso ',
        'Bangladesh':'The People's Republic of Bangladesh',
        'Bulgaria':'Bulgaria',
        'The Bahamas':'Bahamas',
        'Bosnia and Herz.':'Bosnia and Herzegovina',
        'Belarus':'Belarus',
        'Belize':'Belize ',
        'Bermuda':'Bermuda',
        'Bolivia':'bolivia',
        'Brazil':'Brazil',
        'Brunei':'Brunei',
        'Bhutan':'Bhutan',
        'Botswana':'botswana',
        'Central African Rep.':'Central African',
        'Canada':'Canada',
        'Switzerland':'Switzerland',
        'Chile':'Chile',
        'China':'China',
        'Ivory Coast':'Ivory Coast',
        'Cameroon':'Cameroon',
        'Dem. Rep. Congo':'Democratic Republic of the Congo',
        'Congo':'Congo',
        'Colombia':'Columbia',
        'Costa Rica':'Costa Rica',
        'Cuba':'Cuba',
        'N. Cyprus':'northern cyprus ',
        'Cyprus':'Cyprus',
        'Czech Rep.':'Czech Republic',
        'Germany':'Germany',
        'Djibouti':'Djibouti',
        'Denmark':'Denmark',
        'Algeria':'Algeria',
        'Ecuador':'Ecuador',
        'Egypt':'Egypt',
        'Eritrea':'Eritrea',
        'Spain':'Spain',
        'Estonia':'Estonia',
        'Ethiopia':'Ethiopia',
        'Finland':'Finland',
        'Fiji':'Fei',
        'Falkland Islands':'Falkland Islands',
        'France':'France',
        'Gabon':'Gabon',
        'United Kingdom':'britain',
        'Georgia':'Georgia',
        'Ghana':'Ghana',
        'Guinea':'Guinea',
        'Gambia':'Gambia',
        'Guinea Bissau':'Guinea-Bissau',
        'Eq. Guinea':'Equatorial Guinea',
        'Greece':'Greece',
        'Greenland':'Greenland',
        'Guatemala':'Guatemala',
        'French Guiana':'French Guiana',
        'Guyana':'Guyana',
        'Honduras':'Honduras',
        'Croatia':'Croatia',
        'Haiti':'Haiti',
        'Hungary':'Hungary',
        'Indonesia':'Indonesia',
        'India':'India',
        'Ireland':'Ireland',
        'Iran':'Iran',
        'Iraq':'Iraq',
        'Iceland':'Iceland',
        'Israel':'Israel',
        'Italy':'Italy',
        'Jamaica':'Jamaica',
        'Jordan':'Jordan',
        'Japan':'Japan',
        'Japan':'Native Japan',
        'Kazakhstan':'Kazakhstan',
        'Kenya':'Kenya',
        'Kyrgyzstan':'Kyrgyzstan',
        'Cambodia':'Cambodia',
        'Korea':'the republic of korea',
        'Kosovo':'Kosovo ',
        'Kuwait':'Kuwait',
        'Lao PDR':'Laos',
        'Lebanon':'Lebanon',
        'Liberia':'Liberia',
        'Libya':'Libya',
        'Sri Lanka':'Sri Lanka',
        'Lesotho':'Lesotho',
        'Lithuania':'Lithuania',
        'Luxembourg':'Luxembourg',
        'Latvia':'Latvia',
        'Morocco':'Morocco',
        'Moldova':'Moldova',
        'Madagascar':'Madagascar',
        'Mexico':'Mexico',
        'Macedonia':'Macedonia',
        'Mali':'Mali',
        'Myanmar':'Myanmar',
        'Montenegro':'Montenegro ',
        'Mongolia':'Mongolia',
        'Mozambique':'Mozambique',
        'Mauritania':'Mauritania',
        'Malawi':'Malawi',
        'Malaysia':'Malaysia',
        'Namibia':'Namibia',
        'New Caledonia':'New Caledonia ',
        'Niger':'Niger',
        'Nigeria':'Nigeria',
        'Nicaragua':'Nicaragua',
        'Netherlands':'Netherlands',
        'Norway':'Norway',
        'Nepal':'Nepal',
        'New Zealand':'New Zealand',
        'Oman':'Oman',
        'Pakistan':'Pakistan',
        'Panama':'Panama',
        'Peru':'Peru',
        'Philippines':'the Philippines',
        'Papua New Guinea':'papua new guinea',
        'Poland':'poland',
        'Puerto Rico':'Puerto Rico',
        'Dem. Rep. Korea':'Korea',
        'Portugal':'Portugal',
        'Paraguay':'Paraguay',
        'Qatar':'Qatar',
        'Romania':'Romania',
        'Russia':'Russia',
        'Rwanda':'Rwanda',
        'W. Sahara':'Western Sahara',
        'Saudi Arabia':'Saudi Arabia',
        'Sudan':'Sudan',
        'S. Sudan':'South Sudan',
        'Senegal':'Senegal',
        'Solomon Is.':'Solomon Islands',
        'Sierra Leone':'sierra leone',
        'El Salvador':'El Salvador',
        'Somaliland':'Somaliland',
        'Somalia':'Somalia',
        'Serbia':'Serbia',
        'Suriname':'Suriname',
        'Slovakia':'Slovakia',
        'Slovenia':'Slovenia',
        'Sweden':'Sweden',
        'Swaziland':'Eswatini',
        'Syria':'Syria',
        'Chad':'Chad',
        'Togo':'Togo',
        'Thailand':'Thailand',
        'Tajikistan':'Tajikistan',
        'Turkmenistan':'Turkmenistan',
        'East Timor':'Timor-Leste',
        'Trinidad and Tobago':'Trinidad and Tobago ',
        'Tunisia':'Tunisia',
        'Turkey':'turkey',
        'Tanzania':'Tanzania',
        'Uganda':'Uganda',
        'Ukraine':'Ukraine',
        'Uruguay':'Uruguay',
        'United States':'U.S.A',
        'Uzbekistan':'Uzbekistan',
        'Venezuela':'Venezuela',
        'Vietnam':'Vietnam',
        'Vanuatu':'Vanuatu',
        'West Bank':'west bank',
        'Yemen':'Yemen',
        'South Africa':'South Africa',
        'Zambia':'Zambia',
        'Zimbabwe':'zimbabwe'
}
during = [               # Define the level of the number of people infected
    {"min":10000000},
    {"min": 1000000, "max":9999999},
    {"min": 100000, "max": 999999},
    {"min": 10000, "max": 99999},
    {"min": 1000, "max": 9999},
    {"min":0,"max":999},
]
map = Map(opts.InitOpts(width='1000px',height='600px')).add(series_name="",
                # Data items to display
                data_pair=info_list,
                # The map type is world map
                maptype="world",
                # Custom read name mapping
                name_map=nameMap,
                # Display tag graphics
                is_map_symbol_show=False)
# label_opts: tag configuration item settings, is_show: whether to display the visual mapping configuration
map.set_series_opts(label_opts=opts.LabelOpts(is_show=False))
#is_ Piece wise: whether it is displayed in segments. pieces: set the range of each interval
#max_:  Set the maximum value in all value ranges of visual mappiecewise. TitleOpts: Title Setting
map.set_global_opts(
        title_opts=opts.TitleOpts(pos_left="40px",title="World epidemic distribution map (excluding China)",subtitle_textstyle_opts=opts.TextStyleOpts(font_size=20)),
        legend_opts=opts.LegendOpts(selected_mode='multiple'),
        visualmap_opts=opts.VisualMapOpts(max_=10000000,is_piecewise=True,pieces=during),
        )
map.render_notebook()
4. Check the epidemic development of various countries
name=input('Countries to view: ')
#First find the API interface required by the country you want to view
url='https://api.inews.qq.com/newsqa/v1/automation/foreign/daily/list?country='
url4 = url+str(name)
resp=requests.get(url4)
listdata=[]
listdata=resp.json()
listForeign=pd.DataFrame(listdata['data'])
listForeign=listForeign.rename(columns={"y":"year","date":"date","confirm_add":"New infections","confirm":"Total number of infected persons","heal":"cure","dead":"Total deaths"})

  #Convert date data of type "00.00" to data of type "00-00"
i=len(listForeign)
list=[]
for n in range(i):
  list.append(listForeign['date'][n].replace('.','-'))
del listForeign['date']
listForeign['date']=list
  # Merge year and time
listForeign['time']=listForeign['year'].astype(str)+'-'+listForeign['date'].astype(str)
del listForeign['date']
del listForeign['year']
listForeign=listForeign[listForeign['New infections']>0]
listForeign

matplotlib.rcParams['font.sans-serif'] = ['SimHei']
plt.figure(figsize=(12,4),dpi=90)    #Resizing, clarity
plt.xticks(rotation=70)      #Font tilt
i=len(listForeign)
x=np.array(listForeign['time'])
y=np.array(listForeign['New infections'])
plt.xticks(range(0,i,20))
plt.plot(x,y,color='red',label='New infections')
plt.title(name+'New trend chart of infection')
plt.xlabel("Date")
plt.ylabel("New infections")
plt.show()
