The background is UI automation in a new project recently. I want to investigate how to interact with the browser API to obtain some additional information to help debug when the case fails. Later, it slowly extended to front-end performance test, weak network test and other scenarios. So record the results of the survey here. Mainly to solve the following problems:
- When testing, you will always encounter some occasional bug s. It is difficult to operate on the page after finding that the automatic case fails. Therefore, if you can get the request and response of all requests in the page when it fails, it is helpful to troubleshoot the problem. It is equivalent to calling the network function of chrome devtools.
- When testing, you can always encounter the case failure caused by the slow loading of page elements. Therefore, if you can get every resource on the page, including js, pictures, css and other files, as well as the time data of network requests, it can also help you troubleshoot problems.
- Introduce the requirement of front-end performance test in UI automation test, and calculate some key indicators of the page, such as TTFB.
Get performance information
The method of obtaining performance information depends on the browser API, but fortunately, this API has become a standard. When we open the browser console, we can write js code to call this API. There are two APIs, performance Timing and performance getEntriesByType. Let's talk about the first interface first. When we enter js code on the console, the following information will appear:

performance. The timing interface is used to obtain various performance data of the current page. The meaning of each field is as follows:
navigationStart: The start time when the browser processes the current web page

fetchStart: Browser initiated http The millisecond timestamp of the request to read the document.

domainLookupStart: Timestamp at the beginning of the domain name query.

domainLookupEnd: Timestamp at the end of the domain name query.

connectStart: http The timestamp at which the request began to be sent to the server.

connectEnd: The millisecond timestamp of the connection between the browser and the server (handshake and end of authentication process).

requestStart: The browser sends a message to the server http Timestamp at the time of the request. Or start reading the local cache.

responseStart: The timestamp when the browser receives the first byte from the server (or reads from the local cache).

responseEnd: The millisecond timestamp when the browser receives the last byte from the server.

domLoading: The browser starts parsing the web page DOM Structure time.

domInteractive: Webpage dom The time when the embedded resources are loaded after the tree is created.

domContentLoadedEventStart: Webpage DOMContentLoaded Timestamp when the event occurred.

domContentLoadedEventEnd: The time when all scripts to be executed on the web page are completed, domReady Time of day.

domComplete: Webpage dom Timestamp when the structure is generated.

loadEventStart: Current web page load The timestamp at which the callback function of the event started executing.

loadEventEnd: Current web page load Timestamp when the callback function of the event ends running.
According to the information given above, we can calculate the performance indicators related to the current page. For example, if you want to calculate TTFB (the time from the start time of the browser processing the current web page to the first byte received from the server), it is responseStart - navigationStart. Let's start with my current statistical indicators:
navigation_start = browser.driver.execute_script("return window.performance.timing.navigationStart")
response_start = browser.driver.execute_script("return window.performance.timing.responseStart")
dom_complete = browser.driver.execute_script("return window.performance.timing.loadEventEnd")

# Start calculating page performance
backend_performance_calc = response_start - navigation_start  # TTFB (time when the front end receives the first byte from the server, also known as white screen time)
frontend_performance_calc = dom_complete - response_start  # Front end loading page time
dns_duration = browser.driver.execute_script(
    "return (window.performance.timing.domainLookupEnd - window.performance.timing.domainLookupStart)")  # DNS query time
tcp_duration = browser.driver.execute_script(
    "return (window.performance.timing.connectEnd - window.performance.timing.connectStart)")  # TCP connection time

logger.info('Current page: {url}'.format(url=browser.driver.current_url))
logger.info("TTFB(The time when the front end receives the first byte from the server): %s millisecond" % backend_performance_calc)
logger.info("Front end loading time(First byte received from service to domComplete Time): %s millisecond" % frontend_performance_calc)
logger.info("DNS Query time: %s millisecond" % dns_duration)
logger.info("tcp Connection time: %s millisecond" % tcp_duration)
Of course, this calculation method is flawed. Because the current front-end projects are event loop, and resources are loaded asynchronously. The browser will now open six TCP links for the same domain name for concurrent processing. Therefore, the above method of calculating TTFB is only the time when the page starts rendering. However, for no JS, CSS, images and web requests, we still need to calculate their performance separately. So we need to use the second API performance Getentriesbytype or performance getEntries. As shown below:
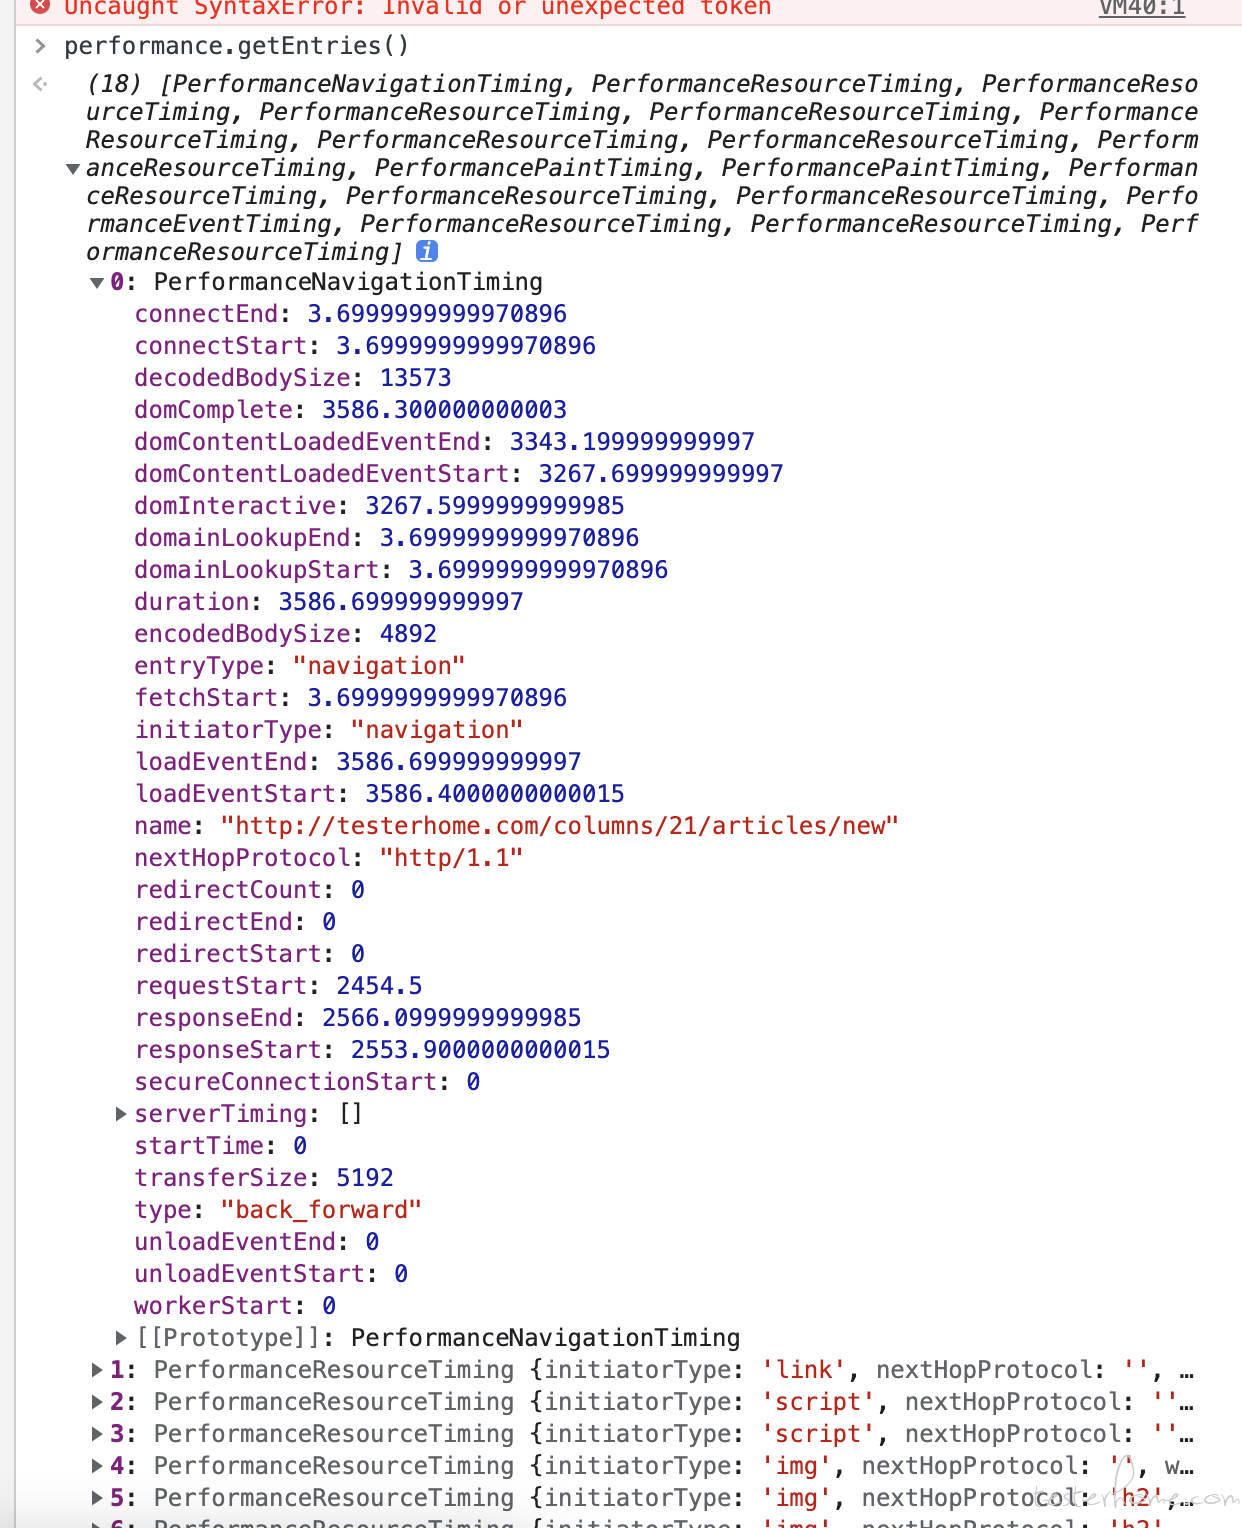
This API will capture the performance information of each request that the browser interacts with the service. Therefore, the code is written as follows:
responses = browser.driver.execute_script("return performance.getEntriesByType('resource')")
for r in responses:
    logger.info(
        "Resource name:{name}, time consuming:{duration}millisecond, Transmission size bytes:{transferSize}, encodedBodySize:{encodedBodySize}".format(
            name=r['name'], duration=str(r['duration']),
            transferSize=str(r['transferSize']),
            encodedBodySize=str(r['encodedBodySize'])))
I have temporarily obtained the duration (time-consuming of the request), encodedbodysize (compressed size of the request body, PS: all I encounter are GZIP compression), transferSize (transmission compression, which is used for block transmission of HTTP 1.1), or I can calculate the TTFB of the current request through responseStart - connectionStart
Grab request information
The above is the captured performance information. If I want to know the requst and response information of a request, I need two things. One is to obtain the performance log through webdriver, take out the basic information, and then obtain the request id in the performance log, and go to devtools of chrome browser to obtain the corresponding response.
Let's get the performance log first. First, you need to start the performance log when initializing chrome:
option = selenium.webdriver.ChromeOptions()
caps = option.to_capabilities()
caps['goog:loggingPrefs'] = {'performance': 'ALL'}
Then call when you need to get the log:
 request_info = {}
browser_log = browser.driver.get_log('performance')
events = [json.loads(entry['message'])['message'] for entry in browser_log]
events = [event for event in events if 'Network.responseReceived' in event['method']]
Above, we call the performance log to get the information related to the request of the current page. Later, we filtered it and only got the network A log of type responsereceived. Why? We can understand that the browser log is recorded according to events. The most common event we use is network Responsereceived and network requestWillBeSent. Let's take a look at what is recorded in these two types of events:
The first is network requestWillBeSent.
{
"message": {
"method": "Network.requestWillBeSent",
"params": {
"documentURL": "about:blank",
"frameId": "C80F96297F4216E35079CFD86251AB8B",
"initiator": {
"lineNumber": 0,
"type": "parser",
"url": "https://www.suning.com/"
},
"loaderId": "58DDB2CF16600EAE484A541DF9440089",
"redirectResponse": {
"connectionId": 639,
"connectionReused": false,
"encodedDataLength": 497,
"fromDiskCache": false,
"fromServiceWorker": false,
"headers": {
"Cache-Control": "no-cache",
"Connection": "keep-alive",
"Content-Length": "0",
"Date": "Mon, 30 Apr 2018 07:06:42 GMT",
"Expires": "Thu, 01 Jan 1970 00:00:00 GMT",
"Location": "https://cm.g.doubleclick.net/pixel?google_nid=ipy&google_cm",
"P3P": "CP=\"NON DSP COR CURa ADMa DEVa TAIa PSAa PSDa IVAa IVDa CONa HISa TELa OTPa OUR UNRa IND UNI COM NAV INT DEM CNT PRE LOC\"",
"Pragma": "no-cache",
"Server": "nginx/1.10.2",
"Set-Cookie": "CMBMP=IWl; Domain=.ipinyou.com; Expires=Thu, 10-May-2018 07:06:42 GMT; Path=/" },
"headersText": "HTTP/1.1 302 Found\r\nServer: nginx/1.10.2\r\nDate: Mon, 30 Apr 2018 07:06:42 GMT\r\nContent-Length: 0\r\nConnection: keep-alive\r\nCache-Control: no-cache\r\nPragma: no-cache\r\nExpires: Thu, 01 Jan 1970 00:00:00 GMT\r\nP3P: CP=\"NON DSP COR CURa ADMa DEVa TAIa PSAa PSDa IVAa IVDa CONa HISa TELa OTPa OUR UNRa IND UNI COM NAV INT DEM CNT PRE LOC\"\r\nSet-Cookie: CMBMP=IWl; Domain=.ipinyou.com; Expires=Thu, 10-May-2018 07:06:42 GMT; Path=/\r\nLocation: https://cm.g.doubleclick.net/pixel?google_nid=ipy&google_cm\r\n\r\n",
"mimeType": "",
"protocol": "http/1.1",
"remoteIPAddress": "127.0.0.1",
"remotePort": 1086,
"requestHeaders": {
"Accept": "image/webp,image/apng,image/*,*/*;q=0.8",
"Accept-Encoding": "gzip, deflate, br",
"Accept-Language": "zh-CN,zh;q=0.9",
"Connection": "keep-alive",
"Cookie": "sessionId=I4UF6b1WcgGMC; PYID=I4UF6b1Wcg99; CMTMS=p7Ik3Ve; CMSTMS=p7Ik3Ve; CMPUB=ADV-DefaultAdv; CMBMP=IW2",
"Host": "cm.ipinyou.com",
"User-Agent": "Mozilla/5.0 (Macintosh; Intel Mac OS X 10_13_3) AppleWebKit/537.36 (KHTML, like Gecko) Chrome/65.0.3325.181 Safari/537.36" },
"requestHeadersText": "GET /baidu/cms.gif?baidu_error=1×tamp=1525072001 HTTP/1.1\r\nHost: cm.ipinyou.com\r\nConnection: keep-alive\r\nUser-Agent: Mozilla/5.0 (Macintosh; Intel Mac OS X 10_13_3) AppleWebKit/537.36 (KHTML, like Gecko) Chrome/65.0.3325.181 Safari/537.36\r\nAccept: image/webp,image/apng,image/*,*/*;q=0.8\r\nAccept-Encoding: gzip, deflate, br\r\nAccept-Language: zh-CN,zh;q=0.9\r\nCookie: sessionId=I4UF6b1WcgGMC; PYID=I4UF6b1Wcg99; CMTMS=p7Ik3Ve; CMSTMS=p7Ik3Ve; CMPUB=ADV-DefaultAdv; CMBMP=IW2\r\n",
"securityDetails": {
"certificateId": 0,
"cipher": "AES_256_GCM",
"issuer": "RapidSSL SHA256 CA",
"keyExchange": "ECDHE_RSA",
"keyExchangeGroup": "P-256",
"protocol": "TLS 1.2",
"sanList": ["*.ipinyou.com", "ipinyou.com"],
"signedCertificateTimestampList": [{ "hashAlgorithm": "SHA-256", "logDescription": "Symantec log", "logId": "DDEB1D2B7A0D4FA6208B81AD8168707E2E8E9D01D55C888D3D11C4CDB6ECBECC", "origin": "Embedded in certificate", "signatureAlgorithm": "ECDSA", "signatureData": "3045022024364934CBC90A8529E327E6EF853E3EF5E48B7F1598414E0F10059DC92685FC022100A74F93A8CF23D6572D7597C072368D69EC43AFB6A9EDAA4B01B43921AADEFDC2", "status": "Verified", "timestamp": 1511173770857.0 }, { "hashAlgorithm": "SHA-256", "logDescription": "Google 'Pilot' log", "logId": "A4B90990B418581487BB13A2CC67700A3C359804F91BDFB8E377CD0EC80DDC10", "origin": "Embedded in certificate", "signatureAlgorithm": "ECDSA", "signatureData": "3046022100F319D0F56F27C82228E2B01934A1C7F46915A1509F094EE91508F08C3B5AE2B2022100B0D94DD6FD00CB435EC33B916B52EC76FE5FFCC5D5BD8CB559248243AEDFE3CE", "status": "Verified", "timestamp": 1511173770923.0 }],
"subjectName": "*.ipinyou.com",
"validFrom": 1511136000,
"validTo": 1547942399 },
"securityState": "secure",
"status": 302,
"statusText": "Found",
"timing": {
"connectEnd": 772.852999994939,
"connectStart": 0.566999995498918,
"dnsEnd": -1,
"dnsStart": -1,
"proxyEnd": -1,
"proxyStart": -1,
"pushEnd": 0,
"pushStart": 0,
"receiveHeadersEnd": 1226.29800000141,
"requestTime": 42129.997749,
"sendEnd": 773.012999998173,
"sendStart": 772.960999995121,
"sslEnd": 772.844999999506,
"sslStart": 1.62599999748636,
"workerReady": -1,
"workerStart": -1 },
"url": "https://cm.ipinyou.com/baidu/cms.gif?baidu_error=1×tamp=1525072001"
},
"request": {
"headers": {
"User-Agent": "Mozilla/5.0 (Macintosh; Intel Mac OS X 10_13_3) AppleWebKit/537.36 (KHTML, like Gecko) Chrome/65.0.3325.181 Safari/537.36" },
"initialPriority": "Low",
"method": "GET",
"mixedContentType": "none",
"referrerPolicy": "no-referrer-when-downgrade",
"url": "https://cm.g.doubleclick.net/pixel?google_nid=ipy&google_cm"
},
"requestId": "20524.247",
"timestamp": 42131.225431,
"type": "Image",
"wallTime": 1525072000.35906
}
},
"webview": "28DAFE9FE90E9292F1B8EDB3315608EC"
}
Then look at the network responseReceived
{
    "message": {
        "method": "Network.responseReceived",
        "params": {
            "frameId": "28DAFE9FE90E9292F1B8EDB3315608EC",
            "loaderId": "44DBCD0BEBFCEE5AED6388366BCB719B",
            "requestId": "20524.277",
            "response": {
                "connectionId": 468,
                "connectionReused": true,
                "encodedDataLength": 439,
                "fromDiskCache": false,
                "fromServiceWorker": false,
                "headers": {
                    "Cache-Control": "no-cache, max-age=0, must-revalidate",
                    "Connection": "keep-alive",
                    "Content-Length": "43",
                    "Content-Type": "image/gif",
                    "Date": "Mon, 30 Apr 2018 07:06:42 GMT",
                    "Expires": "Fri, 01 Jan 1980 00:00:00 GMT",
                    "Last-Modified": "Mon, 28 Sep 1970 06:00:00 GMT",
                    "Pragma": "no-cache",
                    "Server": "nginx/1.6.3",
                    "X-Dscp-Value": "0",
                    "X-Via": "1.1 dxun38:1 (Cdn Cache Server V2.0), 1.1 shb115:4 (Cdn Cache Server V2.0), 1.1 ls10:0 (Cdn Cache Server V2.0)" },
                "headersText": "HTTP/1.1 200 OK\r\nDate: Mon, 30 Apr 2018 07:06:42 GMT\r\nServer: nginx/1.6.3\r\nContent-Type: image/gif\r\nContent-Length: 43\r\nLast-Modified: Mon, 28 Sep 1970 06:00:00 GMT\r\nExpires: Fri, 01 Jan 1980 00:00:00 GMT\r\nPragma: no-cache\r\nCache-Control: no-cache, max-age=0, must-revalidate\r\nX-Dscp-Value: 0\r\nX-Via: 1.1 dxun38:1 (Cdn Cache Server V2.0), 1.1 shb115:4 (Cdn Cache Server V2.0), 1.1 ls10:0 (Cdn Cache Server V2.0)\r\nConnection: keep-alive\r\n\r\n",
                "mimeType": "image/gif",
                "protocol": "http/1.1",
                "remoteIPAddress": "127.0.0.1",
                "remotePort": 1086,
                "requestHeaders": {
                    "Accept": "image/webp,image/apng,image/*,*/*;q=0.8",
                    "Accept-Encoding": "gzip, deflate, br",
                    "Accept-Language": "zh-CN,zh;q=0.9",
                    "Connection": "keep-alive",
                    "Cookie": "_snstyxuid=ADFD3F4299718846; _snvd=152507199416958111",
                    "Host": "sa.suning.cn",
                    "Referer": "https://www.suning.com/",
                    "User-Agent": "Mozilla/5.0 (Macintosh; Intel Mac OS X 10_13_3) AppleWebKit/537.36 (KHTML, like Gecko) Chrome/65.0.3325.181 Safari/537.36" },
                "requestHeadersText": "GET /ajaxSiteExpro.gif?oId=152507199969277498&pvId=152507199147454663&expoInfo=index3_homepage1_32618013033_word03,index3_homepage1_32618013033_word04,index3_homepage1_newUser_tankuang&expoType=1&pageUrl=https://www.suning.com/&visitorId=&loginUserName=&memberID=-&sessionId=&pageType=web&hidUrlPattern=&iId=log_1525071999692 HTTP/1.1\r\nHost: sa.suning.cn\r\nConnection: keep-alive\r\nUser-Agent: Mozilla/5.0 (Macintosh; Intel Mac OS X 10_13_3) AppleWebKit/537.36 (KHTML, like Gecko) Chrome/65.0.3325.181 Safari/537.36\r\nAccept: image/webp,image/apng,image/*,*/*;q=0.8\r\nReferer: https://www.suning.com/\r\nAccept-Encoding: gzip, deflate, br\r\nAccept-Language: zh-CN,zh;q=0.9\r\nCookie: _snstyxuid=ADFD3F4299718846; _snvd=152507199416958111\r\n",
                "securityDetails": {
                    "certificateId": 0,
                    "cipher": "AES_256_GCM",
                    "issuer": "WoSign OV SSL CA",
                    "keyExchange": "ECDHE_RSA",
                    "keyExchangeGroup": "P-256",
                    "protocol": "TLS 1.2",
                    "sanList": ["*.suning.cn", "suning.cn"],
                    "signedCertificateTimestampList": [],
                    "subjectName": "*.suning.cn",
                    "validFrom": 1479721356,
                    "validTo": 1574329356 },
                "securityState": "secure",
                "status": 200,
                "statusText": "OK",
                "timing": {
                    "connectEnd": -1,
                    "connectStart": -1,
                    "dnsEnd": -1,
                    "dnsStart": -1,
                    "proxyEnd": -1,
                    "proxyStart": -1,
                    "pushEnd": 0,
                    "pushStart": 0,
                    "receiveHeadersEnd": 656.157999997959,
                    "requestTime": 42130.56839,
                    "sendEnd": 1.03800000215415,
                    "sendStart": 0.979999997070991,
                    "sslEnd": -1,
                    "sslStart": -1,
                    "workerReady": -1,
                    "workerStart": -1 },
                "url": "https://sa.suning.cn/ajaxSiteExpro.gif?oId=152507199969277498&pvId=152507199147454663&expoInfo=index3_homepage1_32618013033_word03,index3_homepage1_32618013033_word04,index3_homepage1_newUser_tankuang&expoType=1&pageUrl=https://www.suning.com/&visitorId=&loginUserName=&memberID=-&sessionId=&pageType=web&hidUrlPattern=&iId=log_1525071999692"
            },
            "timestamp": 42131.22618,
            "type": "Image"
        }
    },
    "webview": "28DAFE9FE90E9292F1B8EDB3315608EC"
}
performance log is the browser's original record of network events. We can find a lot of useful information in it. So far, if there is a demand for front-end performance related testing, you can scan with the above methods. In addition to calculating TTFB and such indicators. You can also get whether the request has been compressed, whether the compression of too small data has been cancelled, whether the HTTP negotiation cache has been added to the header for js, css, pictures and other resources, and whether the keep alive long connection has been enabled. Of course, I haven't scanned anything except TTFB, data transmission size and time, because these settings can be configured directly in nignx. There is little possibility of problems in theory. So I've been hesitant to add it.
There is a defect in the above method, that is, there is no way to get the response body. Sometimes UI automation fails due to the failure of an interface call. Therefore, I prefer to record the input and return values of all requests currently accessed in the test report. At this time, you need to use the ability provided by selenium 4 to call devtools of Chrome browser. We have all used devtools in chrome. You can see the details of all requests under the network tab. So we need to call the API to get the information under the network tab in the browser. As follows:
request_log = browser.driver.get_log('performance')

for i in range(len(request_log)):
    message = json.loads(request_log[i]['message'])
    message = message['message']['params']
    request = message.get('request')
    if request is None:
        continue
    url = request.get('url')
    if url == "http://106.55.161.179/gateway?action=GetVerifyImageAPI":
        print(message['requestId'])
        content = browser.driver.execute_cdp_cmd('Network.getResponseBody', {'requestId': message['requestId']})
execute_cdp_cmd is a method to send a command to the browser. Including network Getresponsebody is the body to get the response of a request The required parameter is requestid. This requires us to traverse all reqeust requests in the performance log, and then get the reqeustid. This will match the reqeust and response of all requests. PS: selenium calls devtools, which can only be used on the local browser of selenium 4.
ending
That's about it. It's the first time I've been involved in front-end performance related things. Do you have a big man in the community to talk about front-end performance testing.