Virtual machine stack is the data, instruction and return address required by threads to run java methods. In fact, in our actual code, a thread can run multiple methods.
package sandwich;

/**
 * @author Official account: IT sandwich
 * @date 2021/3/7
 */
public class MethodAndStack {

    public static void main(String[] args) {
        A();
    }

    private static void A(){
        B();
        System.out.println("Executing A method");
    }

    private static void B(){
        C();
        System.out.println("Executing B method");
    }

    private static void C() {
        System.out.println("Executing C method");
    }
}

#results of enforcement
Executing C method
Executing B method
Executing A method

Process finished with exit code 0
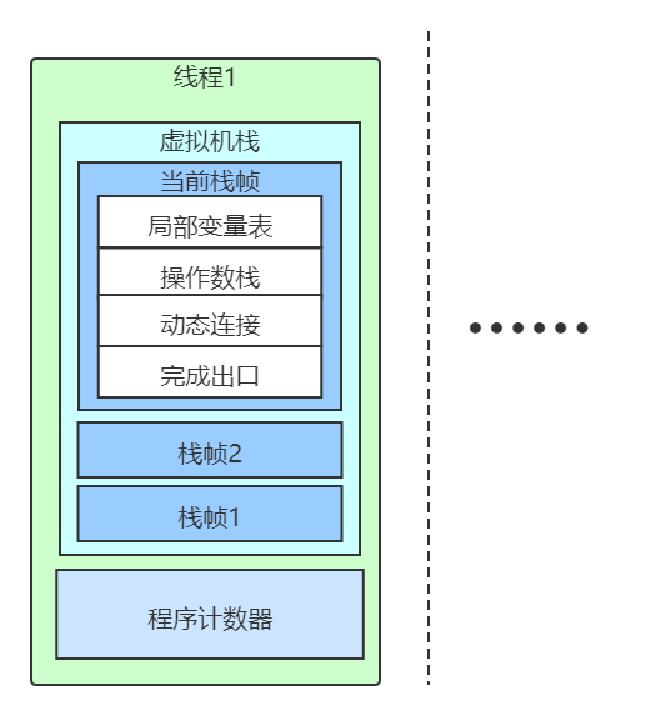
This code is very simple, that is to set up a main method, calling the A method in the main method operation, calling the B method in the A method, and running the C method in the B method. When we run the code, thread 1 runs the code. When thread 1 runs, there will be a corresponding virtual machine stack, and each method will be packaged into a stack frame. For example, main starts running, packs a stack frame and sends it to the virtual machine stack.

Method C runs, method C goes out of the stack, then method B runs, method B goes out of the stack, then method A runs, and then method A goes out of the stack. Finally, the main method runs, and the stack frame of the main method goes out of the stack. This is the impact of Java method operation on the virtual machine stack. Virtual machine stack is used to store data in thread running methods. Each method corresponds to A stack frame.
#Virtual machine stack
Stack data structure: first in last out (FILO) data structure,
The function of virtual machine stack: store the data, instructions and return addresses required by the current thread running method during the JVM running process.
The virtual machine stack is thread based: even if you have only one main() method, it runs as a thread. In the life cycle of the thread, the data involved in the calculation will be frequently put on and out of the stack. The life cycle of the stack is the same as that of the thread. The default size of the virtual machine stack is 1M. You can use the parameter - Xss to adjust the size, such as - Xss256k. Parameter official document (JDK1.8): https://docs.oracle.com/javase/8/docs/technotes/tools/unix/java.html
-Xsssize
Sets the thread stack size (in bytes). Append the letter k or K to indicate KB, m or M to indicate MB, g or G to indicate GB. The default value depends on the platform:

Linux/ARM (32-bit): 320 KB

Linux/i386 (32-bit): 320 KB

Linux/x64 (64-bit): 1024 KB

OS X (64-bit): 1024 KB

Oracle Solaris/i386 (32-bit): 320 KB

Oracle Solaris/x64 (64-bit): 1024 KB

The following examples set the thread stack size to 1024 KB in different units:

-Xss1m
-Xss1024k
-Xss1048576
This option is equivalent to -XX:ThreadStackSize.
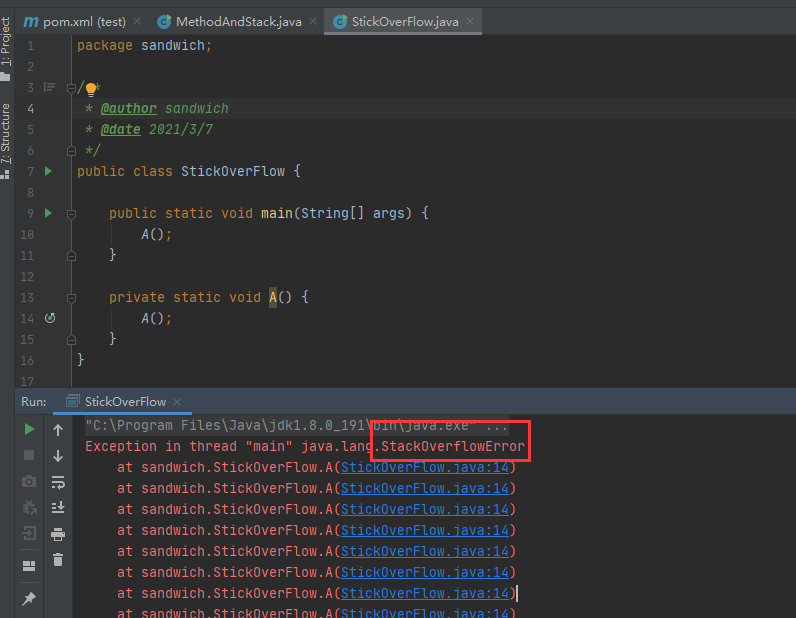
The memory of the virtual machine stack is not infinite. It has a size limit of 1M by default. If we keep putting frames into the virtual machine stack but don't get out of the stack, the virtual machine stack will explode.
The following is A recursive call. The stack frame of method A is put on the stack until it exceeds the size of the virtual machine stack. The call bursts before it starts out of the stack
#Program counter
Indicates the address of the bytecode instruction being executed by the current thread. It only occupies a small memory space, and the line number indicator of the bytecode executed by the current thread; Each thread is stored independently and does not affect each other.
Program counter is a small memory space, which is mainly used to record the address of bytecode executed by each thread. For example, branch, loop, jump, exception, thread recovery, etc. all depend on the counter. Because Java is a multi-threaded language, when the number of threads executed exceeds the number of CPU cores, threads will compete for CPU resources according to time slice polling. If the time slice of a thread runs out, or the CPU resources of the thread are robbed in advance due to other reasons, the exiting thread needs a separate program counter to record the next running instruction.
Because the JVM is a virtual machine with a complete set of instructions and execution processes, it is necessary to use the program counter (record the address or line number of bytecode execution) when running Java methods. If the local method (native method) is encountered, this method is not executed by the JVM, so the program counter does not need to be recorded, This is because there is also a program counter at the operating system level, which will record the execution address of the local code. Therefore, when the native method is executed, the value of the program counter in the JVM is empty (Undefined).
In addition, the program counter is also the only memory area in the JVM that will not OOM(OutOfMemory).
Why set up the program technician?
It is mainly to serve the time slice rotation mechanism of the operating system.
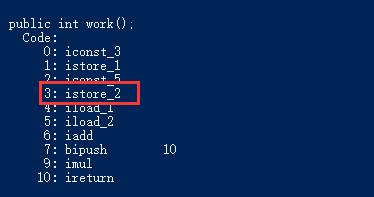
When the bytecode of this thread is executed to line 3, the time slice of this thread runs out, the cpu will execute other threads, and the program counter still stays at this address. When the cpu returns to this thread, it also knows to execute from this address.
Because sandwich university is mainly engaged in MCU and embedded development, it can be understood from the lower principle. It is now interrupted to execute other threads. The computer has many interrupts, and each interrupt has a different priority. After a higher priority interrupt is triggered, you can interrupt the current thread and execute the higher priority thread first. Return to this thread after the higher priority task is completed, and it can execute from the address code recorded by the program counter.
The sandwich computer is four core and eight thread
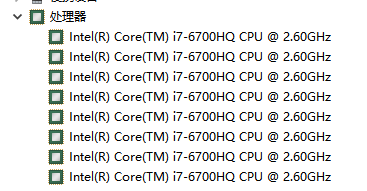
The number of logical processors is 8
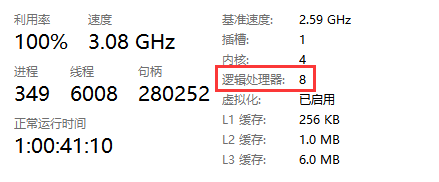
Theoretically, only 8 threads can be executed at the same time. However, the computer may need to process countless threads. It needs this time slice and interrupt mechanism to switch between different threads. When returning to the original thread, it can also start execution through the address code recorded by the program counter. However, the time of this time slice is extremely short, and the user has no perception, just like a thread has never been interrupted.
#Effect of stack frame execution on memory area
Disassemble class javap – C XXXX Class bytecode mnemonic interpretation address: https://cloud.tencent.com/developer/article/1333540
package sandwich;

/**
 * @author Official account: IT sandwich
 * @date 2021/3/7
 */
public class Person {

    private int work() {
        int i = 1;
        int j = 2;
        return (i + j) * 3;
    }

    public static void main(String[] args) {
        Person person = new Person();
        int z = person.work();
        System.out.println("result=" + z);

        person.hashCode();
    }
}

//The following code is obtained after reverse compilation
PS D:\git\test\target\classes\sandwich> javap -c .\Person.class
Compiled from "Person.java"
public class sandwich.Person {
  public sandwich.Person();
    Code:
       0: aload_0
       1: invokespecial #1                  // Method java/lang/Object."<init>":()V
       4: return

  public static void main(java.lang.String[]);
    Code:
       0: new           #2                  // class sandwich/Person
       3: dup
       4: invokespecial #3                  // Method "<init>":()V
       7: astore_1
       8: aload_1
       9: invokespecial #4                  // Method run:()I
      12: pop
      13: aload_1
      14: invokevirtual #5                  // Method java/lang/Object.hashCode:()I
      17: pop
      18: return
After testing, this is not the disassembly code I want, because I want to see the execution of the work() method
I changed the work() method from private to public and try again
package sandwich;

/**
 * @author Official account: IT sandwich
 * @date 2021/3/7
 */
public class Person {

    public int work() {
        int i = 3;
        int j = 5;
        return (i + j) * 10;
    }

    public static void main(String[] args) {
        Person person = new Person();
        int z = person.work();
        System.out.println("result=" + z);

        person.hashCode();
    }
}
//The following code is obtained after reverse compilation
PS D:\git\test\target\classes\sandwich> javap -c .\Person.class
Compiled from "Person.java"
public class sandwich.Person {
  public sandwich.Person();
    Code:
       0: aload_0
       1: invokespecial #1                  // Method java/lang/Object."<init>":()V
       4: return

public int work();
    Code:
       0: iconst_3   //Push int type (3) to the top of the stack
       1: istore_1   //Save int(3) at the top of the operand stack to the first local variable. The instruction can be read as: save the value of type X(i l f d a) at the top of the stack to the (operand + 1) local variable
       2: iconst_5  //Push int type (5) to the top of the stack
       3: istore_2   //Save int(5) at the top of the operand stack to the second local variable
       4: iload_1   //Load the first local variable int(3) to the top of the operation stack. The instruction can be read as: push the (operand + 1) X(i l f d a) type local variable to the top of the stack
       5: iload_2  //Load the second local variable int(5) to the top of the operation stack
       6: iadd      //int type addition instruction
       7: bipush        10       //The instruction can be read as: pushing the value xxx of type X to the top of the stack or pushing the constant with line number xxx to the top of the stack
       9: imul              //int type multiplication instruction
      10: ireturn     //Return int value

  public static void main(java.lang.String[]);
    Code:
       0: new           #2                  // class sandwich/Person
       3: dup
       4: invokespecial #3                  // Method "<init>":()V
       7: astore_1
       8: aload_1
       9: invokevirtual #4                  // Method run:()I
      12: istore_2
      13: getstatic     #5                  // Field java/lang/System.out:Ljava/io/PrintStream;
      16: new           #6                  // class java/lang/StringBuilder
      19: dup
      20: invokespecial #7                  // Method java/lang/StringBuilder."<init>":()V
      23: ldc           #8                  // String result=
      25: invokevirtual #9                  // Method java/lang/StringBuilder.append:(Ljava/lang/String;)Ljava/lang/StringBuilder;
      28: iload_2
      29: invokevirtual #10                 // Method java/lang/StringBuilder.append:(I)Ljava/lang/StringBuilder;
      32: invokevirtual #11                 // Method java/lang/StringBuilder.toString:()Ljava/lang/String;
      35: invokevirtual #12                 // Method java/io/PrintStream.println:(Ljava/lang/String;)
      38: aload_1
      39: invokevirtual #13                 // Method java/lang/Object.hashCode:()I
      42: pop
      43: return
It can be seen that the private method will be compiled into invokespecial instead of being exposed. To completely disassemble, you need to change to the public method.
You can use disassembly code to understand more underlying principles
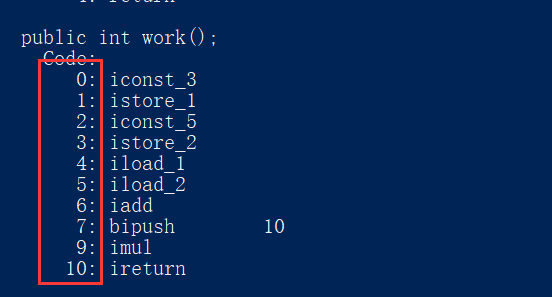
The bytecode line number on the left is the offset in the bytecode relative to the work() method, which can also be understood as an offset address.
I have annotated the disassembly method of work(). If you are interested, you can read it in conjunction with the local variable table and operand stack.
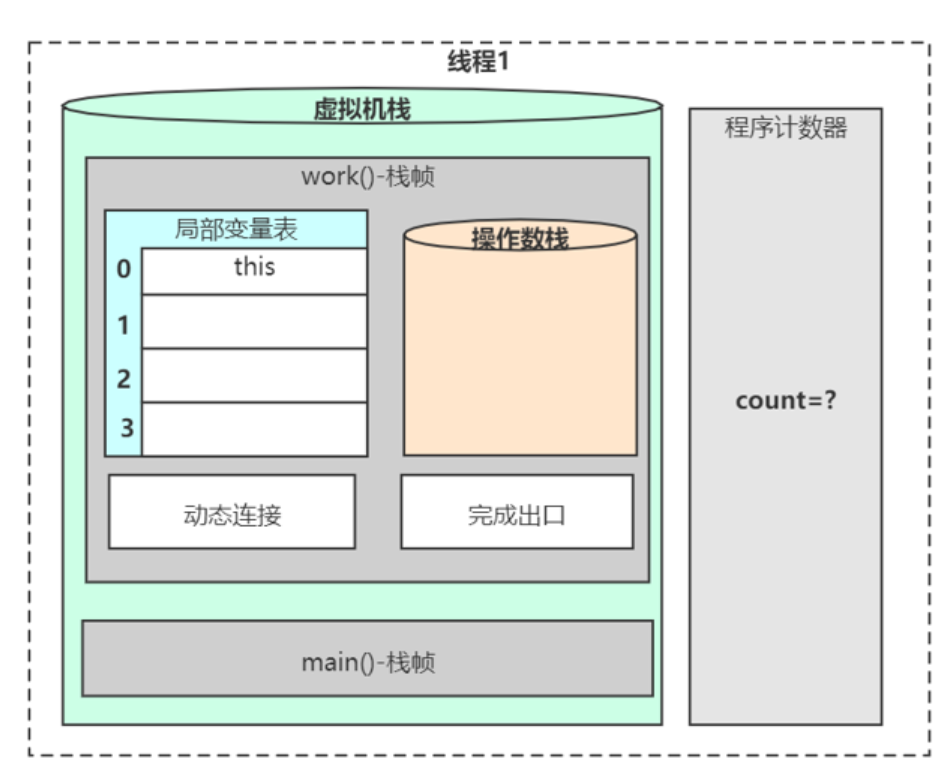
In the JVM, interpretation based execution is a stack based engine. This stack is called the operand stack.
I prefer to understand the operand stack as a cache in memory used to exchange data with the cpu
##Virtual machine stack
Each thread is private. When the thread is running, it will be packaged into a stack frame when executing each method, which stores the local variable table, operand stack, dynamic link, method exit and other information, and then put it into the stack. The current method being executed at each time is the stack frame at the top of the virtual machine stack. The execution of method corresponds to the process of stack frame entering and exiting the virtual machine stack. The stack size defaults to 1M. You can adjust the size with the parameter - Xss, for example - Xss256k
When compiling the program Code, the size of the local variable table and the depth of the operand stack in the stack frame have been completely determined and written into the Code attribute of the method table. Therefore, how much memory needs to be allocated in a stack frame will not be affected by the variable data during the program run time, but only depends on the specific virtual machine implementation.
Local variable table: as the name suggests, it is a table of local variables, which is used to store our local variables. First of all, it is a 32-bit length, which mainly stores the eight basic data types of Java. Generally, it can be stored in 32 bits. If it is 64 bits, it can also be stored in two high and low bits. If it is a local Object, such as our Object object Object, we only need to store its reference address. (basic data type, Object reference, returnAddress type)
Operation data stack: it stores the operands executed by our method. It is a stack. The first in and last out stack structure and operand stack are used for operation. The elements of operation can be any java data type. Therefore, we know that when a method starts, the operand stack of this method is empty, The operation method of operand stack is to always run the operation of entering / exiting the stack
Dynamic connection: Java language features polymorphism (the specific method can be determined only when the class is loaded and run, and the subsequent dynamic dispatch will be explained in detail)
Completion exit (return address): normal return: (call the address in the program counter as return)
Three steps:
Restore the local variable table and operand stack of the upper method
Push the return value (if any) into the operand stack of the caller's stack frame
Adjust the value of the program counter to point to an instruction after the method call instruction
In case of exception: (determined by exception handling table < in non stack frame >)
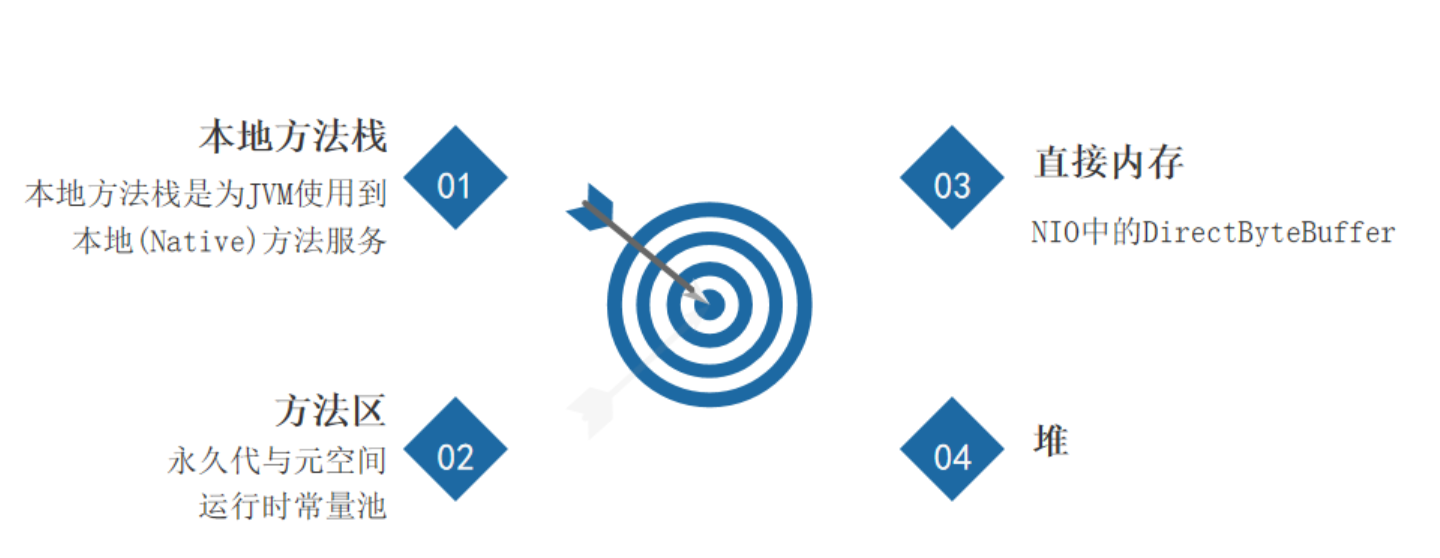
#Overall memory structure of runtime data area and JVM
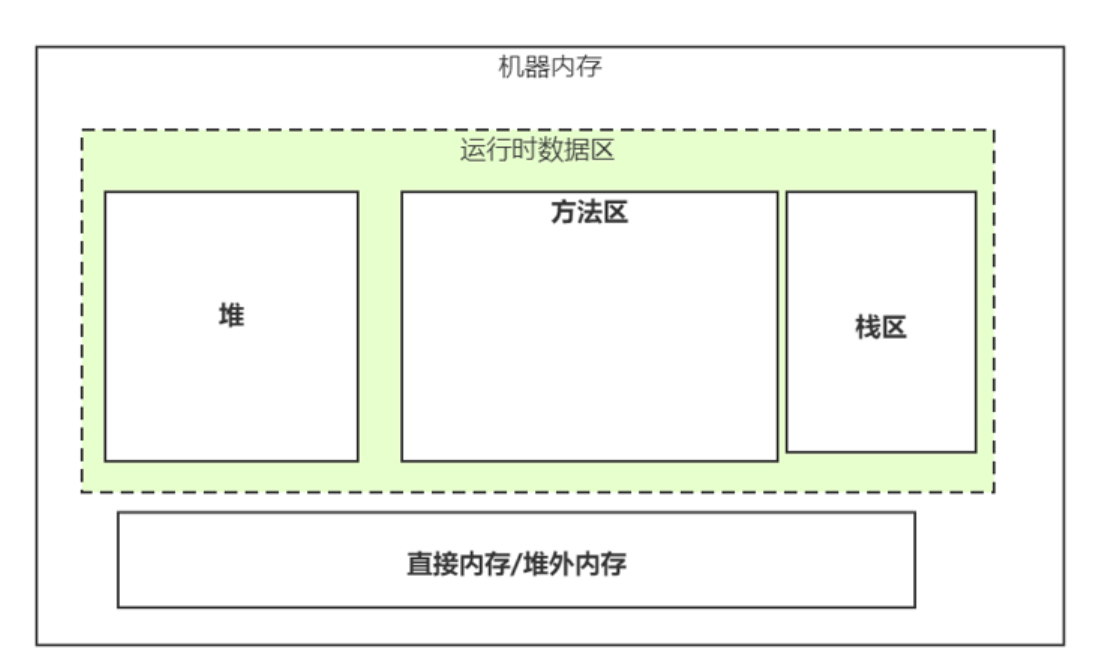
##Local method stack
The function of local method stack is similar to that of Java virtual machine stack. Java virtual machine stack is used to manage the call of Java function, while local method stack is used to manage the call of local method. However, local methods are not implemented in Java, but in C language (such as Object.hashcode method).
The local method stack is an area very similar to the virtual machine stack, and its service object is the native method. You can even think of the virtual machine stack and the local method stack as the same area.
There are no mandatory provisions in the virtual machine specification, and each version of the virtual machine can be implemented freely. HotSpot directly combines the local method stack and the virtual machine stack.
##Method area
**Method Area * * is a runtime memory area that can be shared by all threads. It stores the structure information of each class, such as the field and method data of the Runtime Constant Pool, the bytecode content of constructors and ordinary methods, and some special methods used in the initialization of classes, instances and interfaces
The method area is the JVM's "logical partition" of memory, which is in jdk1 7 and before, many developers used to call the method area "permanent generation", because in the HotSpot virtual machine, designers used the permanent generation to implement the method area of the JVM specification. At jdk1 8 and later, the meta space is used to implement the method area.
####Meta space
Similar to heap space, the method area is also a shared memory area, so the method area is shared by threads. If two threads try to access the same class information in the method area, and the class has not been loaded into the JVM, only one thread is allowed to load it, and the other thread must wait.
In the HotSpot virtual machine and Java7 version, the static variables and runtime constant pool of the permanent generation have been transferred to the heap, and the rest are stored in the non heap memory of the JVM. In the Java8 version, the permanent generation implemented in the method area has been removed, and the previous permanent generation has been replaced with a class metadata, and the storage location of the meta space is local memory.
Meta space size parameter:
jdk1.7 and before (initial and maximum): - XX:PermSize- XX:MaxPermSize;
jdk1. After 8 (initial and maximum): - XX:MetaspaceSize- XX:MaxMetaspaceSize
jdk1. After 8, the size is only limited by the total memory of the machine (if no parameters are set)
JVM parameter reference: https://docs.oracle.com/javase/8/docs/technotes/tools/unix/java.html
Why does Java 8 use meta space instead of permanent generation, and what are the benefits of doing so?
The official explanation is that removing the permanent generation is an effort to integrate the HotSpot JVM and JRockit VM. Because JRockit does not have a permanent generation, it is not necessary to configure a permanent generation.
The permanent generation memory is often insufficient or memory overflow occurs, and an exception Java lang.OutOfMemoryError: PermGen. This is because in jdk1 In version 7, the specified size of permgen area is 8M. Because the metadata information of classes in permgen may be collected every FullGC, the recovery rate is low, and the performance is difficult to be satisfactory; In addition, it is difficult to determine how much space is allocated for permgen. The size of PermSize depends on many factors, such as the total number of classes loaded by the JVM, the size of the constant pool and the size of the method.
####Runtime constant pool
The Runtime Constant Pool is the runtime representation of the Constant_Pool of each class or interface. It includes several different constants: from the numeric literal known at compile time to the method or field reference that can be obtained only after parsing at run time.
The runtime constant pool is part of the method area. Another important feature of the runtime constant pool relative to the Class constant pool is that it is dynamic (the Class constant pool will be described in detail in the Class loading chapter).
##Pile
The heap is the largest memory area on the JVM. Almost all objects we apply for are stored here. As we often call garbage collection, the object of operation is the heap.
Heap space is usually applied for when the program starts, but not all of it will be used. The heap is generally set to be scalable.
With the frequent creation of objects and the occupation of heap space, it is necessary to recycle objects that are no longer used from time to time. In Java, this is called GC (Garbage Collection).
When an object is created, is it allocated on the heap or on the stack? This is related to two aspects: the type of object and its location in Java classes.
Java objects can be divided into basic data types and ordinary objects. For ordinary objects, the JVM will first create the object on the heap, and then use its reference elsewhere. For example, save this reference in the local variable table of the virtual machine stack. For basic data types (byte, short, int, long, float, double, char), there are two cases.
When you declare an object of basic data type in the method body, it will be allocated directly on the stack. In other cases, it is allocated on the heap.
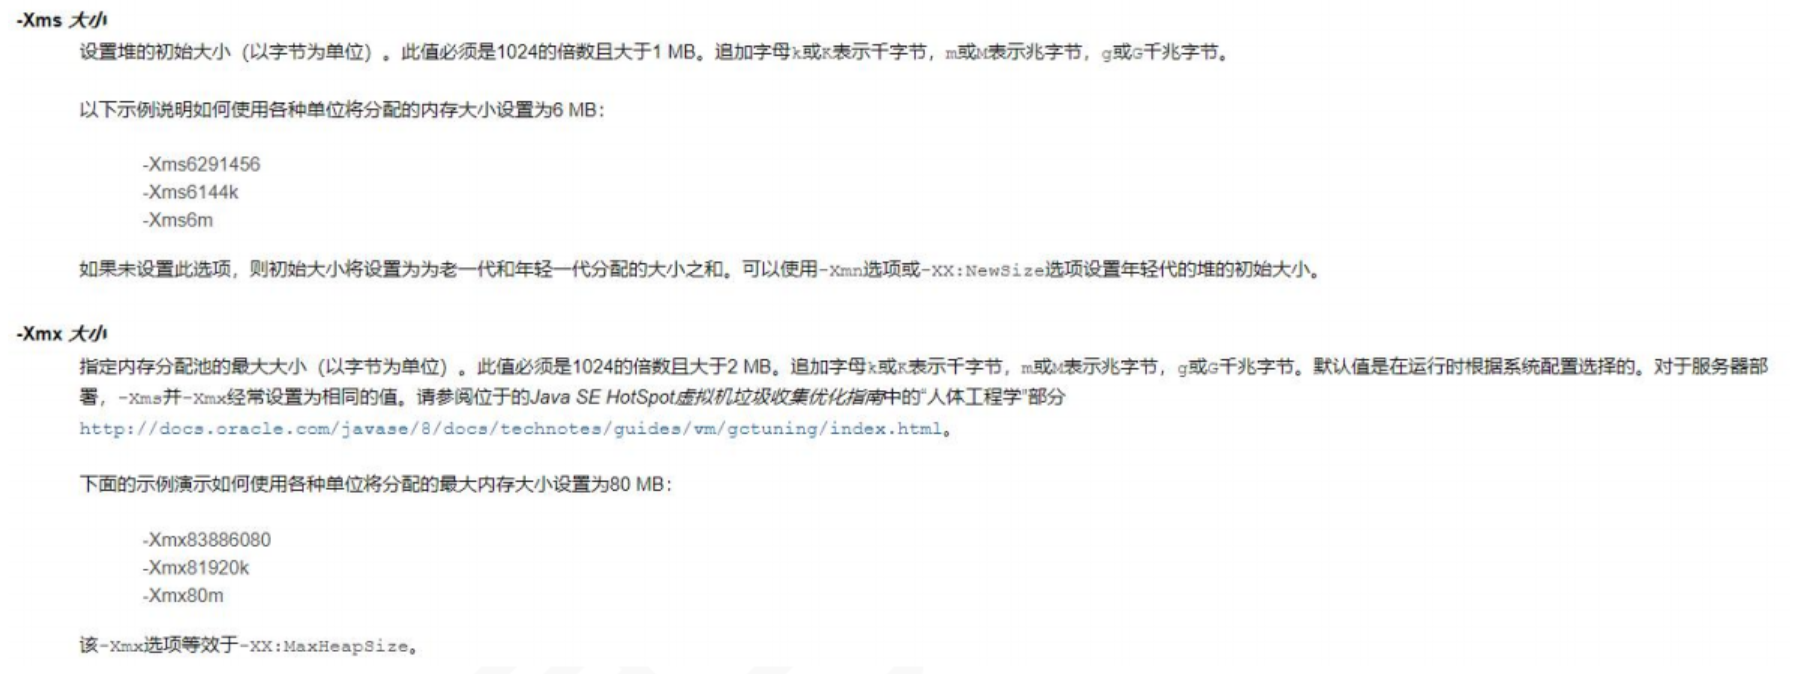
Heap size parameter:
-Xms: minimum value of heap;
-Xmx: maximum value of heap;
-Xmn: size of Cenozoic;
-XX:NewSize; Cenozoic minimum;
-20: Maxnewsize: Cenozoic maximum;
For example - Xmx256m
##Direct memory (off heap memory)
Direct memory has a more scientific name, off heap memory.
When the JVM is running, it will request large blocks of heap memory from the operating system for data storage;
At the same time, there are virtual machine stack, local method stack and program counter, which is called stack area.
The remaining memory of the operating system is off heap memory.
It is not a part of the virtual machine runtime data area, nor is it a memory area defined in the java virtual machine specification; If NIO is used, this area will be frequently used. The directByteBuffer object can be directly referenced and operated in the java heap;
This memory is not limited by the java heap size, but by the total memory of the machine. It can be set through - XX:MaxDirectMemorySize (the default is the same as the maximum heap memory), so OOM exceptions will also occur.
If the direct memory does not belong to the virtual machine runtime data collector area, it will not be automatically recycled by the JVM after use, and it needs to be actively recycled. Otherwise, it is prone to memory overflow.