MyTT
MyTT is a Swiss Army knife in your quantitative toolbox. It is refined and efficient. It simply transplants the indicator formula indicators such as tongdaxin, tonghuashun, Mandarin Chinese and wheat language into Python. The core library is a single file with only 100 lines of code. It implements and converts all common indicators of tonghuashun tongdaxin, such as MACD, RSI, BOL, ATR, KDJ, CCI, Psy, etc. all based on function encapsulation of numpy and pandas, which is simple and high-performance, It can be easily applied in the fields of stock market technical analysis, automatic programmed trading of stocks, quantification of digital currency BTC and so on
Functional features
-
Core library lightweight: the project library is just a file MyTT Py, no installation, no setting, just use and go (from MyTT import *)
-
Code Humanization:) there are no conspicuous programming tricks. Beginners can understand them. They can increase their own indicators and use them in the project immediately.
-
There is no need to install TA lib library, which is the core logic implemented by pure python code. Many people have the painful experience of installing TA lib library
-
It is completely compatible with the index writing method of tongdaxin and tonghuashun. A new index can be used directly without modification
-
Ultra high performance, basically no loop, all rely on the built-in functions of numpy and pandas to achieve various indicators
-
Like the Talib library, it is multi-day parameter input and multi-day indicator (sequence input and sequence output), which is convenient for drawing and observing trends
-
Various indexes realized by MyTT are consistent with the technical indexes of tongdaxin, flush, snowball and other software to 2 decimal places
Let's start with the simplest example
#Stock market data acquisition and mapping-2
from  Ashare import *          #Stock database https://github.com/mpquant/Ashare
from  MyTT import *            #myTT language tool function index library https://github.com/mpquant/MyTT

# Securities codes are compatible with a variety of formats, tongdaxin, flush, jukuan
# sh000001 (000001.XSHG)    sz399006 (399006.XSHE)   sh600519 ( 600519.XSHG )

df=get_price('000001.XSHG',frequency='1d',count=120)      #Get the daily real-time market for the first 120 days today
print('Shanghai Stock Index daily market\n',df.tail(5))

#-------With the data, let's get to the point-------------
CLOSE=df.close.values;         OPEN=df.open.values       #The basic data definition can be used as long as the sequence is passed in
HIGH=df.high.values;           LOW=df.low.values         #For example, CLOSE=list(df.close) is the same

MA5=MA(CLOSE,5)                                #Get the 5-day moving average sequence
MA10=MA(CLOSE,10)                              #Get the 10 day moving average sequence
up,mid,lower=BOLL(CLOSE)                       #Obtain Bollinger belt index data

print('BTC5 Daily average', MA5[-1] )                          # Take only the last number
print('BTC10 Daily average',RET(MA10))                         # RET(MA10) == MA10[-1]
print('Do you wear the 10th line on the 5th line today',RET(CROSS(MA5,MA10)))
print('Are the closing prices of the last five days all greater than the 10 day line?',EVERY(CLOSE>MA10,5) )
#Shanghai Stock Index daily market----------------------------------------------------
              open    close     high      low       volume
2021-06-07  3597.14  3599.54  3600.38  3581.90  303718677.0
2021-06-08  3598.75  3580.11  3621.52  3563.25  304491470.0
2021-06-09  3576.80  3591.40  3598.71  3572.64  298323296.0
2021-06-10  3587.53  3610.86  3624.34  3584.13  318174808.0
2021-06-11  3614.11  3589.75  3614.40  3587.15  360554970.0


#Guizhou Maotai 60 minute line----------------------------------------------------
                       open    close     high      low    volume
2021-06-10 14:00:00  2237.00  2224.16  2245.00  2222.00   4541.53
2021-06-10 15:00:00  2222.21  2238.48  2240.34  2222.21   4146.88
2021-06-11 10:30:00  2239.00  2220.00  2244.00  2197.86  12030.00
2021-06-11 11:30:00  2220.01  2210.18  2231.80  2200.18   4868.00
2021-06-11 14:00:00  2210.10  2223.35  2224.48  2206.01   4544.00
2021-06-11 15:00:00  2223.33  2178.81  2226.80  2178.81  12529.00
Some tool functions in MyTT Library
#------------------Level 0: core tool functions--------------------------------------------
def RD(N,D=3):   return np.round(N,D)        #Rounded to 3 decimal places
def RET(S,N=1):  return np.array(S)[-N]      #Returns the penultimate value of the sequence. The last value is returned by default
def ABS(S):      return np.abs(S)            #Returns the absolute value of N
def MAX(S1,S2):  return np.maximum(S1,S2)    #Sequence max
def MIN(S1,S2):  return np.minimum(S1,S2)    #Sequence min

def MA(S,N):           #Find the N-day average of the sequence and return the sequence
    return pd.Series(S).rolling(N).mean().values     # pd.rolling_mean(S,N)  (Python2)

def REF(S, N=1):       #Move N down the sequence as a whole and return the sequence (Nan will be generated after shift)
    return pd.Series(S).shift(N).values

def DIFF(S, N=1):      #If the previous value is subtracted from the next value, nan will be generated in front
    return pd.Series(S).diff(N)  #np.diff(S) delete nan directly, and one line will be lost

def STD(S,N):           #Find the N-day standard deviation of the sequence and return the sequence
    return  pd.Series(S).rolling(N).std(ddof=0).values

def IF(S_BOOL,S_TRUE,S_FALSE):          #Sequence Boolean judgment res=S_TRUE if S_BOOL==True  else  S_FALSE
    return np.where(S_BOOL, S_TRUE, S_FALSE)

def SUM(S, N):            #Calculate the N-day cumulative sum of the sequence, return the sequence N=0, and sum all the sequences in turn
    return pd.Series(S).rolling(N).sum().values if N>0 else pd.Series(S).cumsum()    #pd.rolling_sum(S,N)  (Python2)

def HHV(S,N):             # HHV(C, 5)  # Highest closing price in the last five days
    return pd.Series(S).rolling(N).max().values      # pd.rolling_max(S,N)  (Python2)

def LLV(S,N):             # LLV(C, 5)  # Lowest closing price in the last five days
    return pd.Series(S).rolling(N).min().values      # pd.rolling_min(S,N)  (Python2)

def EMA(S,N):             #Exponential moving average, in order to achieve accuracy s > 4 * n, EMA needs at least 120 cycles
    return pd.Series(S).ewm(span=N, adjust=False).mean().values

def SMA(S, N, M=1):       #Chinese SMA requires at least 120 cycles to be accurate
    K = pd.Series(S).rolling(N).mean()    #Find the average value first (please let us know if there is a way to improve the performance without cycling)
    for i in range(N+1, len(S)):  K[i] = (M * S[i] + (N -M) * K[i-1]) / N  # Because we want to take K[i-1], range(N+1, len(S))
    return K

def AVEDEV(S,N):           #Mean absolute deviation (the average of the absolute difference between the sequence and its mean)
    avedev=pd.Series(S).rolling(N).apply(lambda x: (np.abs(x - x.mean())).mean())
    return avedev.values

def SLOPE(S,N,RS=False):    #Return the slope of linear regression for N cycles of S sequence (only the slope is returned by default, not the whole linear sequence)
    M=pd.Series(S[-N:]);   poly = np.polyfit(M.index, M.values,deg=1);    Y=np.polyval(poly, M.index);
    if RS: return Y[1]-Y[0],Y
    return Y[1]-Y[0]
The realized technical indicators basically cover the vast majority of commonly used indicators
#------------------Level 2: technical index function (all realized through level 0 and level 1 functions)------------------------------
def MACD(CLOSE,SHORT=12,LONG=26,M=9):            # For the relationship between EMA, S takes 120 days, which is the same as the two decimal places of snowball
    DIF = EMA(CLOSE,SHORT)-EMA(CLOSE,LONG);
    DEA = EMA(DIF,M);      MACD=(DIF-DEA)*2
    return RD(DIF),RD(DEA),RD(MACD)

def KDJ(CLOSE,HIGH,LOW, N=9,M1=3,M2=3):         # KDJ index
    RSV = (CLOSE - LLV(LOW, N)) / (HHV(HIGH, N) - LLV(LOW, N)) * 100
    K = EMA(RSV, (M1*2-1));    D = EMA(K,(M2*2-1));        J=K*3-D*2
    return K, D, J

def RSI(CLOSE, N=24):
    DIF = CLOSE-REF(CLOSE,1)
    return RD(SMA(MAX(DIF,0), N) / SMA(ABS(DIF), N) * 100)

def WR(CLOSE, HIGH, LOW, N=10, N1=6):            #W & R indicators
    WR = (HHV(HIGH, N) - CLOSE) / (HHV(HIGH, N) - LLV(LOW, N)) * 100
    WR1 = (HHV(HIGH, N1) - CLOSE) / (HHV(HIGH, N1) - LLV(LOW, N1)) * 100
    return RD(WR), RD(WR1)

def BIAS(CLOSE,L1=6, L2=12, L3=24):              # BIAS deviation rate
    BIAS1 = (CLOSE - MA(CLOSE, L1)) / MA(CLOSE, L1) * 100
    BIAS2 = (CLOSE - MA(CLOSE, L2)) / MA(CLOSE, L2) * 100
    BIAS3 = (CLOSE - MA(CLOSE, L3)) / MA(CLOSE, L3) * 100
    return RD(BIAS1), RD(BIAS2), RD(BIAS3)

def BOLL(CLOSE,N=20, P=2):                       #BOLL index, brin zone
    MID = MA(CLOSE, N);
    UPPER = MID + STD(CLOSE, N) * P
    LOWER = MID - STD(CLOSE, N) * P
    return RD(UPPER), RD(MID), RD(LOWER)

def PSY(CLOSE,N=12, M=6):
    PSY=COUNT(CLOSE>REF(CLOSE,1),N)/N*100
    PSYMA=MA(PSY,M)
    return RD(PSY),RD(PSYMA)

def CCI(CLOSE,HIGH,LOW,N=14):
    TP=(HIGH+LOW+CLOSE)/3
    return (TP-MA(TP,N))/(0.015*AVEDEV(TP,N))

def ATR(CLOSE,HIGH,LOW, N=20):                    #Daily average of real fluctuation N
    TR = MAX(MAX((HIGH - LOW), ABS(REF(CLOSE, 1) - HIGH)), ABS(REF(CLOSE, 1) - LOW))
    return MA(TR, N)

def BBI(CLOSE,M1=3,M2=6,M3=12,M4=20):             #BBI long and short index
    return (MA(CLOSE,M1)+MA(CLOSE,M2)+MA(CLOSE,M3)+MA(CLOSE,M4))/4

def DMI(CLOSE,HIGH,LOW,M1=14,M2=6):               #Trend indicators: the results are completely consistent with flush and tongdaxin
    TR = SUM(MAX(MAX(HIGH - LOW, ABS(HIGH - REF(CLOSE, 1))), ABS(LOW - REF(CLOSE, 1))), M1)
    HD = HIGH - REF(HIGH, 1);     LD = REF(LOW, 1) - LOW
    DMP = SUM(IF((HD > 0) & (HD > LD), HD, 0), M1)
    DMM = SUM(IF((LD > 0) & (LD > HD), LD, 0), M1)
    PDI = DMP * 100 / TR;         MDI = DMM * 100 / TR
    ADX = MA(ABS(MDI - PDI) / (PDI + MDI) * 100, M2)
    ADXR = (ADX + REF(ADX, M2)) / 2
    return PDI, MDI, ADX, ADXR

def TAQ(HIGH,LOW,N):                               #Tang Anqi channel (turtle) trading index, the avenue to Jane, can cross cattle and bears
    UP=HHV(HIGH,N);    DOWN=LLV(LOW,N);    MID=(UP+DOWN)/2
    return UP,MID,DOWN

def KTN(CLOSE,HIGH,LOW,N=20,M=10):                 #Kentner trading channel, N chooses 20 days and ATR chooses 10 days
    MID=EMA((HIGH+LOW+CLOSE)/3,N)
    ATRN=ATR(CLOSE,HIGH,LOW,M)
    UPPER=MID+2*ATRN;   LOWER=MID-2*ATRN
    return UPPER,MID,LOWER

def TRIX(CLOSE,M1=12, M2=20):                      #Triple exponential smoothing average
    TR = EMA(EMA(EMA(CLOSE, M1), M1), M1)
    TRIX = (TR - REF(TR, 1)) / REF(TR, 1) * 100
    TRMA = MA(TRIX, M2)
    return TRIX, TRMA

def VR(CLOSE,VOL,M1=26):                            #VR capacity ratio
    LC = REF(CLOSE, 1)
    return SUM(IF(CLOSE > LC, VOL, 0), M1) / SUM(IF(CLOSE <= LC, VOL, 0), M1) * 100

def EMV(HIGH,LOW,VOL,N=14,M=9):                     #Simple fluctuation index
    VOLUME=MA(VOL,N)/VOL;       MID=100*(HIGH+LOW-REF(HIGH+LOW,1))/(HIGH+LOW)
    EMV=MA(MID*VOLUME*(HIGH-LOW)/MA(HIGH-LOW,N),N);    MAEMV=MA(EMV,M)
    return EMV,MAEMV


def DPO(CLOSE,M1=20, M2=10, M3=6):                  #Interval Oscillation line
    DPO = CLOSE - REF(MA(CLOSE, M1), M2);    MADPO = MA(DPO, M3)
    return DPO, MADPO

def BRAR(OPEN,CLOSE,HIGH,LOW,M1=26):                 #BRAR-ARBR emotional indicators
    AR = SUM(HIGH - OPEN, M1) / SUM(OPEN - LOW, M1) * 100
    BR = SUM(MAX(0, HIGH - REF(CLOSE, 1)), M1) / SUM(MAX(0, REF(CLOSE, 1) - LOW), M1) * 100
    return AR, BR

def DMA(CLOSE,N1=10,N2=50,M=10):                     #Parallel line difference index
    DIF=MA(CLOSE,N1)-MA(CLOSE,N2);    DIFMA=MA(DIF,M)
    return DIF,DIFMA

def MTM(CLOSE,N=12,M=6):                             #Momentum index
    MTM=CLOSE-REF(CLOSE,N);         MTMMA=MA(MTM,M)
    return MTM,MTMMA

def MASS(HIGH,LOW,N1=9,N2=25,M=6):                   # Mace line
    MASS=SUM(MA(HIGH-LOW,N1)/MA(MA(HIGH-LOW,N1),N1),N2)
    MA_MASS=MA(MASS,M)
    return MASS,MA_MASS

def ROC(CLOSE,N=12,M=6):                             #Rate of change index
    ROC=100*(CLOSE-REF(CLOSE,N))/REF(CLOSE,N);    MAROC=MA(ROC,M)
    return ROC,MAROC

def EXPMA(CLOSE,N1=12,N2=50):                        #EMA index average index
    return EMA(CLOSE,N1),EMA(CLOSE,N2);

def OBV(CLOSE,VOL):                                  #Energy tide index
    return SUM(IF(CLOSE>REF(CLOSE,1),VOL,IF(CLOSE<REF(CLOSE,1),-VOL,0)),0)/10000

def ASI(OPEN,CLOSE,HIGH,LOW,M1=26,M2=10):            #Vibration lifting index
    LC=REF(CLOSE,1);      AA=ABS(HIGH-LC);     BB=ABS(LOW-LC);
    CC=ABS(HIGH-REF(LOW,1));   DD=ABS(LC-REF(OPEN,1));
    R=IF( (AA>BB) & (AA>CC),AA+BB/2+DD/4,IF( (BB>CC) & (BB>AA),BB+AA/2+DD/4,CC+DD/4));
    X=(CLOSE-LC+(CLOSE-OPEN)/2+LC-REF(OPEN,1));
    SI=16*X/R*MAX(AA,BB);   ASI=SUM(SI,M1);   ASIT=MA(ASI,M2);
    return ASI,ASIT


  #I hope you can submit more indicators and functions https://github.com/mpquant/MyTT
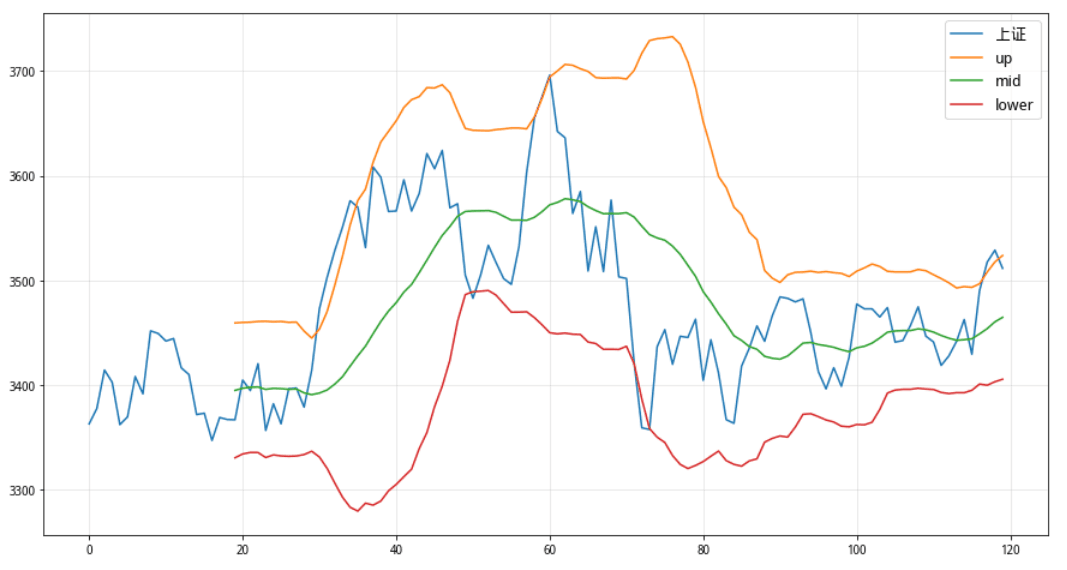
Bol with index data acquisition and drawing demonstration (Shanghai Composite Index)
up,mid,lower=BOLL(CLOSE)                                        #Get brin band data

plt.figure(figsize=(15,8))
plt.plot(CLOSE,label='Shanghai ');    plt.plot(up,label='up');        #Drawing display
plt.plot(mid,label='mid');      plt.plot(lower,label='lower');
Third party libraries need to be installed (TA lib libraries are not required, and pandas can be installed for all indicators)
- pandas