preface
How to make statistical analysis for multiple band values? You can use the reduceRegions functionImage.reduceRegions(collection, reducer, scale, crs, crsTransform, tileScale)
Apply the reducer on the area of each feature in a given set.
The input number of reducer must be the same as the number of bands of the input image.
Return the input features, and each feature adds the corresponding reducer output.
1, Statistics of multiple bands using reduceRegions
Taking the data of NAIP National Agricultural imaging program of the United States as an example, the spatial resolution is 1m. There are four bands, namely R, G, B and N, which are divided into red, green, blue and near red bands. The data is described as follows:
- The national agricultural imaging program (NAIP) obtains aerial images during the agricultural growing season in the mainland of the United States.
- The NAIP project signs contracts every year according to the available funds and image acquisition cycle. Since 2003, NAIP has increased by 5
The year is the cycle of acquisition. 2008 is a transitional year, and 2009 begins a three-year cycle. - NAIP images are acquired at a ground sampling distance (GSD) of one meter, and their horizontal accuracy matches the range of six meters within which the photos used during image inspection can identify ground control points.
- Older images are collected using three bands (red, green and blue: RGB), but newer images are usually collected using an additional near infrared band (RGBN). RGB asset ID
Start with "n", NRG asset ID with "c", and RGBN asset ID with "m_" start.
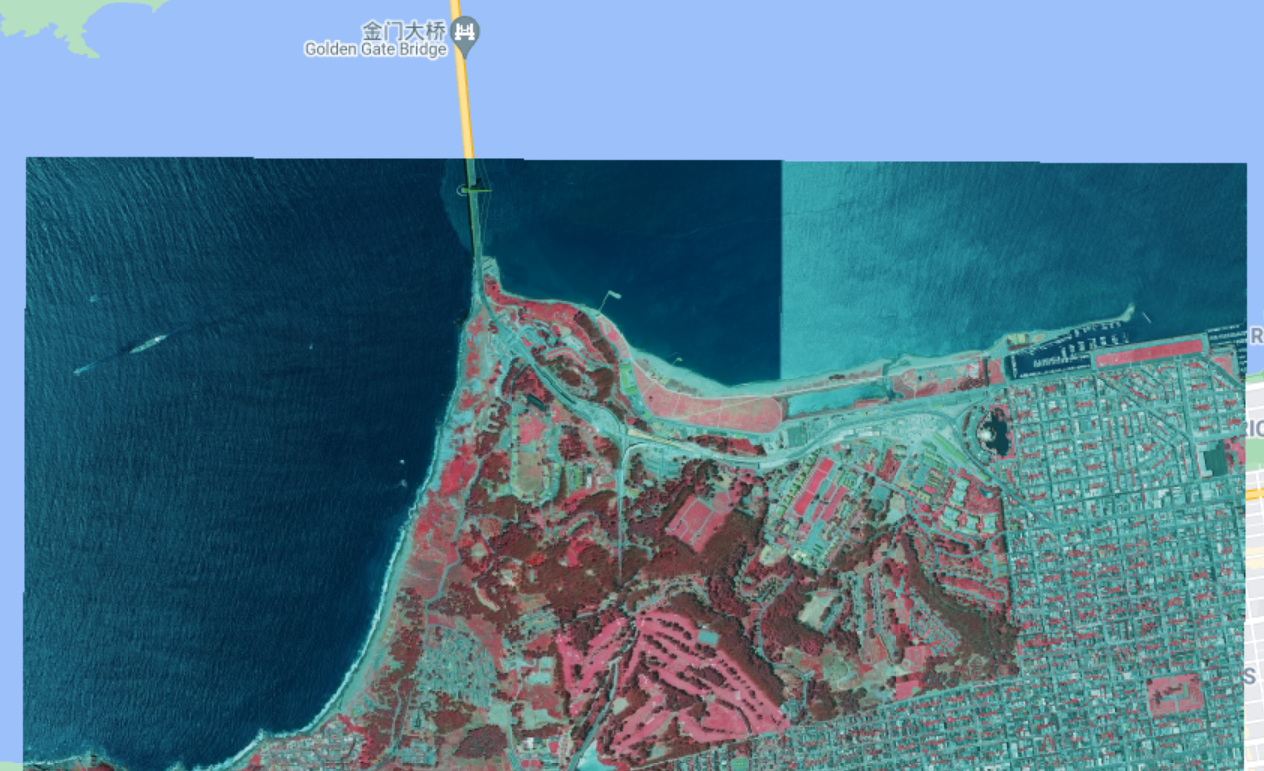
The image of the area around the Golden Gate Bridge in the United States is analyzed
2, Use steps
1. Analysis steps
Functions to learn:
- ee.reduceRegions(): Apply a reducer over the area of each feature in the given collection. The reducer must have the same number of inputs as the input image has bands. Returns the input features, each augmented with the corresponding reducer outputs.
- ee.Reducer.mean(): Returns a Reducer that computes the (weighted) arithmetic mean of its inputs. Returns the reducer that calculates the (weighted) arithmetic mean of its input.
- ee.Reducer.forEachBand(): Creates a Reducer by combining a copy of the given reducer for each band in the given image, using the band names as output names. Create a reducer by combining a copy of a given reducer for each band in a given image and using the band name as the output name.
2.python code
The code is as follows:
Map = geemap.Map()
# Load multi band image data and display it visually
image = ee.Image('USDA/NAIP/DOQQ/m_3712213_sw_10_1_20140613')
Map.setCenter(-122.4712, 37.8041, 14)
Map.addLayer(image, {'bands':['N', 'R', 'G']}, 'NAIP')
Map
# Get the entire image area
geometry = image.geometry()
# Map.addLayer(geometry, {}, 'test')
# Using reduceRegions instead of reduceRegion is mainly for processing multiple bands rather than just a single band
means = image.reduceRegions(geometry, ee.Reducer.mean().forEachBand(image), 10)
means.getInfo()
The results are as follows:
{'type': 'FeatureCollection',
 'columns': {'B': 'Float<0.0, 255.0>',
  'G': 'Float<0.0, 255.0>',
  'N': 'Float<0.0, 255.0>',
  'R': 'Float<0.0, 255.0>',
  'system:index': 'String'},
 'features': [{'type': 'Feature',
   'geometry': {'type': 'Polygon',
    'coordinates': [[[-122.50384809968367, 37.815186584325374],
      [-122.50384809968367, 37.747300979776796],
      [-122.43357895772449, 37.747300954003066],
      [-122.43357895772449, 37.815186523981325],
      [-122.50384809968367, 37.815186584325374]]]},
   'id': '0',
   'properties': {'B': 113.92255161564239,
    'G': 125.41387897689918,
    'N': 86.16627228617047,
    'R': 121.34327479453404}}]}
summary
To summarize:
Mainly for EE reduceRegions,ee.Reducer.mean,ee. Reducer. The foreachband function is learned to realize the simultaneous statistical processing of multiple bands. It can be applied to the statistical analysis of the average, maximum and minimum spectral brightness of multiple bands of landsat and other images.