Author: morning rain remembers light dust
Source: www.cnblogs.com/xifengxiaoma/p/9402497.html
Introduction to JVisualVM
VisualVM is a profile subproject of NetBeans and has been implemented in JDK6.0 0 is included in update 7. It can monitor threads and memory, view the CPU time of methods and objects in memory, and reverse the allocated stack (for example, which objects allocate 100 String objects). In JDK_ Under the home / bin directory (the default is C:\Program Files\Java\jdk1.6.0_13\bin), there is a jvisualvm Exe file. Double click to open it. From the UI, this software is developed based on NetBeans.
VisualVM provides a visual interface for viewing the details of Java technology-based applications running on the Java virtual machine (JVM). VisualVM organizes JVM software related data retrieved by the Java Development Kit (JDK) tool and provides this information in a way that allows you to quickly view data about multiple Java applications.
You can view data about local applications or applications running on remote hosts. In addition, you can capture data about JVM software instances and save the data to the local system for later viewing or sharing with other users.
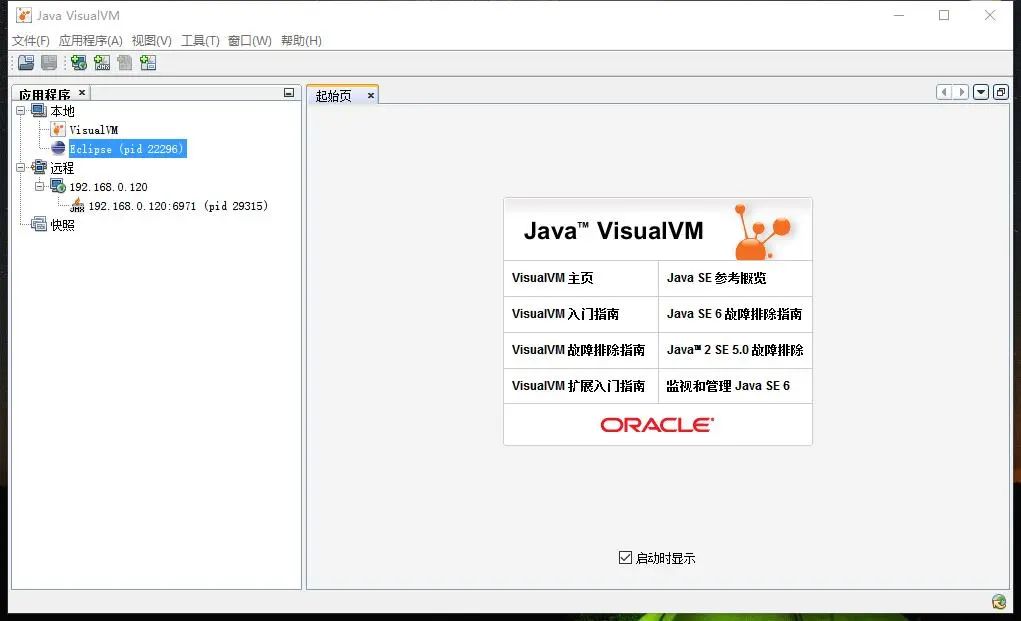
Double click to start jvisualvm.net Exe, like jconsole, you can also select local and remote. If you need to monitor remote, you also need to configure relevant parameters.
The main interface is as follows:
VisualVM can install different plug-ins as required. Each plug-in has different concerns. Some mainly monitor GC, some mainly monitor memory, and some monitor threads.

How to install:
1. From the main menu, select Tools > plug ins.
2. In the available plug-ins tab, select the install check box for the plug-in. Click Install.
3. Step through the plug-in installer.
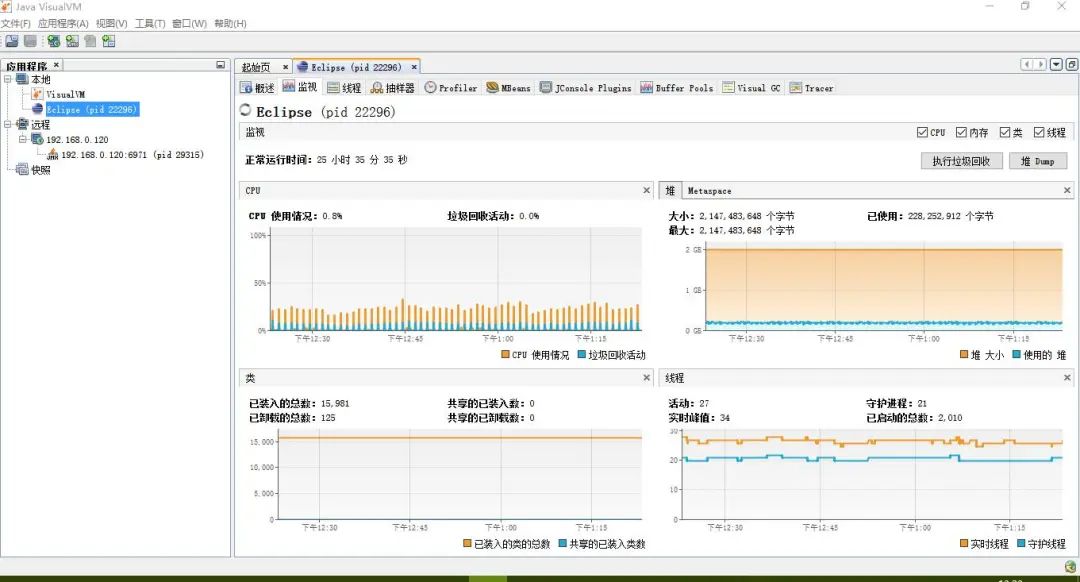
I'll take Eclipse(pid 22296) as an example. Double click and expand it directly. The main interface shows two parts of the system and jvm. Click jvm parameters and system properties at the bottom right to refer to the detailed parameter information

Because there are too many plug-ins for VisualVM, I will mainly introduce three, which I mainly use: monitoring, threading and Visual GC
The home page of monitoring is actually the chart of cpu, memory, class and thread
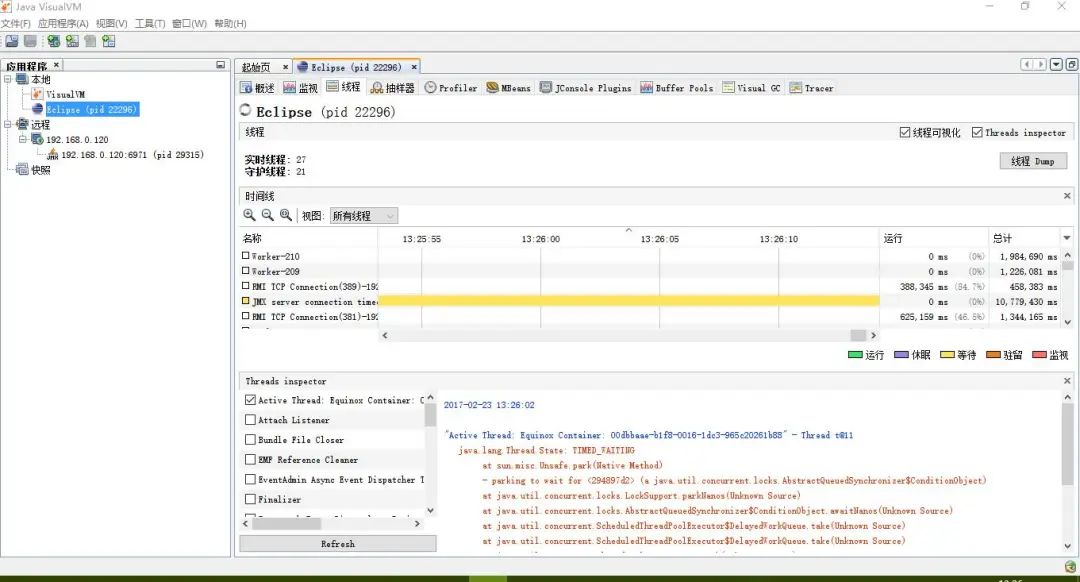
Thread and jconsole functions are not very different
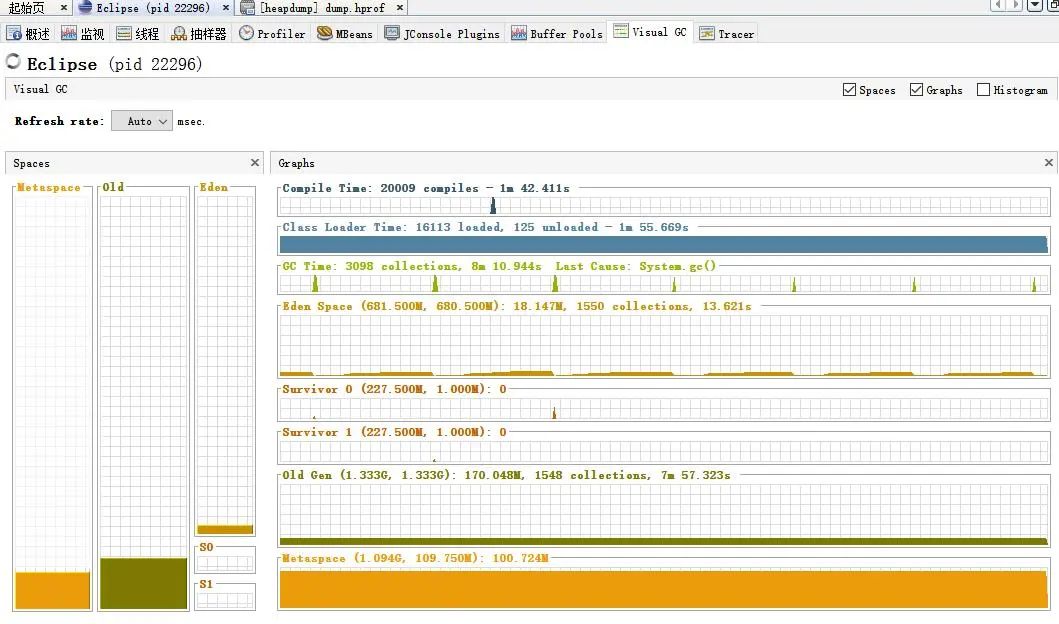
Visual GC is a frequently used function. You can clearly see the memory changes of the young generation and the old age, as well as the gc frequency and gc time.

In fact, jconsole has almost the above functions. VisualVM is more comprehensive and intuitive. In addition, VisualVM has many other functions, which can analyze the memory snapshot of dump,
dump out of the thread snapshot and analysis, there are many other plug-ins, you can explore
Preparing to simulate a memory leak sample
1. Define static variable HashMap
2. Create objects in a segmented loop and add them to HashMap
The code is as follows:
import java.util.HashMap;
import java.util.Map;
public class CyclicDependencies {
    //Declare cache object
    private static final Map map = new HashMap();
    public static void main(String args[]){
        try {
            Thread.sleep(10000);//Give visual VM time to open
        } catch (InterruptedException e) {
            e.printStackTrace();
        }
        //Loop add object to cache
        for(int i=0; i<1000000;i++){
            TestMemory t = new TestMemory();
            map.put("key"+i,t);
        }
        System.out.println("first");
        //Provide time for dump out of heap
        try {
            Thread.sleep(10000);
        } catch (InterruptedException e) {
            e.printStackTrace();
        }
        for(int i=0; i<1000000;i++){
            TestMemory t = new TestMemory();
            map.put("key"+i,t);
        }
        System.out.println("second");
        try {
            Thread.sleep(10000);
        } catch (InterruptedException e) {
            e.printStackTrace();
        }
        for(int i=0; i<3000000;i++){
            TestMemory t = new TestMemory();
            map.put("key"+i,t);
        }
        System.out.println("third");
        try {
            Thread.sleep(10000);
        } catch (InterruptedException e) {
            e.printStackTrace();
        }
        for(int i=0; i<4000000;i++){
            TestMemory t = new TestMemory();
            map.put("key"+i,t);
        }
        System.out.println("forth");
        try {
            Thread.sleep(Integer.MAX_VALUE);
        } catch (InterruptedException e) {
            e.printStackTrace();
        }
        System.out.println("qqqq");
    }
}
3. Configure jvm parameters as follows:
 -Xms512m
 -Xmx512m
 -XX:-UseGCOverheadLimit
 -XX:MaxPermSize=50m
4. Run the program and clock in visual VM monitoring
Analyzing memory leaks using JVisualVM
1. View the Visual GC tag as follows. This is a screenshot of the output first
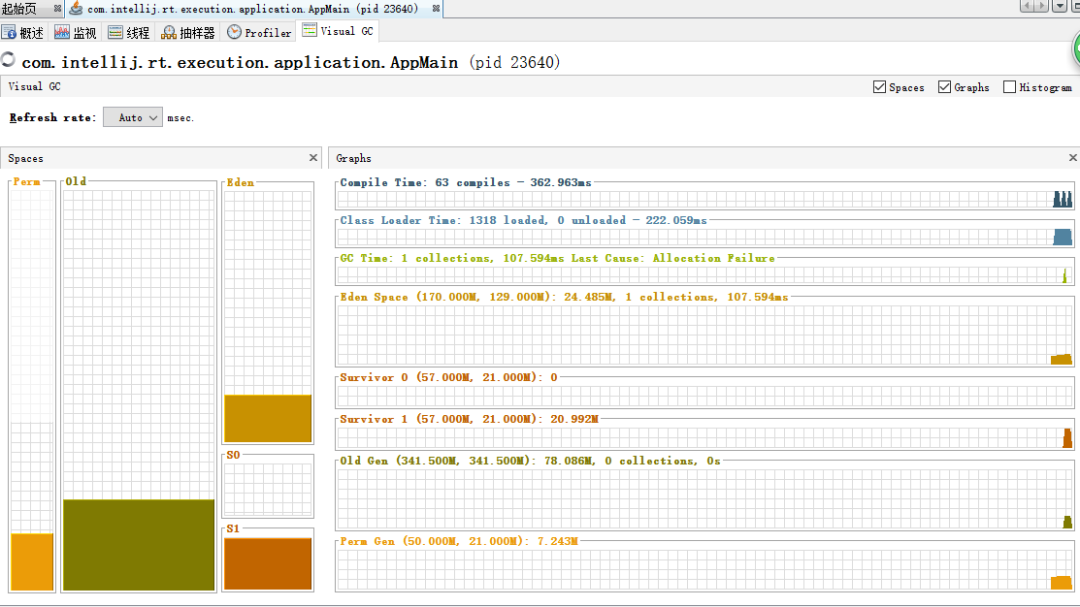
This is a screenshot of the output forth:
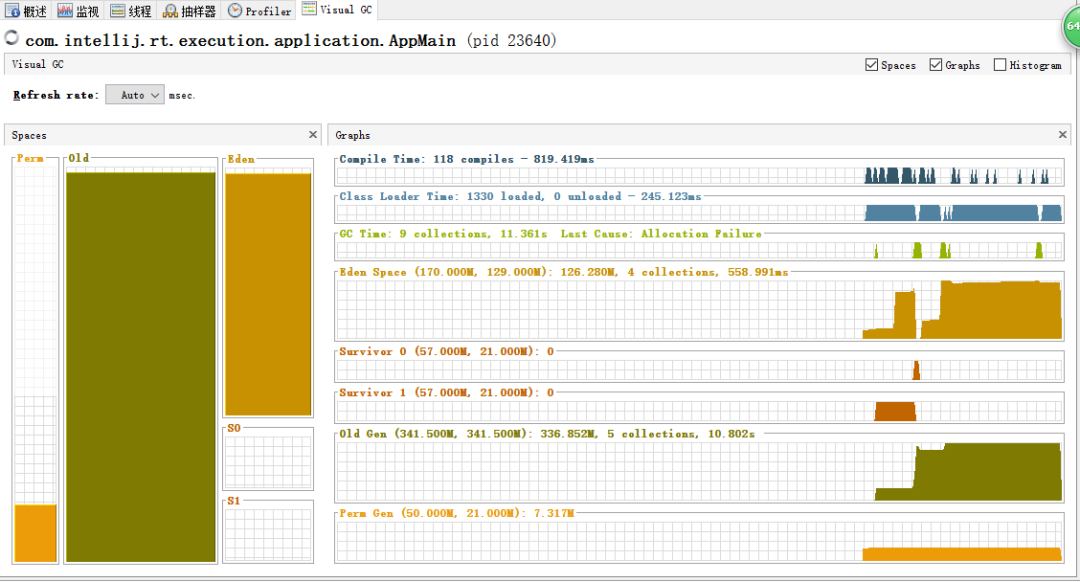
Through the comparison of two figures, it is found that:


The old generation has been gc. When the program continues to run, you can find that the old generation gc continues:

Increased to 7 times, but the memory of the older generation did not decrease. It indicates that there are objects that cannot be recycled, which may be a memory leak.
How to analyze which object leaked? Open the sampler label: click it, as shown in the figure below:
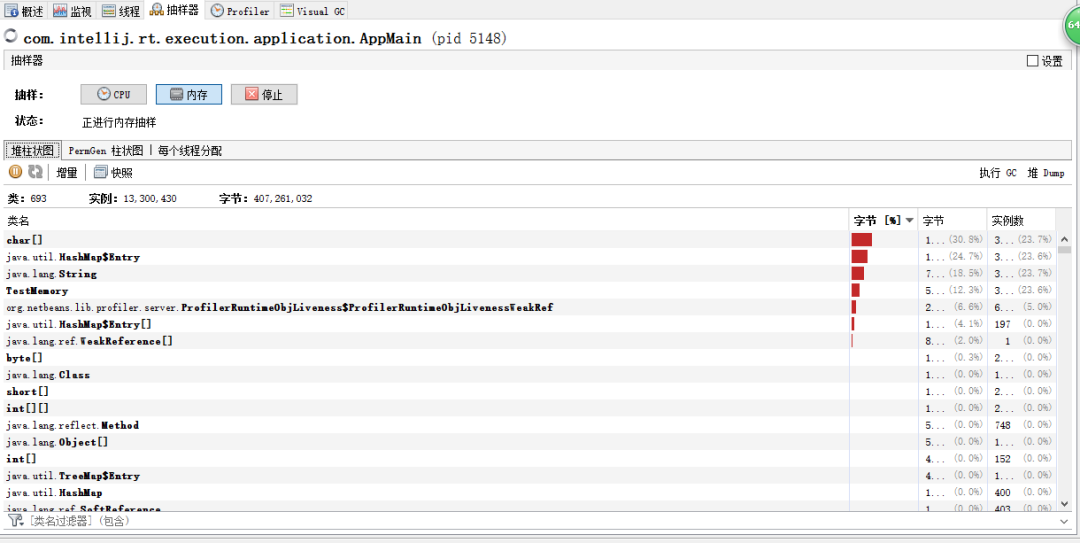
Dump the heap according to the program output. When second is output, dump once, and when forth is output, dump once.
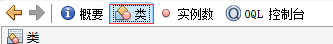
Enter the heap tab from the last dump and click class:
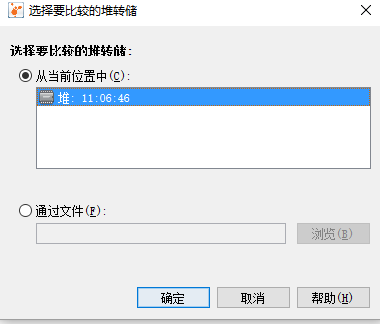
Click "compare with another heap storage" in the upper right corner. As shown in the figure, select the dump content exported for the first time to compare:
The comparison results are as follows:
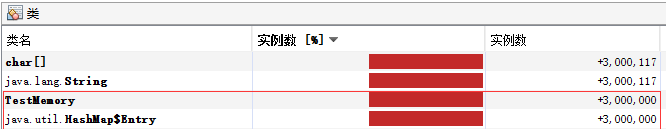
It can be seen that the number of TestMemory object instances has been increasing and increasing during the two intervals, indicating that the method referenced by the object may have a memory leak.
How to view object reference relationships?
Right click the class TestMemory and select display in instance view, as shown below:
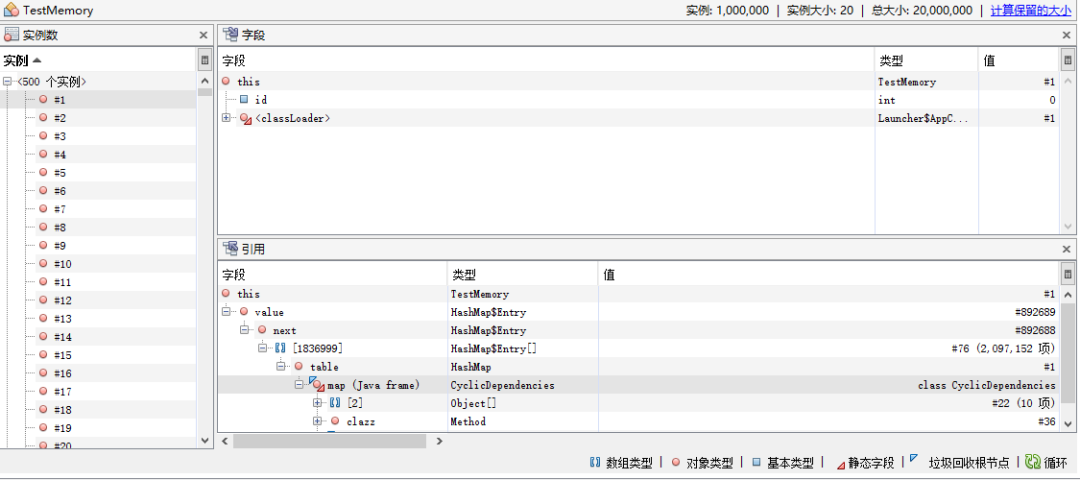
The left side is the total number of instances created, and the upper part of the right side is the structure of the instance. The following is the reference description. As can be seen from the figure, it is referenced in the class CyclicDependencies and HashMap.
In this way, the location of leakage can be determined, and then analyzed and solved according to the actual situation.
JVisualVM remote monitoring Tomcat
1. Modify Catalina of remote tomcat SH configuration file, add:
-JAVA_OPTS="$JAVA_OPTS
-Djava.rmi.server.hostname=192.168.122.128
-Dcom.sun.management.jmxremote.port=18999
-Dcom.sun.management.jmxremote.ssl=false
-Dcom.sun.management.jmxremote.authenticate=false"
Permission verification is not required for this configuration. Just open the jmx port.
Open jvisualvm, right-click remote, and select Add remote host:
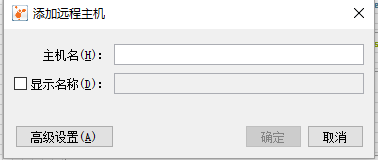
Enter the name of the host and write the ip directly as follows:
Right click the new host, select Add JMX connection, and enter the port configured in tomcat.
Double click to open. complete!
Recent hot article recommendations:
1.1000 + Java interview questions and answers (2021 latest version)
2.Finally got the IntelliJ IDEA activation code through the open source project. It's really fragrant!
3.Ali Mock tools are officially open source and kill all Mock tools on the market!
4.Spring Cloud 2020.0.0 is officially released, a new and subversive version!
5.Java development manual (Songshan version) is the latest release. Download it quickly!
Feel good, don't forget to like + forward!