At the spring new product launch of Xiaomi, Lei Jun, CEO of Xiaomi, announced that Xiaomi officially launched a new LOGO, which adopts a new super elliptical contour design to replace the original square contour

Hyperellipse is the abbreviation of hyperelliptic curve and a branch of lame curve. Lame curve was first discovered and proposed by Gabriel Lame, a French scientist. It is a closed curve similar to ellipse, which retains the characteristics of long axis, short axis and symmetry of ellipse. The mathematical equation of lame curve is as follows:
∣ x ∣ n + ∣ y ∣ n = 1 |x|^n+|y|^n=1 ∣x∣n+∣y∣n=1
When the parameter n is greater than 1, it is a hyperellipse. The shape of the hyperellipse is a shape between a regular circle and a square, and when n is less than 1, it is a star
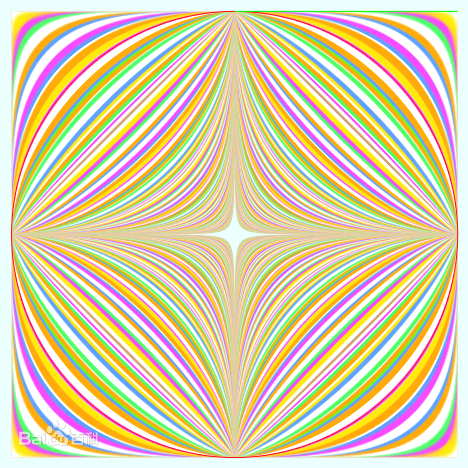
Let's do some experiments on hyperellipses, which are limited to Cartesian rectangular coordinates
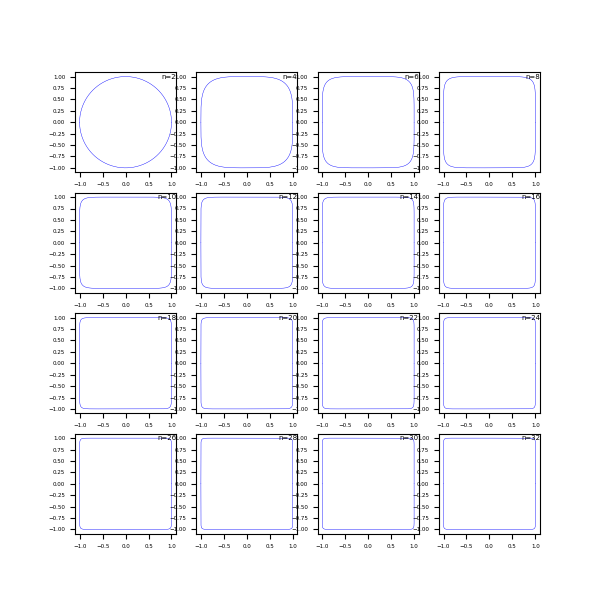
(1) n is a positive even number
When n is an even number, as n becomes larger and larger, its shape expands outward and fuller. In particular, when n=2, it is a conventional unit circle with radius of 1, and when n tends to infinity, it is a unit square with side length of 1.
# n is an even number
ns = np.arange(2, 34, step=2) #Set n value range
plt.figure(figsize=(6, 6)) #New canvas
for ind_, n in enumerate(ns):
    plt.subplot(math.isqrt(len(ns)), math.isqrt(len(ns)), ind_+1) #Subgraph of 4 * 4
    myx = np.linspace(-1, 1, 10000, endpoint = True) #Abscissa range
    myy = (1-myx**n)**(1/n) #Abscissa
    plt.plot(myx, myy, c ="blue", linewidth = 0.3)  #y positive half axis
    plt.plot(myx, -myy, c= "blue", linewidth = 0.3) #y negative half axis
    plt.title(y = 0.85, label="n="+ str(n), fontsize = 5,  loc = "right")  #title
    plt.tick_params(labelsize = 4)#Scale font size
plt.show()
The renderings are as follows
(2) n is a positive odd number
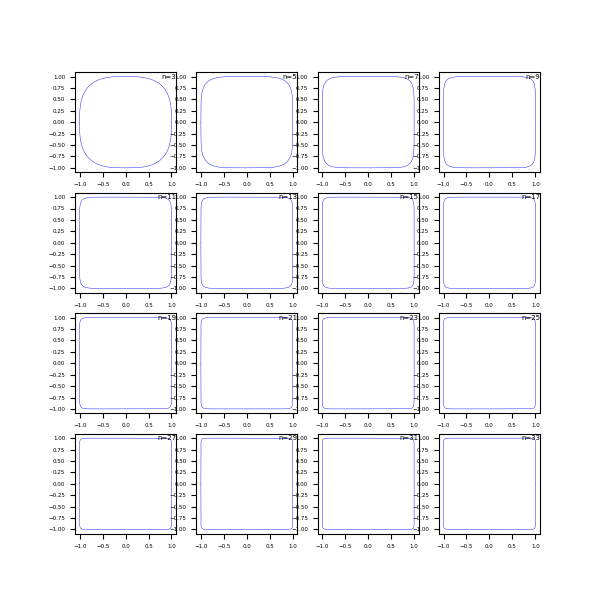
From the lame curve equation, if n is a positive odd number, there may be a complex number. Therefore, it is necessary to take the absolute value first and then square it. The shape is similar to that when n is a positive even number
# n is an odd number
ns = np.arange(3, 35, step=2) #Set n value range
plt.figure(figsize=(6, 6)) #New canvas
for ind_, n in enumerate(ns):
    plt.subplot(math.isqrt(len(ns)), math.isqrt(len(ns)), ind_+1) #Subgraph of 4 * 4
    myx = np.linspace(-1, 1, 10000, endpoint = True) #Abscissa range
    myy = (1-np.abs(myx)**n)**(1/n) #Abscissa
    plt.plot(myx, myy, c ="blue", linewidth = 0.3)  #y positive half axis
    plt.plot(myx, -myy, c= "blue", linewidth = 0.3) #y negative half axis
    plt.title(y = 0.85, label="n="+ str(n), fontsize = 5,  loc = "right")  #title
    plt.tick_params(labelsize = 4)#Scale font size
plt.show()
The renderings are as follows
(3) n is a positive integer greater than 2
Since n can take even or odd numbers, let's unify and take a positive integer greater than 2, which is similar to that n is a positive odd number
# n is a positive integer greater than 2
ns = np.arange(2, 18, step=1) #Set n value range
print(ns, len(ns), math.isqrt(len(ns)), math.isqrt(len(ns))+1 )
plt.figure(figsize=(6, 6)) #New canvas
for ind_, n in enumerate(ns):
    plt.subplot(math.isqrt(len(ns)), math.isqrt(len(ns)), ind_+1) #Subgraph of 4 * 4
    myx = np.linspace(-1, 1, 10000, endpoint = True) #Abscissa range
    myy = (1-np.abs(myx)**n)**(1/n) #Abscissa
    plt.plot(myx, myy, c ="blue", linewidth = 0.3)  #y positive half axis
    plt.plot(myx, -myy, c= "blue", linewidth = 0.3) #y negative half axis
    plt.title(y = 0.85, label="n="+ str(n), fontsize = 5,  loc = "right")  #title
    plt.tick_params(labelsize = 4)#Scale font size
plt.show()
The renderings are as follows
(4) Dynamic graph
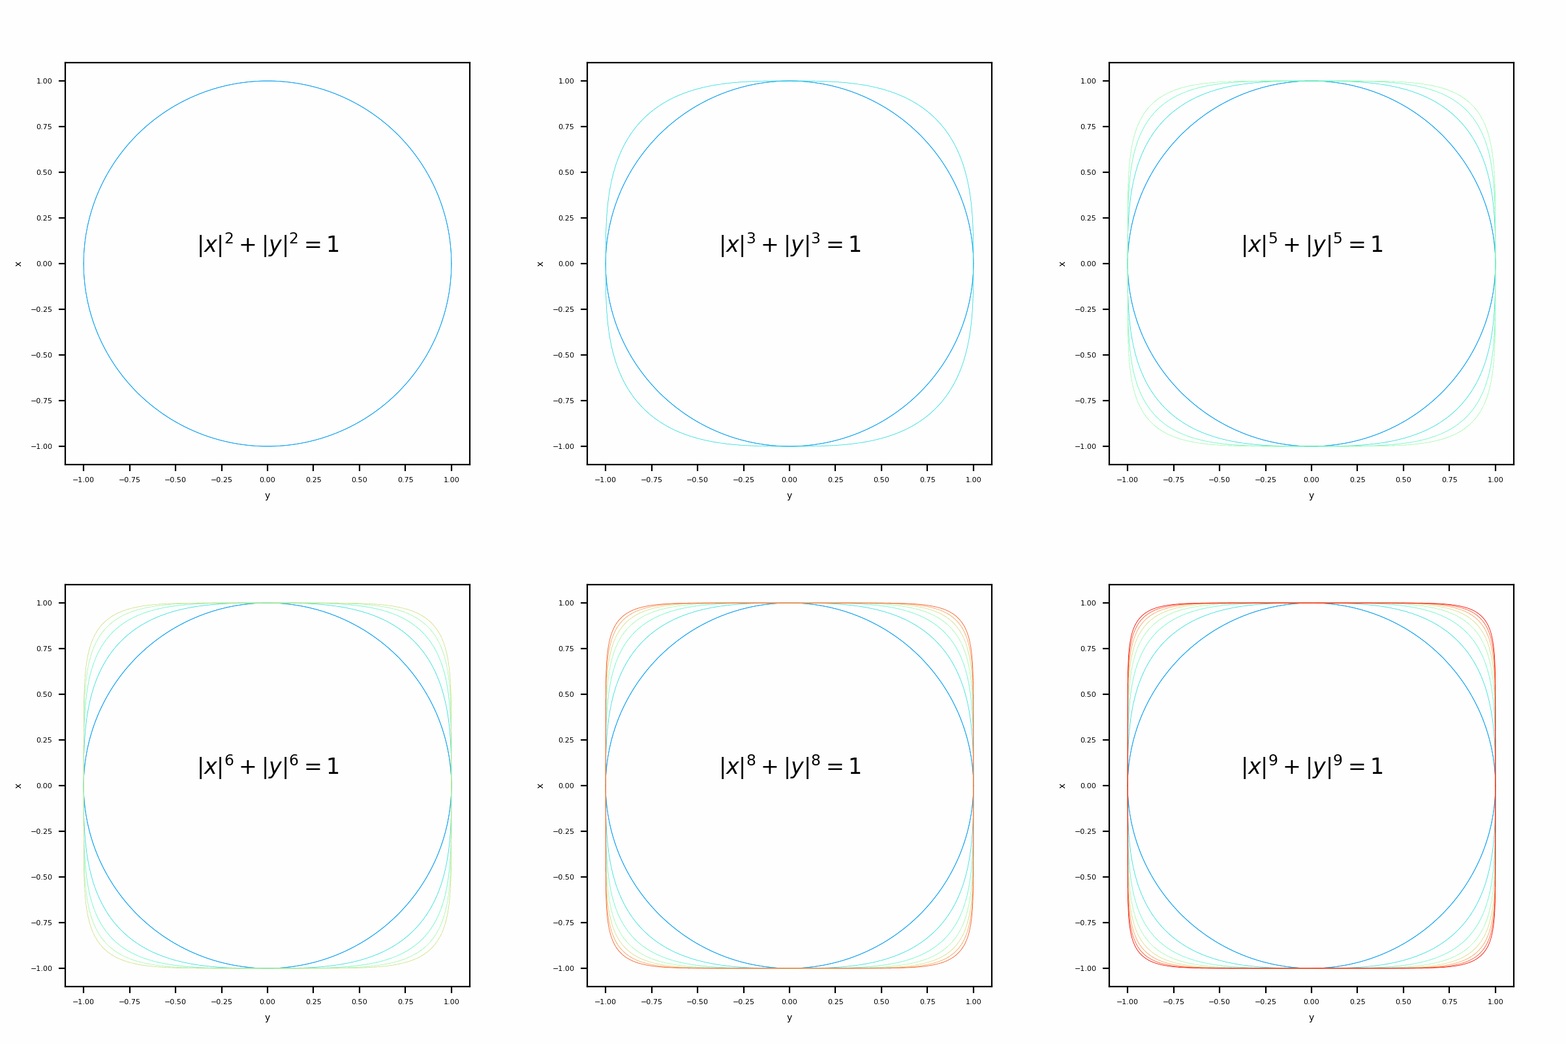
This kind of graph that changes with the change of n can be more intuitive through the display and comparison of dynamic graph
# Dynamic graph
fig = plt.figure(figsize=(4, 4)) #New canvas template
plt.ylabel('x', fontsize =5) #x-axis
plt.xlabel('y', fontsize =5) #y-axis
plt.tick_params(labelsize = 4)#Scale font size

def  chartFunc(i = int): #Define hyperelliptic curve
    colormap = cm.rainbow(np.linspace(0, 1, 10))
    myx = np.linspace(-1, 1, 10000, endpoint = True) #Abscissa range
    myy = (1-np.abs(myx)**i)**(1/i) #Abscissa
    plt.plot(myx, myy, linewidth = 0.3, color = colormap[i])  #y positive half axis
    plt.plot(myx, -myy, linewidth = 0.3, color = colormap[i]) #y negative half axis
    plt.title(y = 0.5, label = "$|x|^{}+|y|^{}=1$".format(str(i), str(i)), loc = "center")

animator = FuncAnimation(fig, chartFunc, frames = np.arange(2, 10, step=1),  interval = 500, repeat = True) #Rendering motion picture
animator.save("D:\markdown\Supporting pictures\superellipse.gif", writer="pillow") #Save as gif animation
The effect is shown in the following figure
That's all for our experiment today. If you have any questions, please leave a message!
