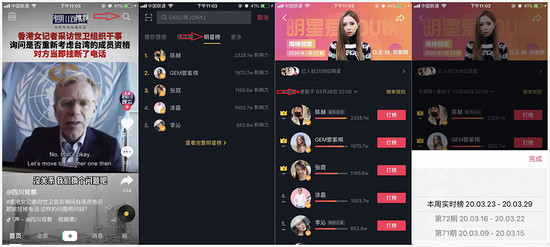
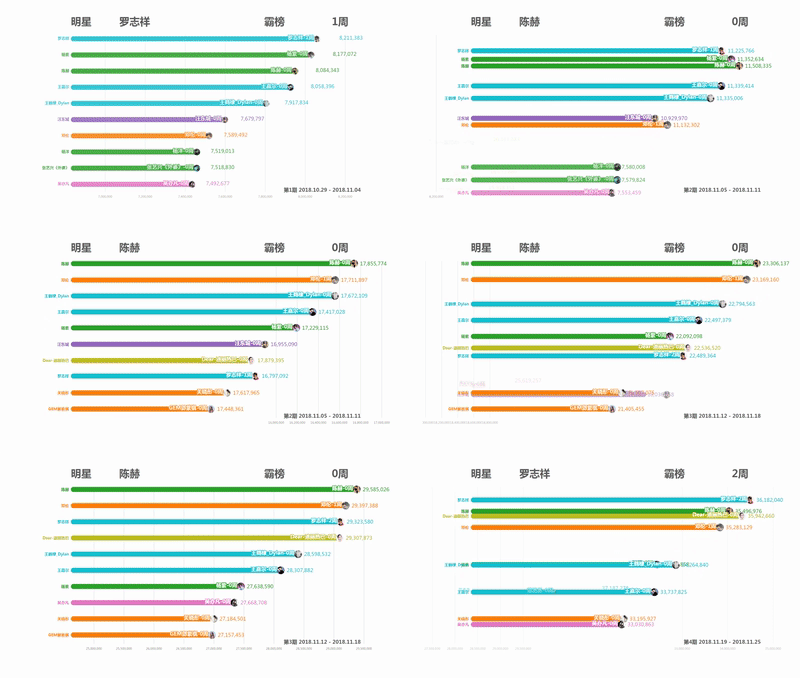
Recently, tiktok tiktok tiktok has seen all kinds of billboard data visualized video. As a technician, it is considered a very interesting way to present data. So searching the Internet for information, we found that there is a list of sound suitable for data visualization. Who is it?
objective
- Tiktok pop star list

- Data visualization shows the most popular tiktok star

Preparation
1. shaking tiktok data grab
Using the capture tool tiktok Fiddler, we analyze the request path and url for shaking the data. There are many ways to use the specific address. How Fiddler is used
The specific steps are as follows:
- Install Fiddler
- Configuration agent
- Mobile phone and computer are on the same network and use computer as agent
- Mobile phone tiktok, Fiddler intercept data
- Data needed for local analysis after data acquisition
2. Data visualization tools
Using open source tools Historical-ranking-data-visualization-based-on-d3.js Realize dynamic effect display, which can be used directly after downloading.
The specific steps are as follows:
- After configuration, config.json is clearly described in the specific configuration items. You need to test one by one
- If necessary, you can modify the stylesheet.css control style, modify the visual.js control data, and read the code yourself
- Construct csv data
- Open bargraph.html, and select the constructed data for data visualization
actual combat
After obtaining information through Fiddler, it is analyzed that two interfaces are needed to obtain data. When obtaining data of each period, the unique id of each period needs to be obtained first. After analysis, the specific operations are as follows
1. Obtain the unique identification of each cycle in all cycles
What I don't know in the learning process can add to me
python learning resource qun,855408893
//There are good learning video tutorials, development tools and e-books in the group.
//Share with you the current talent needs of python enterprises and how to learn python from scratch, and what to learn

# api: https://api3-normal-c-lf.amemv.com/aweme/v1/hotsearch/branch_billboard/weekly/list/

def get_weekly():
    """
    //Obtain all statistical cycles of the star power list through the capture tool
    :return:
    """
    billboard_weekly_list = []
    url = "https://api3-normal-c-lf.amemv.com/aweme/v1/hotsearch/branch_billboard/weekly/list/"
    result = requests.get(url)
    if result.status_code == 200:
        data = result.json()
        if data.get('status_code') == 0:
            billboard_weekly_list = data.get('billboard_weekly_list', [])
    return billboard_weekly_list
2. Get the data interface of each cycle
def get_star_billboard(edition_uid):
    """

    :param edition_uid: weekly id Get through interface
    :return:
    """
    url = f"https://api3-normal-c-lf.amemv.com/aweme/v1/hotsearch/star/billboard/?type=1&edition_uid={edition_uid}"
    result = requests.get(url)
    if result.status_code == 200:
        return result.json()
    else:
        return {}
3. Construct data according to data visualization
- Generate the configuration file config.js through mako [mainly including the information such as the head image]
- Generate the csv file needed for data visualization. Here, generate a total of all data accumulation, a weekly ranking, and calculate the total number of times each star dominates the list
def run():
    """
    1\. Tiktok downloading iDou All data in the list
    2\. according to https://github.com/Jannchie/Historical-ranking-data-visualization-based-on-d3.js build data for visualization
        1\. config.json
        2\. data.csv
    3\. Download source code, replace config.json,Import data.csv
    4\. video recording
    :return:
    """
    # User image, write config.json
    user_avatar = {}
    # Cumulative data. csv, write by, user nickname reorder
    star_total_data = {}
    # Weekly data. csv, write by, user nickname reorder
    star_week_data = {}

    # Download the iDou list of shaking tiktok, the total number of weeks.
    billboard_weekly_list = get_weekly()
    # Download data for each ranking cycle
    billboard_weekly_list = reversed(billboard_weekly_list)
    for row in billboard_weekly_list:
        start_timestamp = row['start_time']
        end_timestamp = row['end_time']
        start_date = time.strftime("%Y.%m.%d", time.localtime(start_timestamp))
        end_date = time.strftime("%Y.%m.%d", time.localtime(end_timestamp))
        edition_no = row['edition_no']
        title = f"The first{edition_no}stage {start_date} - {end_date}"
        billboard_data = get_star_billboard(row['uid'])
        user_list = billboard_data.get("user_list", [])
        for idx, user in enumerate(user_list):
            user_info = user['user_info']
            # Get the star's data this week
            user_week_data_list = star_week_data.get(user_info['nickname'], [])
            top_times = user_week_data_list[-1]['top_times'] if user_week_data_list else 0
            if idx == 0:
                # This week is top.
                top_times += 1
            user_week_data_list.append(
                {
                    "name": user_info['nickname'],
                    "type": f"{top_times}week",
                    "top_times": top_times,
                    "value": user['hot_value'],
                    "date": title
                }
            )
            star_week_data[user_info['nickname']] = user_week_data_list
            # Get the accumulated data of stars, and take the data of the last week for accumulation
            user_total_data_list = star_total_data.get(user_info['nickname'], [])
            user_total_data_list.append(
                {
                    "name": user_info['nickname'],
                    "type": f"{top_times}week",
                    "value": user['hot_value'] + user_total_data_list[-1]['value'] if user_total_data_list else user[
                        'hot_value'],
                    "date": title}
            )
            star_total_data[user_info['nickname']] = user_total_data_list

            # Write user image
            if user_info['nickname'] not in user_avatar:
                user_avatar[user_info['nickname']] = user_info['avatar_thumb']['url_list'][0]

    # Weekly data
    with open('every_weekly_data.csv', 'a', encoding='utf-8') as f:
        f.write("name,type,value,date\n")
        for users in star_week_data.values():
            for user in users:
                f.write(f"{user['name']},{user['type']},{user['value']},{user['date']}\n")

    # Cumulative data
    with open('total_data.csv', 'a', encoding='utf-8') as f:
        f.write("name,type,value,date\n")
        for users in star_total_data.values():
            for user in users:
                f.write(f"{user['name']},{user['type']},{user['value']},{user['date']}\n")

    # User image, write config.json
    imgs = ['"{}": "{}"'.format(nickname, img_url) for nickname, img_url in user_avatar.items()]
    img_str = ",".join(imgs) if imgs else ""
    config_js_to_visualization = Template(filename='base_config.mako', input_encoding='utf-8')
    with open('config.js', 'a', encoding='utf-8') as f:
        f.write(config_js_to_visualization.render(img_str=img_str))
4. Replace the configuration file and open the data file
- Replace the generated config.js file with [historical ranking data visualization based on D3. JS / SRC /]
- Open [historical ranking data visualization based on D3. JS / SRC / bargraph. HTML] and select the generated csv file to see the data visualization display