This time, we introduce two useful functions: time series complement function and abnormal contrast function.
1. Time Series Complement Point Function
-
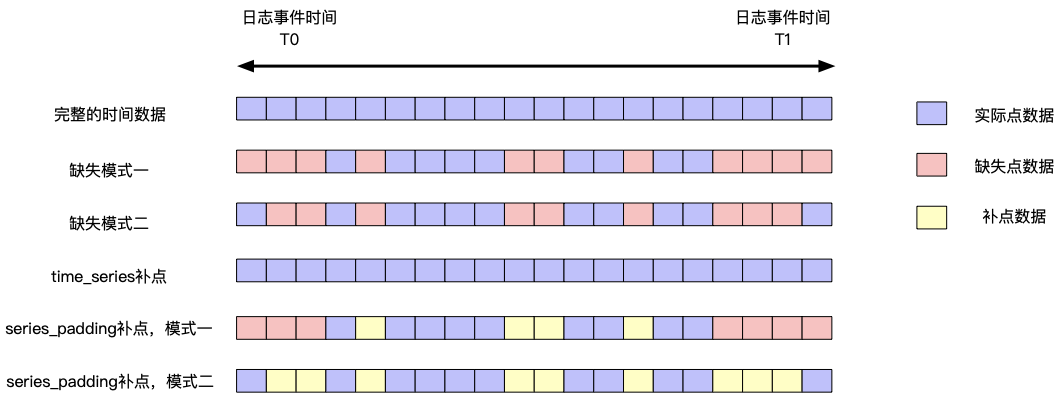
Indicator description in the chart above
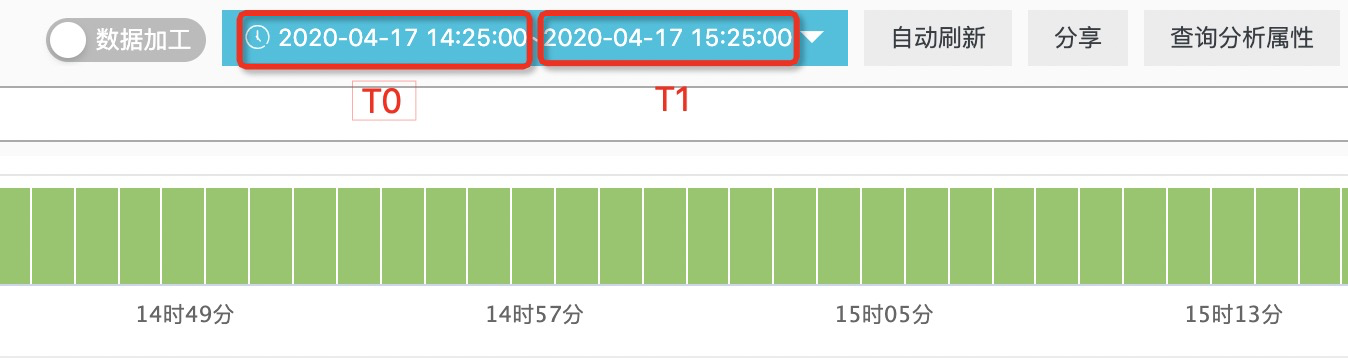
- Log Event Event T0: The earliest event a log generates
- Log Event Event T1: The latest event the log generates
- Actual point data: There is definite data at a time
- Missing point data: missing data point at a time
- Complementation data: Data that is supplemented in the execution of different algorithms
1. time_series
- Documentation for the use of functions: https://help.aliyun.com/document_detail/63451.html
- Description: This function must be used with group by time order by time, and order by does not support desc ordering
- The time frame for data completion is: the time window for user queries
2. series_padding
- Documentation for the use of functions: https://help.aliyun.com/document_detail/160983.html
- Description: The function is to complement missing internal point data with a certain strategy; supports group by mode
2. Version Comparison Function
- Document address: https://help.aliyun.com/document_detail/160982.html
2. Use scenarios
2.1 A service upgrade
- This scenario can be summarized as a single observation object, comparing the abnormal changes of an observation index before and after upgrade
- The data you need to provide is as follows:
- Time Series Observations of an Indicator
- Point in time when a service changes
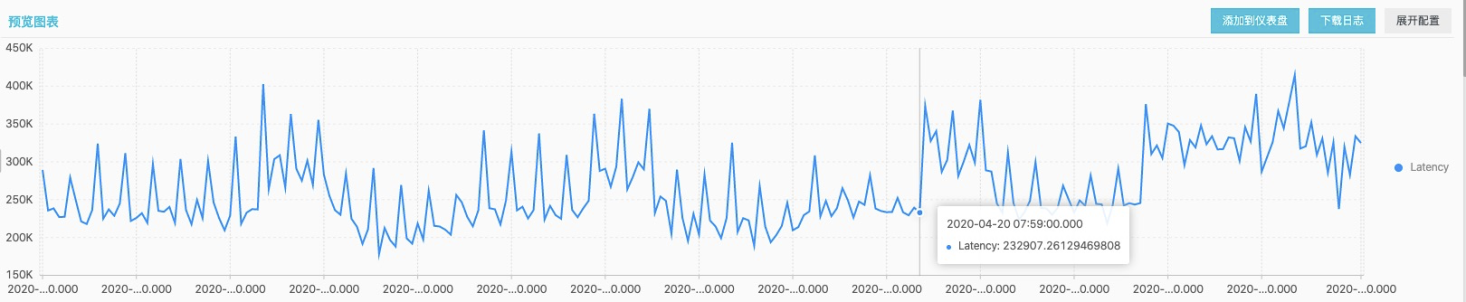
Examples are as follows: a service complex made a change in a cluster, the change time is 2020-04-2007:59:00. After this time point, we found that the request delay of the cluster increased a lot, and the related R&D classmates may need to deal with it urgently.Then is there a way to automatically help me identify whether the observed object's index changes before and after the change through a function?
- First, the observation data is sorted out by SQL, and the set number of outliers is observed.
* |
SELECT date_trunc('minute', __time__ - __time__ % 60) AS TIME,
       avg(Latency) AS Latency
FROM log
GROUP BY TIME
ORDER BY TIME
LIMIT 10000
We use the corresponding function to detect:
* |
SELECT anomaly_compare(TIME, array[ Latency ], 1587340740, 60)
FROM
  (SELECT __time__ - __time__ % 60 AS TIME,
          avg(Latency) / 1000.0 AS Latency
   FROM log
   GROUP BY TIME
   ORDER BY TIME)
{
  "results": [{
    "attribute": "column_0",
    "score": 0.9999840724556095,
    "details": {
      "left": [{
        "key": "mean",
        "value": 248.79610181477835
      }, {
        "key": "std",
        "value": 41.9981113960846
      }, {
        "key": "median",
        "value": 236.34852017385737
      }, {
        "key": "variance",
        "value": 1763.8413608379317
      }],
      "right": [{
        "key": "mean",
        "value": 294.9041720361495
      }, {
        "key": "std",
        "value": 47.074409675083004
      }, {
        "key": "median",
        "value": 299.6439639513877
      }, {
        "key": "variance",
        "value": 2216.0000462575485
      }]
    }
  }]
}
2.2 Grayscale Publishing Upgrade
- This scenario can be summarized as observing abnormal differences between grayscale objects when serving in a cluster
-
The data you need to provide is as follows:
- Label field that can indicate the release status of a specific machine
- Same Observation Indicator
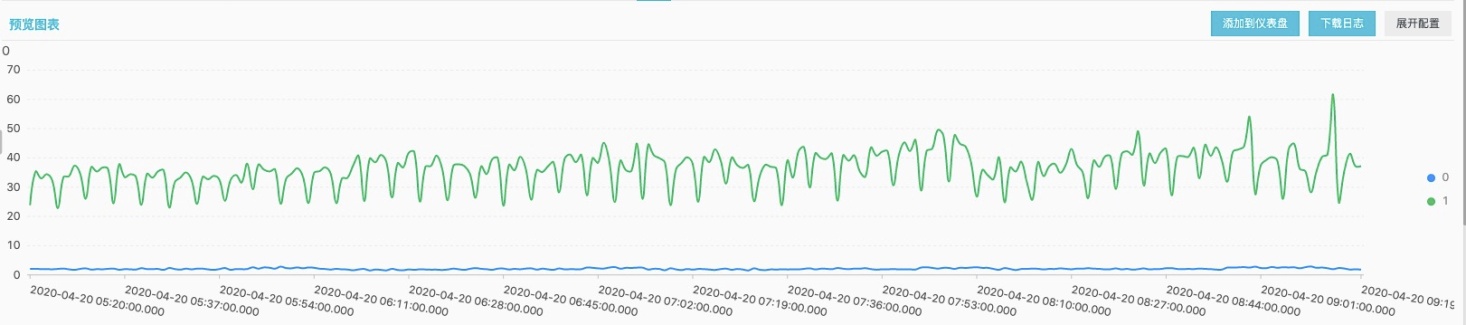
Examples are as follows: When a basic storage service upgrades a version, it often performs a step-by-step grayscale operation. After selecting several machines, it first performs grayscale operation, then observes and publishes the upgrade as a whole. Before doing this, it is necessary to make relevant judgments on the indicator status of the publishing machine to determine whether it meets the expectations?Are there any significant differences in the indicators from other machines of the same service?Or is there a significant performance improvement on this version online?
At this time, we convert the problem into a comparison problem between the same observation index data among some observation objects.
- For this scenario, we want the data to be up to par (here I simulate a labeling scenario where the label is determined by the size of the request delay)
* |
SELECT date_trunc('minute', __time__ - __time__ % 60) AS TIME,
       avg(Latency) / 100000.0 AS Latency,
       label
FROM
  (SELECT __time__,
          Latency,
          CASE
              WHEN Latency > 1500000.0 THEN 1
              ELSE 0
          END AS label
   FROM log)
GROUP BY TIME,
         label
ORDER BY TIME
LIMIT 10000
* |
SELECT anomaly_compare(TIME, array[ Latency ], array[ 'Latency' ], label)
FROM
  (SELECT __time__ - __time__ % 60 AS TIME,
          avg(Latency) / 100000.0 AS Latency,
          label
   FROM
     (SELECT __time__,
             Latency,
             CASE
                 WHEN Latency > 1500000.0 THEN 1
                 ELSE 0
             END AS label
      FROM log)
   GROUP BY TIME,
            label
   ORDER BY TIME)
{
  "results": [{
    "attribute": "Latency",
    "score": 0.981385450748068,
    "details": {
      "left": [{
        "key": "mean",
        "value": 2.083975172731342
      }, {
        "key": "std",
        "value": 0.26912348059219504
      }, {
        "key": "median",
        "value": 2.0386681871982004
      }, {
        "key": "variance",
        "value": 0.07242744780605757
      }],
      "right": [{
        "key": "mean",
        "value": 36.19678922429
      }, {
        "key": "std",
        "value": 6.139164754357247
      }, {
        "key": "median",
        "value": 37.03196953882403
      }, {
        "key": "variance",
        "value": 37.68934388114228
      }]
    }
  }]
}