top command of linux related commands
One of the things the backend people fear most is the sudden surge in server load, which may mean that eye-catching calls are coming soon. What to do in this case? The first reaction must be to log in to the server and click a top command to see Load Average. Today's article tells you how to look at this "Load Average".
Load Average
Many people are right to say that the Load Average indicator can indicate that the system load is high. So where is the pressure? How are these three values calculated? Maybe many people can't say it at once.
Let's start with the definition: * * the sum of the number of processes that the CPU is processing and waiting for the CPU to process over a period of time** The three figures represent the statistical values of 1 minute, 5 minutes and 15 minutes respectively.
Therefore, this value can really reflect the load of the server. However, this high value does not directly represent the performance problem of the machine. It may be because CPU intensive computing is in progress, or it may be because the operation queue is blocked due to I/O problems. Therefore, when we see this value soaring, we have to analyze specific problems. Upgrading the machine directly is simple and crude, but it can cure the symptoms rather than the root cause.
The top command looks line by line
The top command outputs a lot of parameters. We need to look at the real server load by combining other parameters.
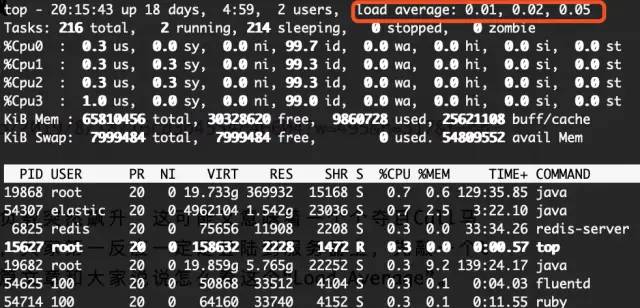
First line:
top - 20:41:08 up 18 days,  5:24,  2 users,  load average: 0.04, 0.03, 0.05

top: current time  up: How long has the machine been running
users: How many users are there currently
load average: They are the loads in the past 1 minute, 5 minutes and 15 minutes respectively
The three values of load average should be paid attention to. As we all know, a CPU can only run one process in a time slice. The number of CPU cores directly affects the number of processes that the machine can run at the same time. Therefore, generally speaking, the value of load average should not exceed the total number of cores of this machine, which is basically no problem.
Second line:
Tasks: 216 total,   1 running, 215 sleeping,   0 stopped,   0 zombie
Tasks: How many processes are there currently
running: Running process
sleeping: Dormant process
stopped: Stopped process
zombie: Zombie process
The more running, the greater the natural pressure on the server.
Third line:
%Cpu(s):  0.2 us,  0.1 sy,  0.0 ni, 99.8 id,  0.0 wa,  0.0 hi,  0.0 si,  0.0 st

us: User process percentage CPU Utilization rate of
sy: System process CPU Utilization rate of
ni: User process space changed priority
id: free CPU Occupancy rate
wa: Waiting for input and output CPU Time percentage
hi: Hardware interrupt request
si: Software interrupt request
st: steal time
This line represents the CPU usage, which is too high for a long time, indicating that the user process takes up a lot of CPU time. If us+sy exceeds 80 or 90 for a long time, it may represent insufficient CPU performance and need to add CPU.
Line 4 & Line 5
KiB Mem : 65810456 total, 30324416 free,  9862224 used, 25623816 buff/cache
KiB Swap:  7999484 total,  7999484 free,        0 used. 54807988 avail Mem

total: Total memory
free: idle memory
used: Used
buffer/cache: Write cache/Read cache
The fourth and fifth lines are memory information and swap information respectively. All programs run in memory, so the performance of memory is very important to the server. However, when the free memory becomes less, we don't need to be too nervous. What you really need to see is the used information in swap. Swap partition is a swap area provided by the hard disk. When the physical memory is not enough, the operating system will put the temporarily unused data into swap. So when this value becomes high, it means that there is really not enough memory.
Line 5 down
  PID USER      PR  NI    VIRT    RES    SHR S  %CPU %MEM     TIME+ COMMAND
19868 root      20   0 19.733g 369980  15180 S   0.7  0.6 129:53.91 java
19682 root      20   0 19.859g 5.766g  22252 S   0.3  9.2 139:42.81 java
54625 100       20   0   50868  33512   4104 S   0.3  0.1   0:04.68 fluentd

PID:process id
USER:Process owner
PR:Priority. The higher the value, the higher the priority
NI:nice A negative value indicates high priority and a positive value indicates low priority
VIRT:The total amount of virtual memory used by the process
SWAP:The size of the virtual memory used by the process that was swapped out
RES:The amount of physical memory used by the process that has not been swapped out
SHR:Shared memory size
SHR:Shared memory size
S: Process status. D Indicates an uninterrupted sleep state; R Indicates operation; S Indicates sleep; T Represents tracking/stop it; Z Represents a zombie process.
%CPU:From last update to now CPU Percentage occupied;
%MEM:Percentage of physical memory used by the process;
TIME+:Used by the process CPU Total time, unit 1/100 Second;
COMMAND:Command name/command line
These are the process information, from which you can see the overview of which processes occupy system resources.
Other commands
top is, of course, our most common command to view system status. There are many other commands. vmstat, w, uptime, iostat are commonly used commands.