Canary deployment
What is Canary deployment? Also known as "gray deployment", generally speaking, when the original version is available, a new version of the application is deployed as a "Canary" to test the performance and performance of the new version, and find and adjust it as soon as possible on the premise of ensuring the stability of the overall system.
Canary deployment is not a black and white deployment method. It can slowly guide a specific percentage of traffic to a small number of users. If there is no problem after verification, it can be extended to all users, and the old version will be phased out to reduce the risk caused by the introduction of new functions in the production environment. For Canary deployment workflow, it often mainly involves the following stages:
Step 1: remove the traffic from the node to be deployed and update the node service to the status to be published. At this time, the node is called "Canary node".
Step 2: introduce traffic to Canary nodes according to different scenario strategies. The traffic introduction strategy can be determined according to the actual business scenario, for example, random sample strategy (random introduction), dog food strategy (i.e. internal users or employees try first), regional strategy (users in different regions use different versions) and user characteristic strategy (this is complex and needs to be shunted according to the user's personal data and characteristics).
Step 3: after the Canary node is verified, select more nodes as Canary nodes, and then repeat steps 1 and 2 until all nodes are updated to the latest state.
In this article, the author will choose the combination of traifik and flag to explore some potential possibilities of applications / services when publishing new versions.
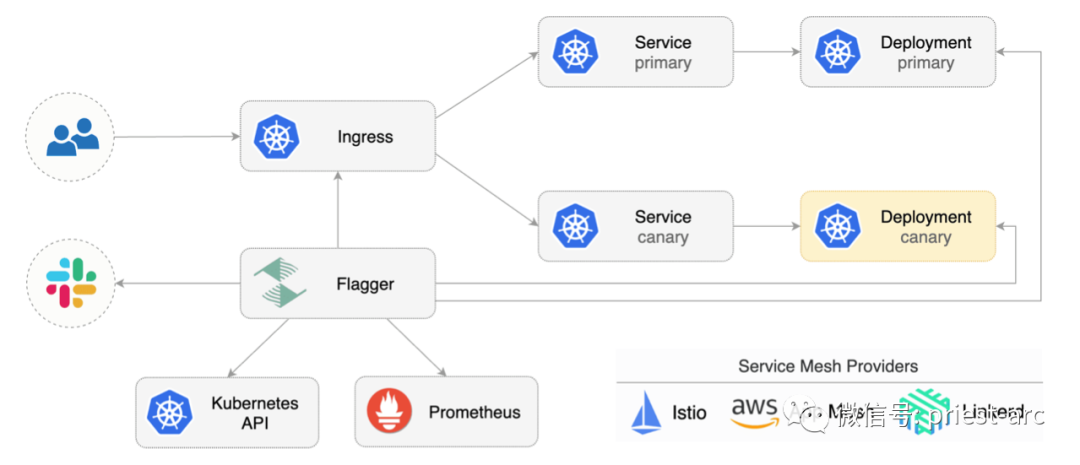
Let's first introduce flag, a cloud native Computing Foundation project, which is part of the Flux series of GitOps tools. As a progressive delivery tool, Flagger automates the release process of applications running on Kubernetes. It reduces the risk of introducing new software versions in production by gradually transferring traffic to new versions while measuring indicators and running consistency tests.
Flagger can run automated application analysis, upgrade, and rollback for the following deployment policies:
- Canary (progressive flow transfer)
- A/B test (HTTP header and cookie traffic routing)
- Blue / green (flow switch or mirror)
For Canary deployment and A/B testing, we need a layer 7 traffic management solution, such as service grid (Istio, Linkerd, App Mesh) or portal controller (Contour, NGINX, Gloo). For blue / Green deployment, no service grid or portal controller is required.
Flagger uses service grid (App Mesh, Istio, Linkerd, Open Service Mesh) or portal controller (Contour, Gloo, NGINX, Skipper, traifik) to implement a variety of deployment strategies (Canary release, A/B test, blue / green image) for traffic routing. For publishing analysis, flagger can query Prometheus, Datadog, New Relic, CloudWatch or Graphite, and use Slack, MS Teams, Discord and Rocket to alert.
Flagger can be configured using Kubernetes custom resources and is compatible with any CI/CD solution created for Kubernetes. Because flag is declarative and responds to Kubernetes events, it can be used in GitOps pipeline together with tools such as Flux, Jenkins x, marvel, Argo, etc.
In addition, Flagger will also track the ConfigMap and Secrets referenced by Kubernetes deployment, and trigger Canary analysis when any of these objects changes. When the workload is raised in production, the code (container image) and configuration (configuration mapping and secret) are synchronized.
Precondition: Flagger needs to rely on Kubernetes cluster v1 16 or later and traifik v2 3 or later.
Next, we deploy traifik with Helm (v3 version here), as shown below:
[administrator@JavaLangOutOfMemory ~ ] % helm repo add traefik https://helm.traefik.io/traefik
[administrator@JavaLangOutOfMemory ~ ] % kubectl create ns traefik

[administrator@JavaLangOutOfMemory ~ ] % cat <<EOF | helm upgrade -i traefik traefik/traefik --namespace traefik -f -
deployment:
  podAnnotations:
    prometheus.io/port: "9100"
    prometheus.io/scrape: "true"
    prometheus.io/path: "/metrics"
metrics:
  prometheus:
    entryPoint: metrics
EOF
Install support components such as flag and Prometheus in the same namespace as Traefik, as shown below:
[administrator@JavaLangOutOfMemory ~ ]% helm repo add flagger https://flagger.app

[administrator@JavaLangOutOfMemory ~ ]% helm upgrade -i flagger flagger/flagger \
--namespace traefik \
--set prometheus.install=true \
--set meshProvider=traefik
Flagger uses Kubernetes deployment and optional horizontal Pod auto Scaler (HPA), and then creates a series of objects (Kubernetes deployment, ClusterIP service and traifikservice). These objects expose applications outside the cluster and drive Canary analysis and promotion.
Next, let's create a namespace for the test, as shown below:
[administrator@JavaLangOutOfMemory ~ ]% kubectl create ns test
[administrator@JavaLangOutOfMemory ~ ]% kubectl apply -k https://github.com/fluxcd/flagger//kustomize/podinfo?ref=main
Then, deploy the load test service to generate traffic during Canary analysis:
[administrator@JavaLangOutOfMemory ~ ]% helm upgrade -i flagger-loadtester flagger/loadtester \
--namespace=test
Create a traifik ingresroute that references the traifikservice generated by the flag (replace app.example.com with its own domain), and its Demo file is as follows:
apiVersion: traefik.containo.us/v1alpha1
kind: IngressRoute
metadata:
  name: podinfo
  namespace: test
spec:
  entryPoints:
    - web
  routes:
    - match: Host(`app.example.com`)
      kind: Rule
      services:
        - name: podinfo
          kind: TraefikService
          port: 80
Save the above resources as podinfo ingressroute Yaml then performs resource configuration as follows:
[administrator@JavaLangOutOfMemory ~ ]% kubectl apply -f ./podinfo-ingressroute.yaml
Here, we create Canary custom resources (replace app.example.com with our own domain), as shown below:
apiVersion: flagger.app/v1beta1
kind: Canary
metadata:
  name: podinfo
  namespace: test
spec:
  provider: traefik
  # deployment reference
  targetRef:
    apiVersion: apps/v1
    kind: Deployment
    name: podinfo
  # HPA reference (optional)
  autoscalerRef:
    apiVersion: autoscaling/v2beta2
    kind: HorizontalPodAutoscaler
    name: podinfo
  # the maximum time in seconds for the canary deployment
  # to make progress before it is rollback (default 600s)
  progressDeadlineSeconds: 60
  service:
    # ClusterIP port number
    port: 80
    # container port number or name
    targetPort: 9898
  analysis:
    # schedule interval (default 60s)
    interval: 10s
    # max number of failed metric checks before rollback
    threshold: 10
    # max traffic percentage routed to canary
    # percentage (0-100)
    maxWeight: 50
    # canary increment step
    # percentage (0-100)
    stepWeight: 5
    # Traefik Prometheus checks
    metrics:
    - name: request-success-rate
      interval: 1m
      # minimum req success rate (non 5xx responses)
      # percentage (0-100)
      thresholdRange:
        min: 99
    - name: request-duration
      interval: 1m
      # maximum req duration P99
      # milliseconds
      thresholdRange:
        max: 500
    webhooks:
      - name: acceptance-test
        type: pre-rollout
        url: http://flagger-loadtester.test/
        timeout: 10s
        metadata:
          type: bash
          cmd: "curl -sd 'test' http://podinfo-canary.test/token | grep token"
      - name: load-test
        type: rollout
        url: http://flagger-loadtester.test/
        timeout: 5s
        metadata:
          type: cmd
          cmd: "hey -z 10m -q 10 -c 2 -host app.example.com http://traefik.traefik"
          logCmdOutput: "true"
[administrator@JavaLangOutOfMemory ~ ]% kubectl apply -f ./podinfo-canary.yaml
After a few seconds, flag will create the Canary object:
# applied
deployment.apps/podinfo
horizontalpodautoscaler.autoscaling/podinfo
canary.flagger.app/podinfo

# generated
deployment.apps/podinfo-primary
horizontalpodautoscaler.autoscaling/podinfo-primary
service/podinfo
service/podinfo-canary
service/podinfo-primary
traefikservice.traefik.containo.us/podinfo
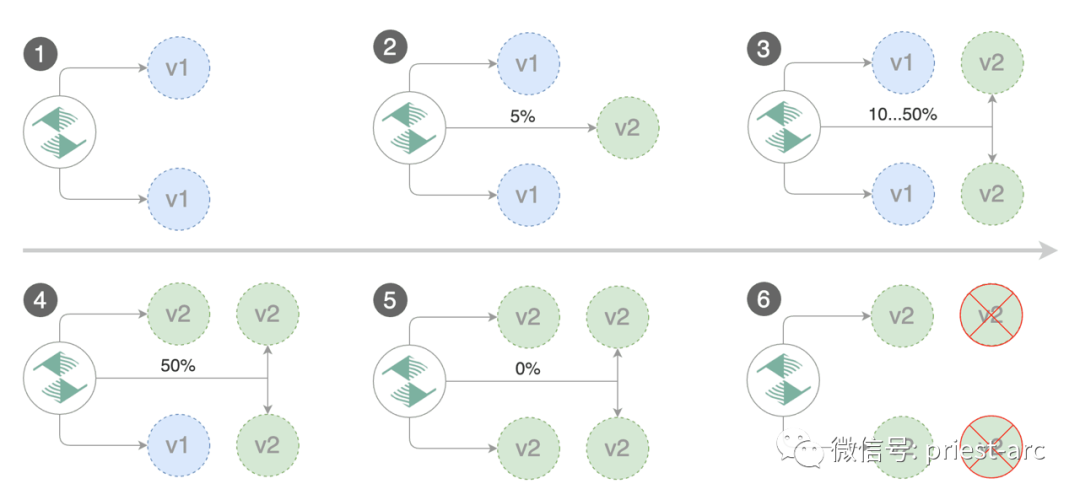
Flag implements a control loop to gradually transfer traffic to Canary while measuring key performance indicators such as HTTP request success rate, average request duration and Pod health. According to the analysis of relevant indicators, release or suspend Canary deployment, and publish the analysis results to relevant platforms.
The Canary deployment is triggered by updating the container image. The specific operation method is as follows:
[administrator@JavaLangOutOfMemory ~ ]% kubectl -n test set image deployment/podinfo \
podinfod=stefanprodan/podinfo:4.0.6
Flagger detected that the deployment content has changed and started a new deployment:
[administrator@JavaLangOutOfMemory ~ ]% kubectl -n test describe canary/podinfo

Status:
  Canary Weight:         0
  Failed Checks:         0
  Phase:                 Succeeded
Events:
 New revision detected! Scaling up podinfo.test
 Waiting for podinfo.test rollout to finish: 0 of 1 updated replicas are available
 Pre-rollout check acceptance-test passed
 Advance podinfo.test canary weight 5
 Advance podinfo.test canary weight 10
 Advance podinfo.test canary weight 15
 Advance podinfo.test canary weight 20
 Advance podinfo.test canary weight 25
 Advance podinfo.test canary weight 30
 Advance podinfo.test canary weight 35
 Advance podinfo.test canary weight 40
 Advance podinfo.test canary weight 45
 Advance podinfo.test canary weight 50
 Copying podinfo.test template spec to podinfo-primary.test
 Waiting for podinfo-primary.test rollout to finish: 1 of 2 updated replicas are available
 Routing all traffic to primary
 Promotion completed! Scaling down podinfo.test
Note: if new changes are applied to the deployment during Canary analysis, flag will restart the analysis.
We can monitor all Canary deployment information in the following ways:
[administrator@JavaLangOutOfMemory ~ ]% watch kubectl get canaries --all-namespaces

NAMESPACE   NAME        STATUS        WEIGHT   LASTTRANSITIONTIME
test        podinfo-2   Progressing   30       2020-08-14T12:32:12Z
test        podinfo     Succeeded     0        2020-08-14T11:23:88Z
Above, we briefly introduced the theoretical basis of Canary release. Next, let's take a look at the automatic rollback based on this scenario.
During Canary analysis, we can generate HTTP 500 errors to test whether flag pauses and rolls back the failed version.
At this time, we will deploy another canary. The specific operations are as follows:
[administrator@JavaLangOutOfMemory ~ ]% kubectl -n test set image deployment/podinfo \
podinfod=stefanprodan/podinfo:4.0.6
Enter the Pod and execute relevant commands. The specific operations are as follows:
[administrator@JavaLangOutOfMemory ~ ]% kubectl -n test exec -it deploy/flagger-loadtester bash
[administrator@JavaLangOutOfMemory ~ ]% hey -z 1m -c 5 -q 5 http://app.example.com/status/500
[administrator@JavaLangOutOfMemory ~ ]% watch -n 1 curl http://app.example.com/delay/1
When the number of failed checks reaches the threshold set by Canary analysis, the traffic will be routed back to the primary node, Canary will scale to zero, and the push will be marked as failed.
[administrator@JavaLangOutOfMemory ~ ]% kubectl -n traefik logs deploy/flagger -f | jq .msg

New revision detected! Scaling up podinfo.test
Canary deployment podinfo.test not ready: waiting for rollout to finish: 0 of 1 updated replicas are available
Starting canary analysis for podinfo.test
Pre-rollout check acceptance-test passed
Advance podinfo.test canary weight 5
Advance podinfo.test canary weight 10
Advance podinfo.test canary weight 15
Advance podinfo.test canary weight 20
Halt podinfo.test advancement success rate 53.42% < 99%
Halt podinfo.test advancement success rate 53.19% < 99%
Halt podinfo.test advancement success rate 48.05% < 99%
Rolling back podinfo.test failed checks threshold reached 3
Canary failed! Scaling down podinfo.test
Canary analysis can be extended through Prometheus queries. We create an indicator template and apply it to the cluster, as shown below:
apiVersion: flagger.app/v1beta1
kind: MetricTemplate
metadata:
  name: not-found-percentage
  namespace: test
spec:
  provider:
    type: prometheus
    address: http://flagger-prometheus.traefik:9090
  query: |
    sum(
      rate(
        traefik_service_request_duration_seconds_bucket{
          service=~"{{ namespace }}-{{ target }}-canary-[0-9a-zA-Z-]+@kubernetescrd",
          code!="404",
        }[{{ interval }}]
      )
    )
    /
    sum(
      rate(
        traefik_service_request_duration_seconds_bucket{
          service=~"{{ namespace }}-{{ target }}-canary-[0-9a-zA-Z-]+@kubernetescrd",
        }[{{ interval }}]
      )
    ) * 100
Edit Canary analysis and add not found error rate check:
  analysis:
    metrics:
      - name: "404s percentage"
        templateRef:
          name: not-found-percentage
        thresholdRange:
          max: 5
        interval: 1m
The above configuration verifies the Canary by checking whether the HTTP 404 req/sec percentage is less than 5% of the total traffic. If the 404s rate reaches the 5% threshold, the Canary fails. The Canary deployment is triggered by updating the container image, as shown below:
[administrator@JavaLangOutOfMemory ~ ]% kubectl -n test set image deployment/podinfo \
podinfod=stefanprodan/podinfo:4.0.6
Commands related to HTTP 500 error generation and delay generation are as follows:
[administrator@JavaLangOutOfMemory ~ ]%hey -z 1m -c 5 -q 5 http://app.example.com/status/500
[administrator@JavaLangOutOfMemory ~ ]% watch curl http://app.example.com/status/400
[administrator@JavaLangOutOfMemory ~ ]% kubectl -n traefik logs deployment/flagger -f | jq .msg

Starting canary deployment for podinfo.test
Advance podinfo.test canary weight 5
Advance podinfo.test canary weight 10
Advance podinfo.test canary weight 15
Halt podinfo.test advancement 404s percentage 6.20 > 5
Halt podinfo.test advancement 404s percentage 6.45 > 5
Halt podinfo.test advancement 404s percentage 7.60 > 5
Halt podinfo.test advancement 404s percentage 8.69 > 5
Halt podinfo.test advancement 404s percentage 9.70 > 5
Rolling back podinfo.test failed checks threshold reached 5
Canary failed! Scaling down podinfo.test
If the alarm function is configured, the Flagger will send a notification describing the specific reason for the Canary failure. The above is the details of relevant contents. For the in-depth analysis of flag technology, if you are interested, you can read the official documents of flag for more detailed answers.
reference material
- https://github.com/fluxcd/flagger
- https://xie.infoq.cn/article/cb4c23379a9e2d2b07c4a61fe