Online troubleshooting of java processes occupying too much cpu
1, Create a springBoot project
The new project needs to introduce web dependency support, which is convenient for us to call through http
pom. The XML file is as follows:
<?xml version="1.0" encoding="UTF-8"?>
<project xmlns="http://maven.apache.org/POM/4.0.0" xmlns:xsi="http://www.w3.org/2001/XMLSchema-instance"
         xsi:schemaLocation="http://maven.apache.org/POM/4.0.0 https://maven.apache.org/xsd/maven-4.0.0.xsd">
    <modelVersion>4.0.0</modelVersion>
    <parent>
        <groupId>org.springframework.boot</groupId>
        <artifactId>spring-boot-starter-parent</artifactId>
        <version>2.5.2</version>
        <relativePath/> <!-- lookup parent from repository -->
    </parent>
    <groupId>com.javapc</groupId>
    <artifactId>demo</artifactId>
    <version>0.0.1-SNAPSHOT</version>
    <name>javapc</name>
    <description>Demo project for Spring Boot</description>
    <properties>
        <java.version>1.8</java.version>
    </properties>
    <dependencies>
        <dependency>
            <groupId>org.springframework.boot</groupId>
            <artifactId>spring-boot-starter</artifactId>
        </dependency>

        <dependency>
            <groupId>org.springframework.boot</groupId>
            <artifactId>spring-boot-starter-test</artifactId>
            <scope>test</scope>
        </dependency>
        <!-- introduce web rely on -->
<!--        <dependency>-->
<!--            <groupId>org.springframework.boot</groupId>-->
<!--            <artifactId>spring-boot-starter-web</artifactId>-->
<!--        </dependency>-->
    </dependencies>

    <build>
        <plugins>
            <!-- springboot Package plug-ins -->
            <plugin>
                <groupId>org.springframework.boot</groupId>
                <artifactId>spring-boot-maven-plugin</artifactId>
                <configuration>
                    <mainClass>com.javapc.demo.JavapcApplication</mainClass>
                    <!-- <skip>true</skip> -->
                </configuration>
                <executions>
                    <execution>
                        <goals>
                            <goal>repackage</goal>
                        </goals>
                    </execution>
                </executions>
            </plugin>
        </plugins>
    </build>

</project>
Modify startup class
package com.javapc.demo;

import org.springframework.boot.SpringApplication;
import org.springframework.boot.autoconfigure.SpringBootApplication;

@SpringBootApplication
public class JavapcApplication {

    public static void main(String[] args) {
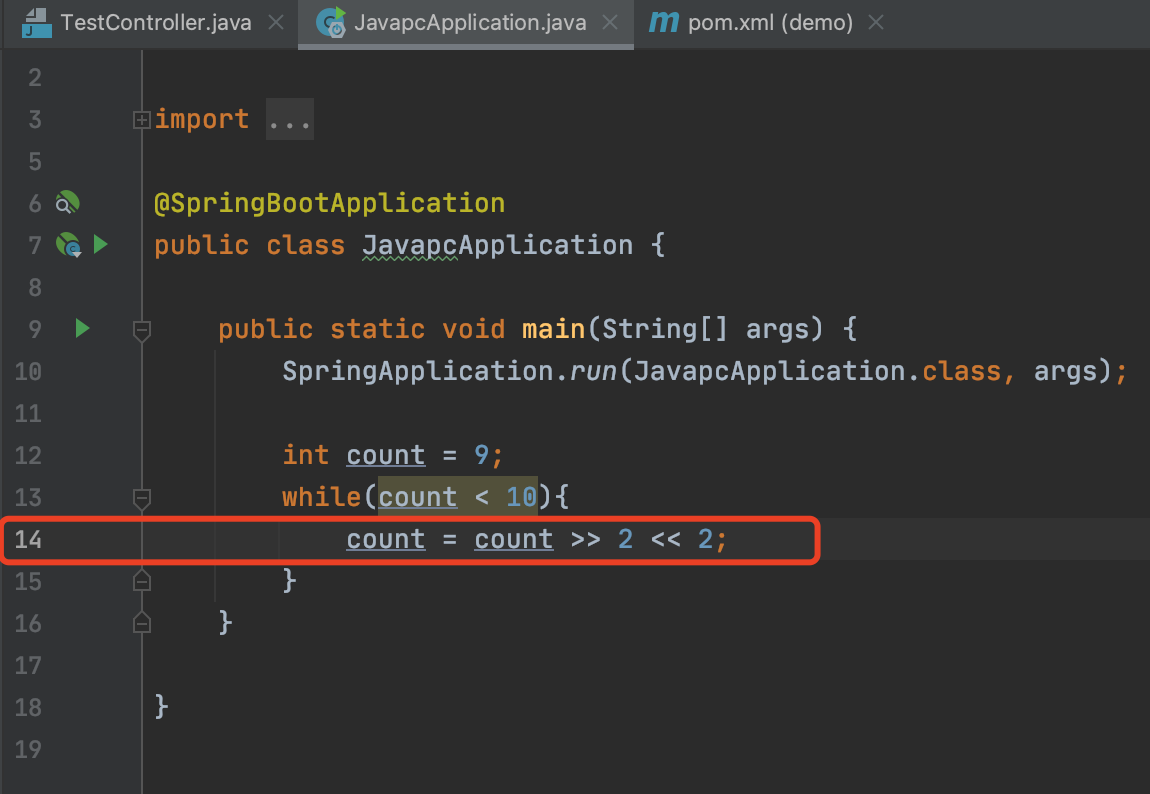
        SpringApplication.run(JavapcApplication.class, args);

        int count = 9;
        while(count < 10){
            count = count >> 2 << 2;
            System.out.println(count);
        }
    }
}
pack
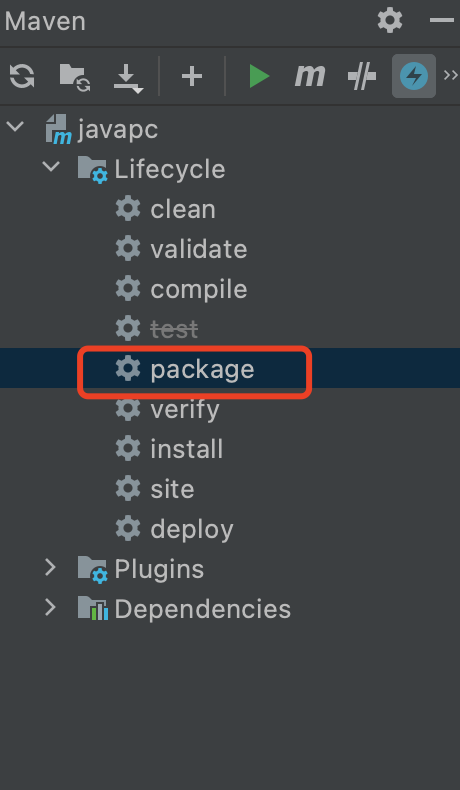
Demo-0.0.1-snapshot Upload the jar to the virtual machine and start it. Easy, no more details.
2, Troubleshooting
Start demo-0.0.1-snapshot jar
java -jar demo-0.0.1-SNAPSHOT.jar &
After startup, use the top -c command to display the list of running processes and find the java process number with the highest cpu share.
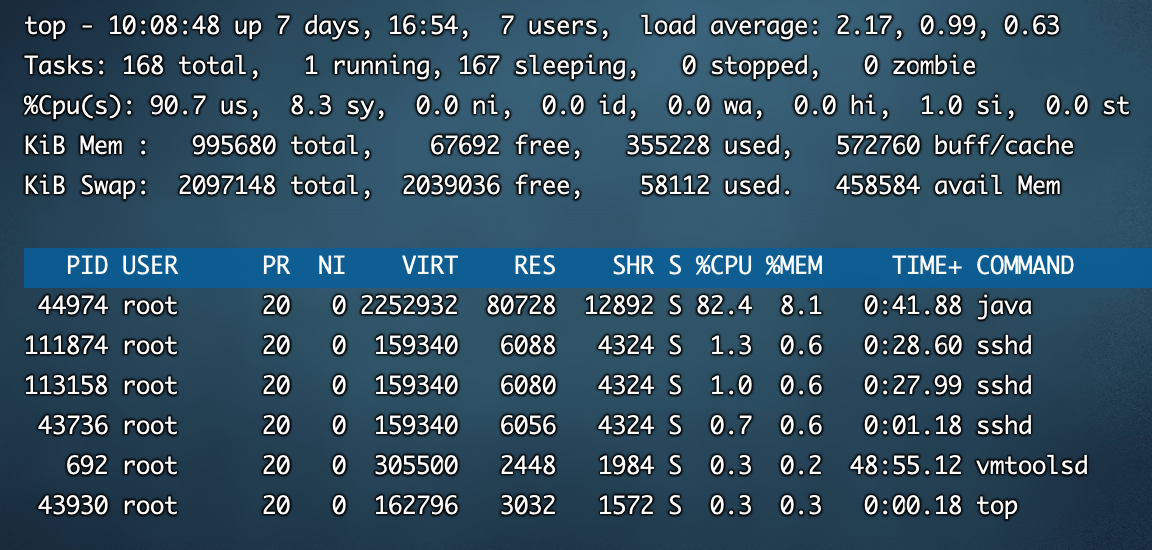
By shifting + P and sorting by cpu utilization, it can be seen that 44974 java processes occupy the highest cpu.
Next, use the jstack command to generate a snapshot of all threads in the Java process
jstack -l 44974 > /root/44974.stack
extend
Question:
The following errors may be reported when executing the command:
Unable to open socket file: target process not responding or HotSpot VM not loaded
analysis:
Hsperfdata is automatically created when the Java process starts_$ User directory and generate 44974 files, hsperfdata_$ The user directory will be created in the / tmp directory by default, as shown in the following figure:

Because everything in Linux is a file, that is, a Java process actually corresponds to a PID file. The stack command depends on the PID file of the process, that is, the 44974 file. An error is reported because the PID file may have been deleted by the system.
Who deleted it? Of course, the linux system deleted it itself.
The linux system has a deletion management mechanism: the system will use the tmpwatch command to check and delete files and directories that have not been accessed for more than 240 hours under / tmp every day.
solve:
https://bxoon.blog.csdn.net/article/details/111881528
Use top -Hp pid to view the threads occupying the highest cup in the java process, or use shift + p to sort
top -Hp 44947
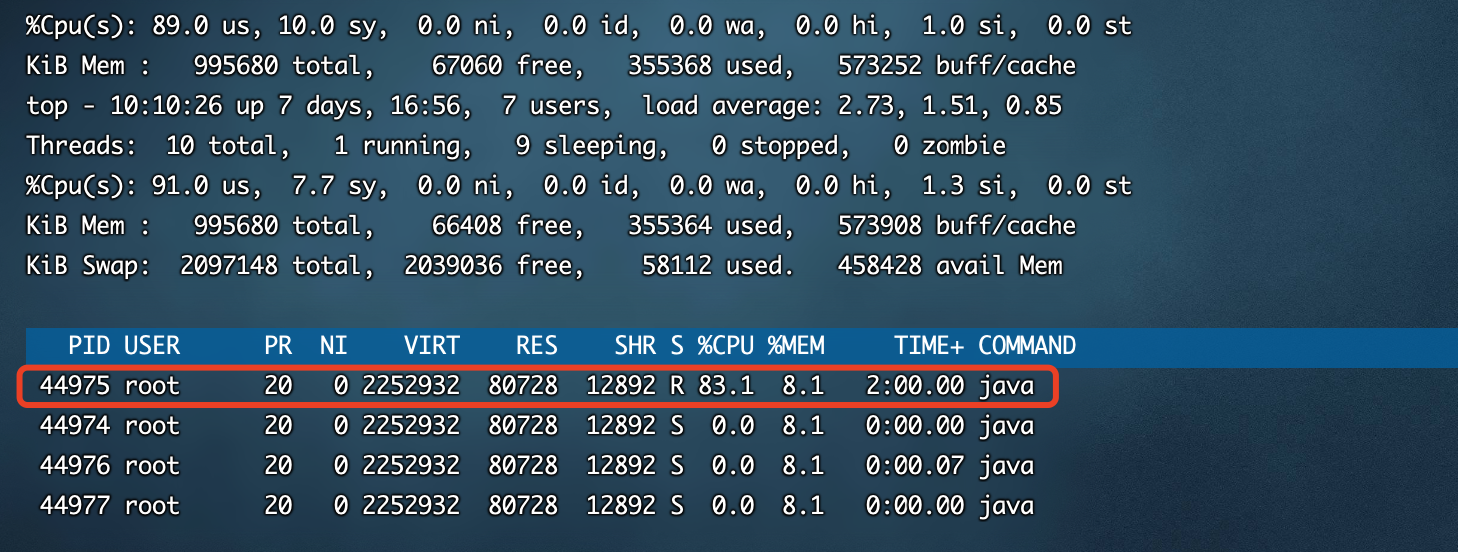
It can be seen from the above figure that the 44975 process has the highest cpu utilization, and the 44975 decimal number is converted to hexadecimal
[root@localhost ~]# printf "%x\n" 44975
afaf
Enter the / root directory and open the 44974.0 file just generated by the stack command Stack file and search for afaf in the file
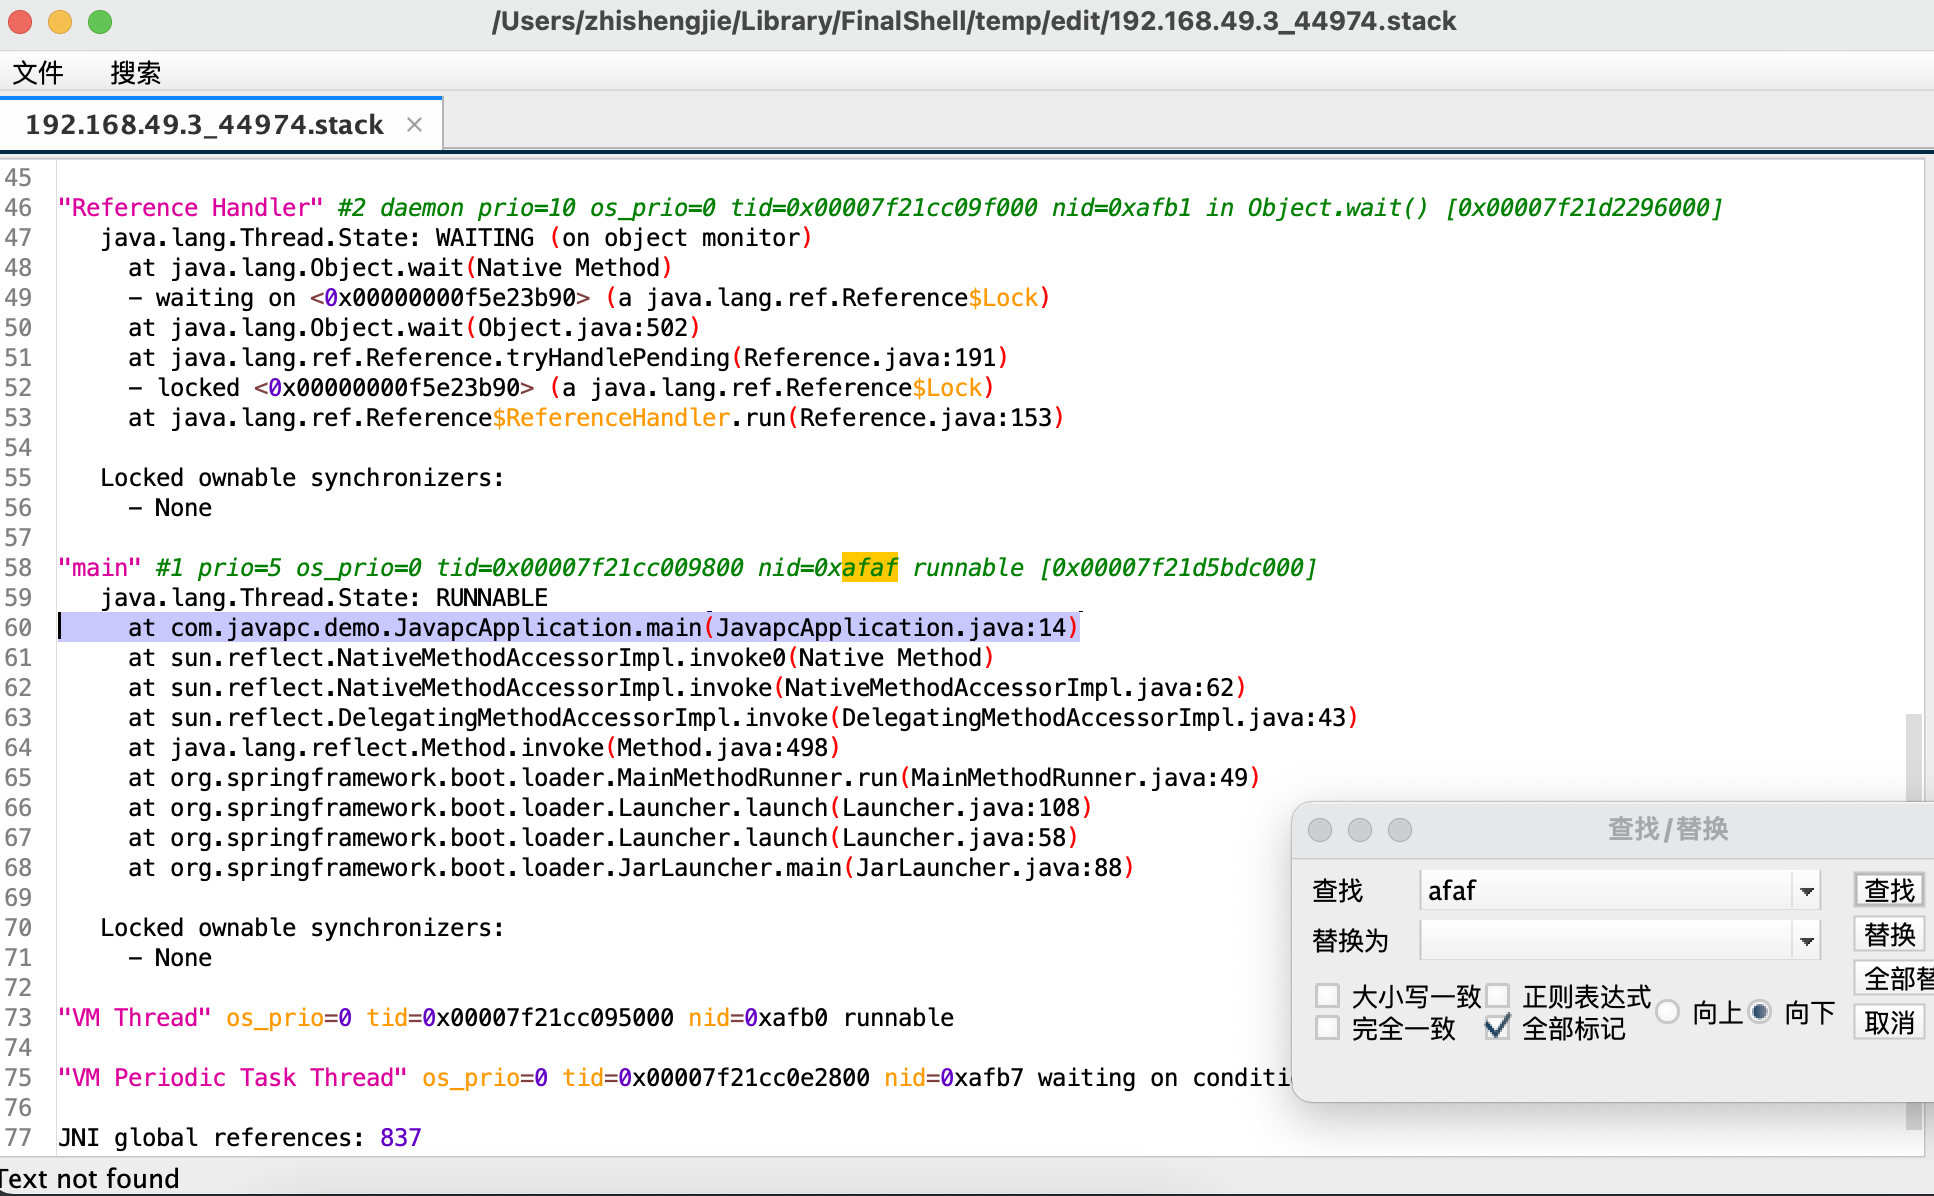
At this point, the problem is javapcapplication Line 14 of Java
